6. MANOVA
Multivariate analysis of variance (MANOVA) is a generalized form of analysis of variance (ANOVA), It is used in cases where there are two or more dependent variables.
Example 1:
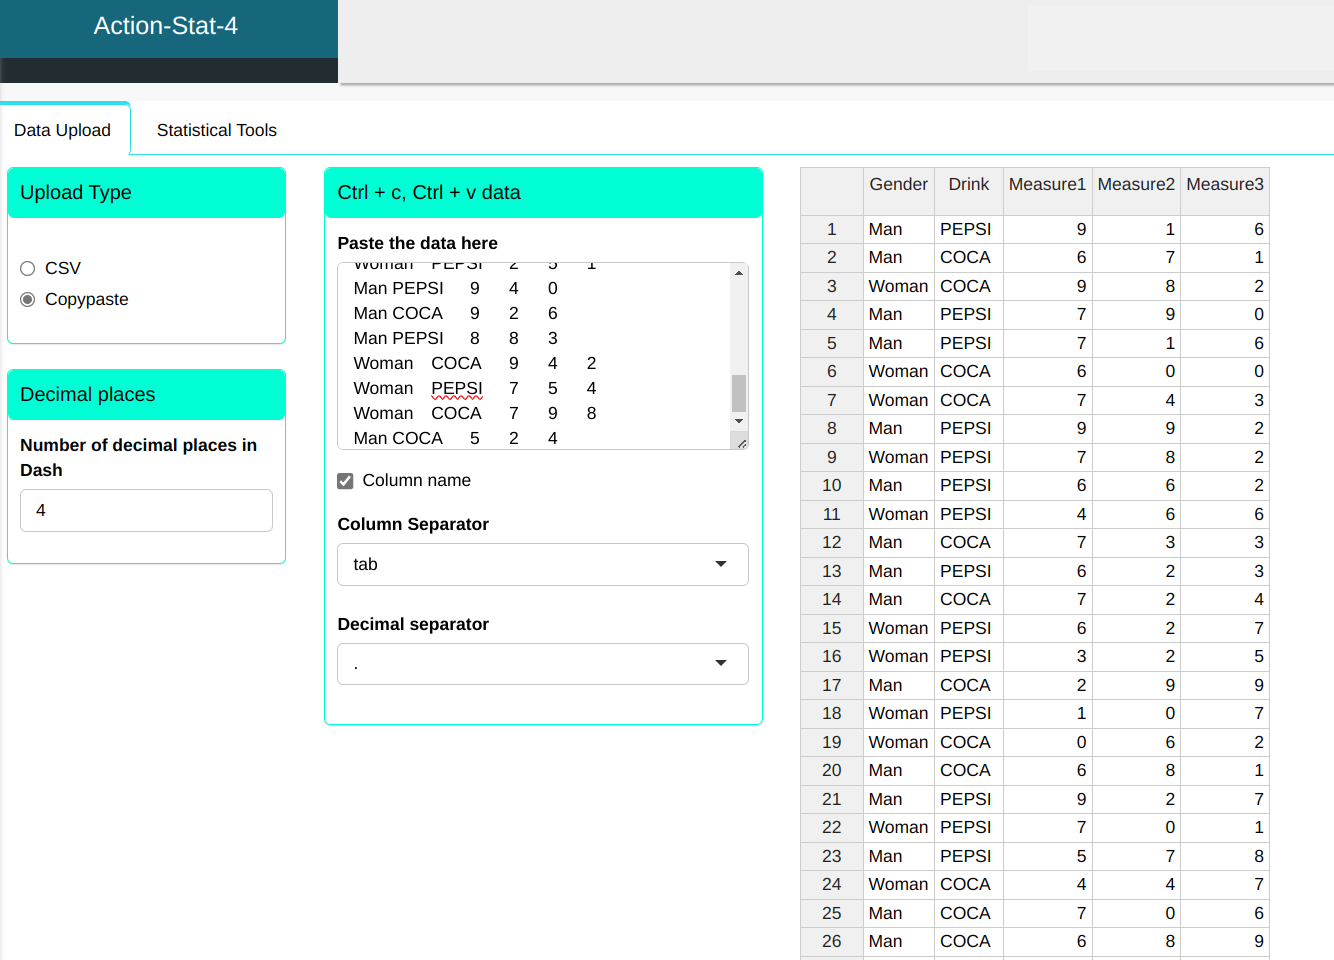
Each row in the table below represents a purchasing manager from large restaurant chains, The gender column identifies the gender of the manager, beverage identifies the drink served Coca or Pepsi and the variables Measure1, Measure2 and Measure3 contain information related to the company’s purchases over the last 23 months.
The aim of the analysis is to identify whether one manager bought more than another and whether one drink was bought more than another. We will use MANOVA to analyze the 1st Order model with 2-way interaction of the Gender and Beverage variables.
| Gender | Drink | Measure1 | Measure2 | Measure3 |
|---|---|---|---|---|
| Man | PEPSI | 9 | 1 | 6 |
| Man | COCA | 6 | 7 | 1 |
| Woman | COCA | 9 | 8 | 2 |
| Man | PEPSI | 7 | 9 | 0 |
| Man | PEPSI | 7 | 1 | 6 |
| Woman | COCA | 6 | 0 | 0 |
| Woman | COCA | 7 | 4 | 3 |
| Man | PEPSI | 9 | 9 | 2 |
| Woman | PEPSI | 7 | 8 | 2 |
| Man | PEPSI | 6 | 6 | 2 |
| Woman | PEPSI | 4 | 6 | 6 |
| Man | COCA | 7 | 3 | 3 |
| Man | PEPSI | 6 | 2 | 3 |
| Man | COCA | 7 | 2 | 4 |
| Woman | PEPSI | 6 | 2 | 7 |
| Woman | PEPSI | 3 | 2 | 5 |
| Man | COCA | 2 | 9 | 9 |
| Woman | PEPSI | 1 | 0 | 7 |
| Woman | COCA | 0 | 6 | 2 |
| Man | COCA | 6 | 8 | 1 |
| Man | PEPSI | 9 | 2 | 7 |
| Woman | PEPSI | 7 | 0 | 1 |
| Man | PEPSI | 5 | 7 | 8 |
| Woman | COCA | 4 | 4 | 7 |
| Man | COCA | 7 | 0 | 6 |
| Man | COCA | 6 | 8 | 9 |
| Man | PEPSI | 5 | 1 | 6 |
| Woman | PEPSI | 5 | 1 | 6 |
| Woman | PEPSI | 7 | 5 | 2 |
| Man | COCA | 3 | 6 | 0 |
| Man | PEPSI | 2 | 3 | 9 |
| Woman | COCA | 1 | 7 | 2 |
| Woman | PEPSI | 9 | 7 | 8 |
| Man | COCA | 9 | 2 | 2 |
| Man | COCA | 7 | 9 | 8 |
| Man | COCA | 5 | 3 | 5 |
| Woman | PEPSI | 7 | 6 | 5 |
| Woman | PEPSI | 6 | 7 | 3 |
| Woman | PEPSI | 5 | 1 | 3 |
| Man | COCA | 7 | 6 | 2 |
| Man | PEPS | 3 | 5 | 2 |
| Man | COCA | 5 | 5 | 7 |
| Woman | PEPSI | 2 | 5 | 1 |
| Man | PEPSI | 9 | 4 | 0 |
| Man | COCA | 9 | 2 | 6 |
| Man | PEPSI | 8 | 8 | 3 |
| Woman | COCA | 9 | 4 | 2 |
| Woman | PEPSI | 7 | 5 | 4 |
| Woman | COCA | 7 | 9 | 8 |
| Man | COCA | 5 | 2 | 4 |
We will upload the data to the system.
Configuring as shown in the figure below to perform the MANOVA
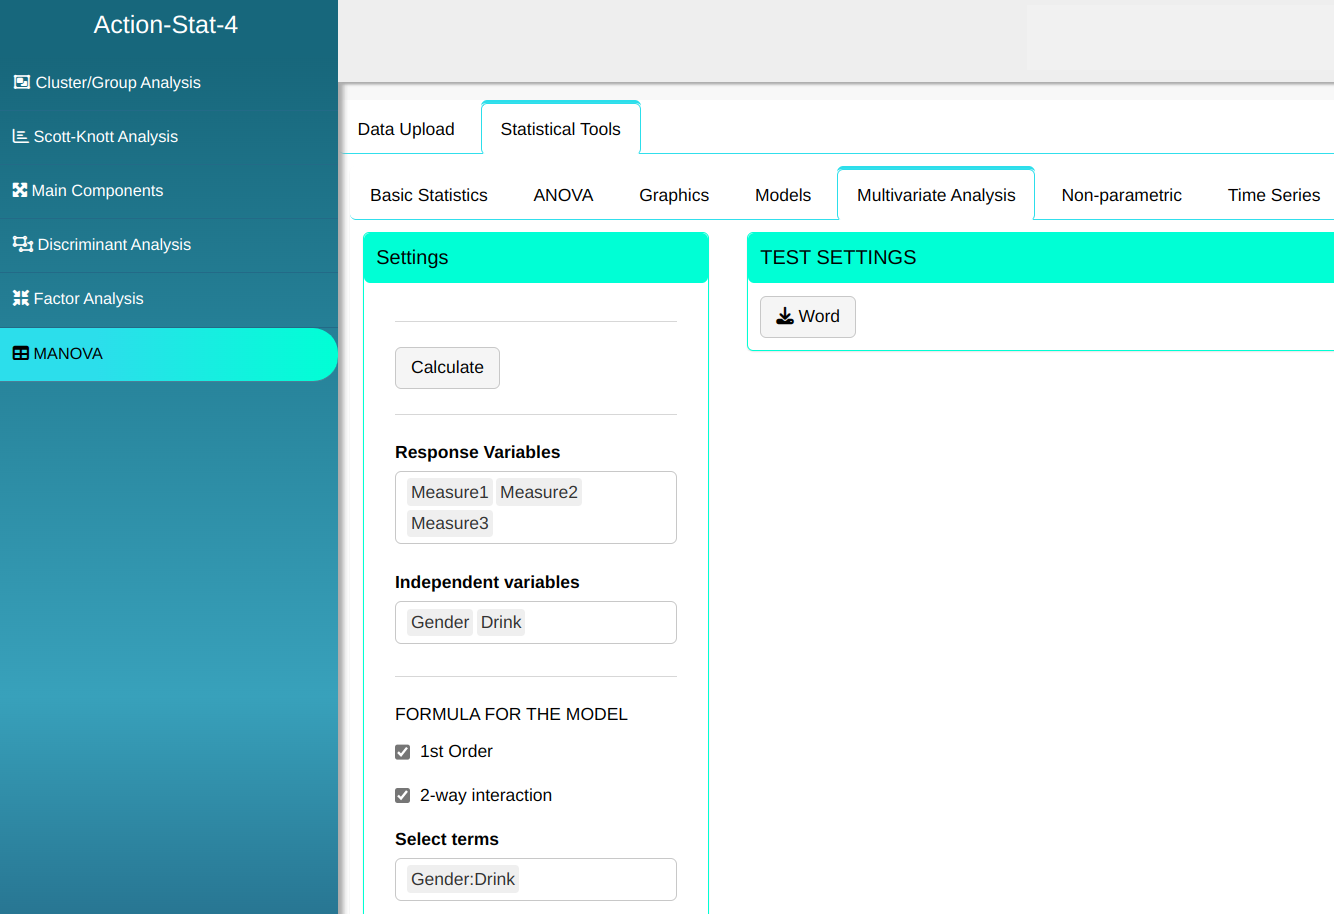

Then click Calculate to get the results. You can also generate the analyses and download them in Word format.

The results are:
Average table by group
| Groups | Drink | Measure1 | Measure2 | Measure3 |
|---|---|---|---|---|
| Man | COCA | 6.067 | 4.800 | 4.467 |
| Woman | COCA | 5.375 | 5.250 | 3.250 |
| Man | PEPSI | 6.538 | 4.462 | 4.154 |
| Woman | PEPSI | 5.429 | 3.929 | 4.286 |
Covariance Matrix
| Measure1 | Measure2 | Measure3 | |
|---|---|---|---|
| Measure1 | 5.602 | 0.096 | -0.680 |
| Measure2 | 0.096 | 8.335 | -0.465 |
| Measure3 | -0.680 | -0.465 | 7.429 |
MANOVA Table
| D.F. | Wilks Stat. | F Stat. | D.F. Numerator | D.F.Denominator | P-Value | |
|---|---|---|---|---|---|---|
| Gender | 1 | 0.954 | 0.703 | 3 | 44 | 0.555 |
| Drink | 1 | 0.977 | 0.349 | 3 | 44 | 0.790 |
| Gender:Drink | 1 | 0.978 | 0.324 | 3 | 44 | 0.808 |
| Residuals | 46 |
From the Wilks tests in the MANOVA table, we can conclude that there is no significant difference in purchases in the last 23 months for the drink factor or the gender factor. The interaction is also not significant.
Example 2:
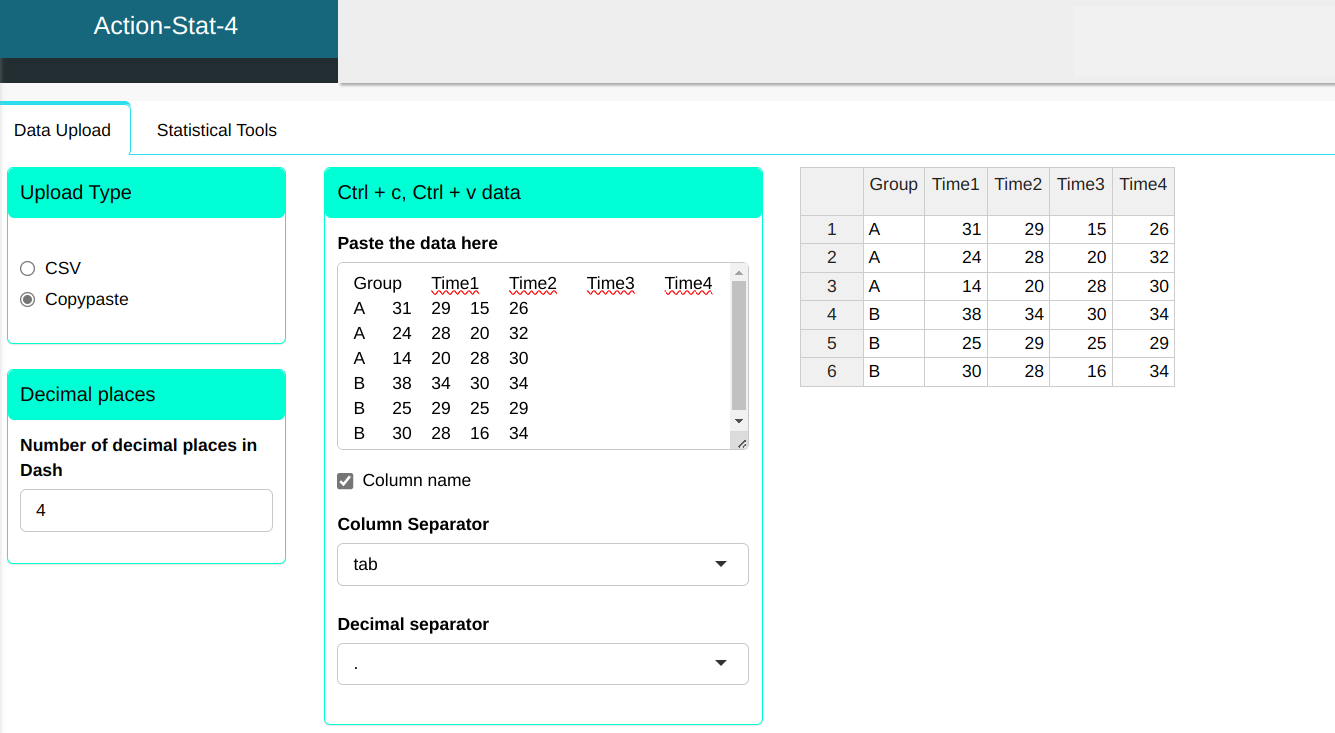
Two groups/types of treatment (A and B) were carried out in a sample with four measurements at equally spaced time intervals. Treatment A corresponds to the active treatment and B, to the Placebo.
Questões de interesse
-
Overall, are there any significant differences between the TEMPO points?
-
Do the two groups differ at any moment, i.e. is there a treatment effect?
-
Do the two groups differ in their responses over time, i.e. is there a TIME\ TREATMENT interaction?
Premissas
-
Both repeated measures ANOVA and MANOVA assume that the time intervals are equally spaced.
-
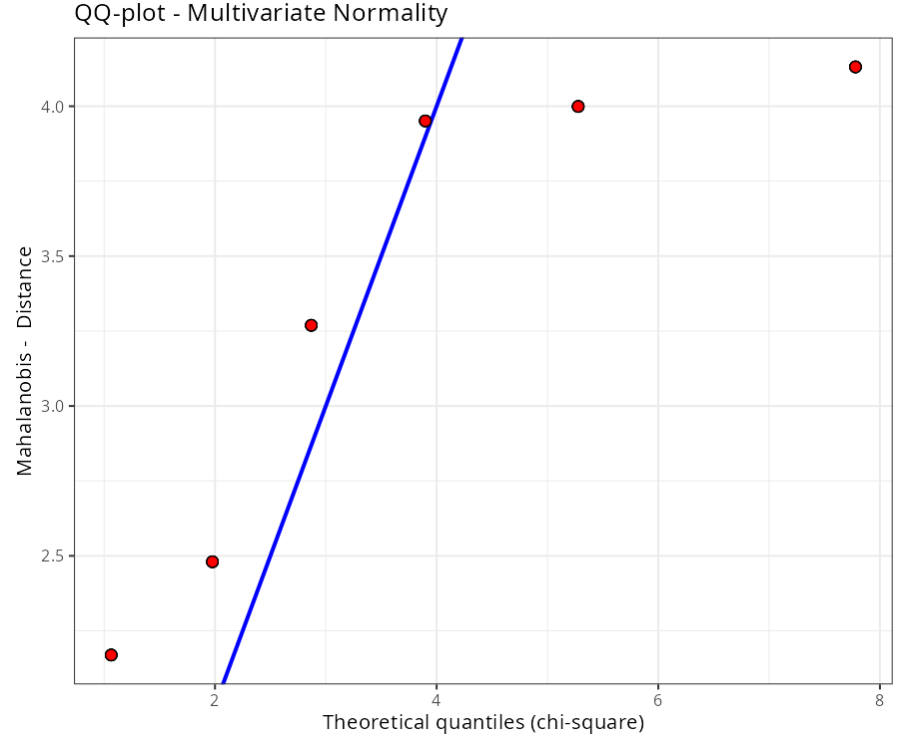
Both methods assume the response is normally distributed, but both approaches are robust against violations of normality.
-
Both approaches require complete data on all subjects, i.e. no missing observations for any subjects.
| Group | Time1 | Time2 | Time3 | Time4 |
|---|---|---|---|---|
| A | 31 | 29 | 15 | 26 |
| A | 24 | 28 | 20 | 32 |
| A | 14 | 20 | 28 | 30 |
| B | 38 | 34 | 30 | 34 |
| B | 25 | 29 | 25 | 29 |
| B | 30 | 28 | 16 | 34 |
We will upload the data to the system.
Configuring as shown in the figure below to perform the MANOVA
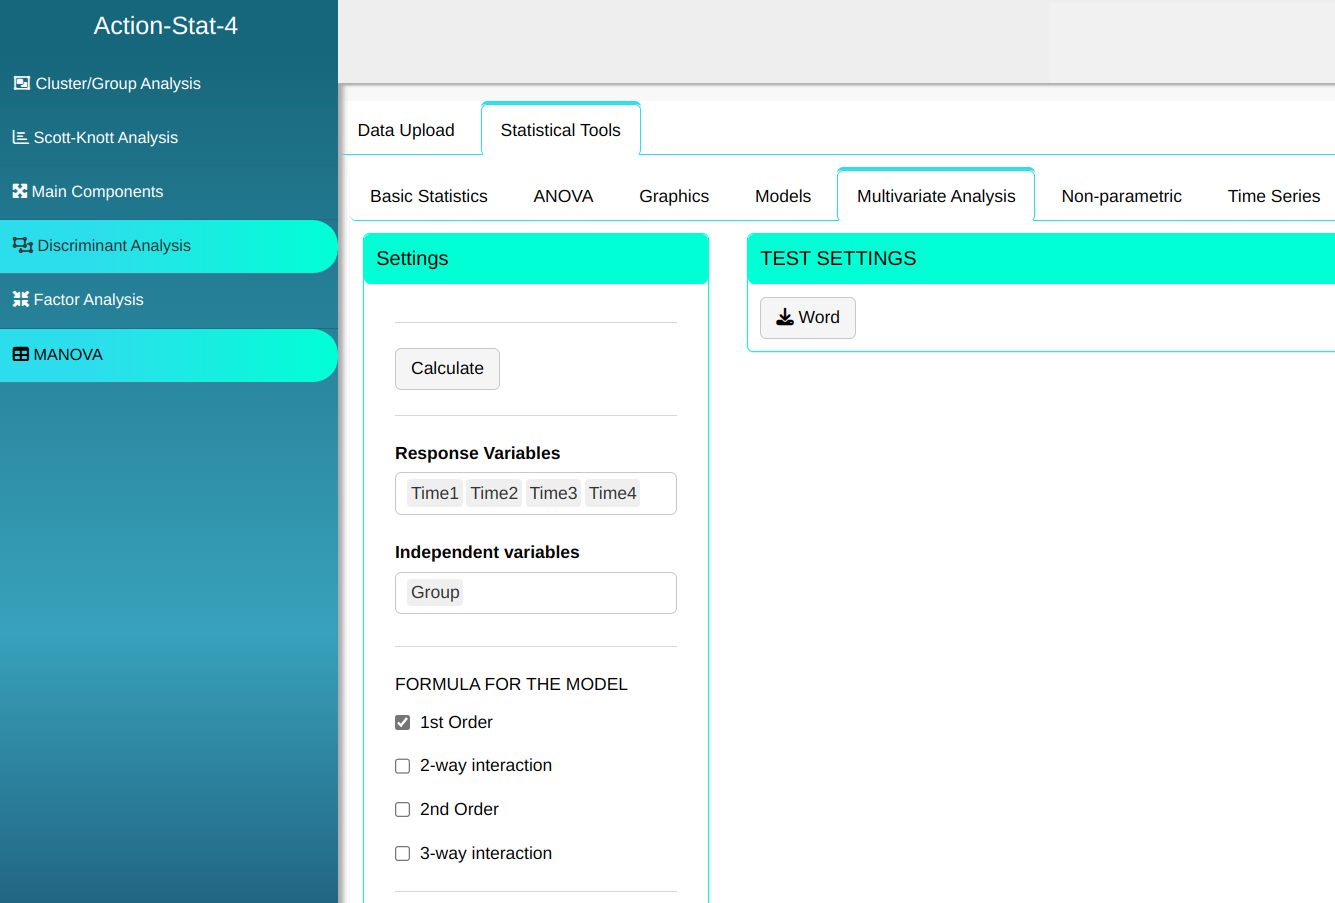

Then click Calculate to get the results. You can also generate the analyses and download them in Word format.
The results are:
Average table by group
| Groups | Time1 | Time2 | Time3 | Time4 |
|---|---|---|---|---|
| A | 23 | 25.667 | 21.000 | 29.333 |
| B | 31 | 30.333 | 23.667 | 32.333 |
Covariance Matrix
| Time1 | Time2 | Time3 | Time4 | |
|---|---|---|---|---|
| Time1 | 65.6 | 34.4 | -7.200 | 7.200 |
| Time2 | 34.4 | 20.4 | -0.800 | 3.800 |
| Time3 | -7.2 | -0.8 | 39.467 | 5.467 |
| Time4 | 7.2 | 3.8 | 5.467 | 9.767 |
MANOVA Table
| D.F. | Wilks Stat. | F. Stat. | D.F. Numerator | D.F.Denominator | P-Value | |
|---|---|---|---|---|---|---|
| Group | 1 | 0.508 | 0.242 | 4 | 1 | 0.888 |
| Residuals | 4 |
ANOVA Table: Time1
| D.F. | Sum of Square | Mean Square | F. Stat. | P-Value | |
|---|---|---|---|---|---|
| Group | 1 | 96 | 96 | 1.655 | 0.268 |
| Residuals | 4 | 232 | 58 |
ANOVA Table: Time2
| D.F. | Sum of Square | Mean Square | F. Stat. | P-Value | |
|---|---|---|---|---|---|
| Group | 1 | 32.667 | 32.667 | 1.885 | 0.242 |
| Residuals | 4 | 69.333 | 17.333 |
ANOVA Table: Time3
| D.F. | Sum of Square | Mean Square | F. Stat. | P-Value | |
|---|---|---|---|---|---|
| Group | 1 | 10.667 | 10.667 | 0.229 | 0.658 |
| Resisuals | 4 | 186.667 | 46.667 |
ANOVA Table: Time4
| D.F. | Sum of Square | Mean Square | F. Stat. | P-Value | |
|---|---|---|---|---|---|
| Group | 1 | 13.500 | 13.500 | 1.528 | 0.,284 |
| Residuals | 4 | 35.333 | 8.833 |