4. Mixture
This category of experimental design is suitable for determining the correct proportions of components or ingredients to obtain a final product.
Example 1:
Three pesticides were sprayed onto a plant in an attempt to control the mite population.
To perform the statistical analysis, configure as shown in the following figure.
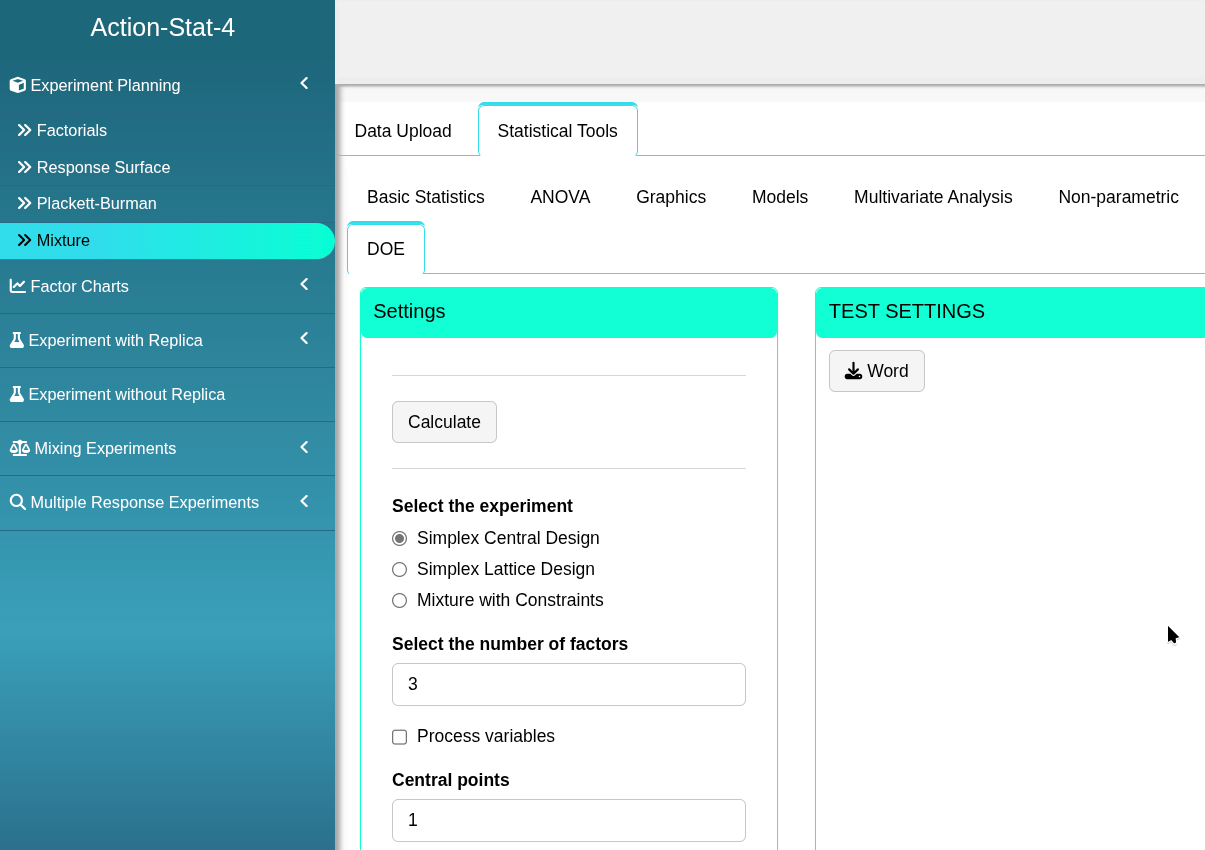

Clicking on Calculate will give you the results, as well as the option to generate and download the analysis in Word format.

The results are:
Simplex Central Design
| Order | x1 | x2 | x3 | |
|---|---|---|---|---|
| 1 | 1 | 0.3333 | 0.3333 | 0.3333 |
| 2 | 2 | 1.0000 | 0.0000 | 0.0000 |
| 3 | 3 | 0.5000 | 0.0000 | 0.5000 |
| 4 | 4 | 1.0000 | 0.0000 | 0.0000 |
| 5 | 5 | 0.5000 | 0.0000 | 0.5000 |
| 6 | 6 | 0.3333 | 0.3333 | 0.3333 |
| 7 | 7 | 0.0000 | 0.5000 | 0.5000 |
| 8 | 8 | 0.3333 | 0.3333 | 0.3333 |
| 9 | 9 | 0.0000 | 0.0000 | 1.0000 |
| 10 | 10 | 0.5000 | 0.5000 | 0.0000 |
| 11 | 11 | 0.3333 | 0.3333 | 0.3333 |
| 12 | 12 | 0.0000 | 0.0000 | 1.0000 |
| 13 | 13 | 0.5000 | 0.5000 | 0.0000 |
| 14 | 14 | 0.0000 | 1.0000 | 0.0000 |
| 15 | 15 | 0.0000 | 0.5000 | 0.5000 |
| 16 | 16 | 0.0000 | 1.0000 | 0.0000 |
Example 2:
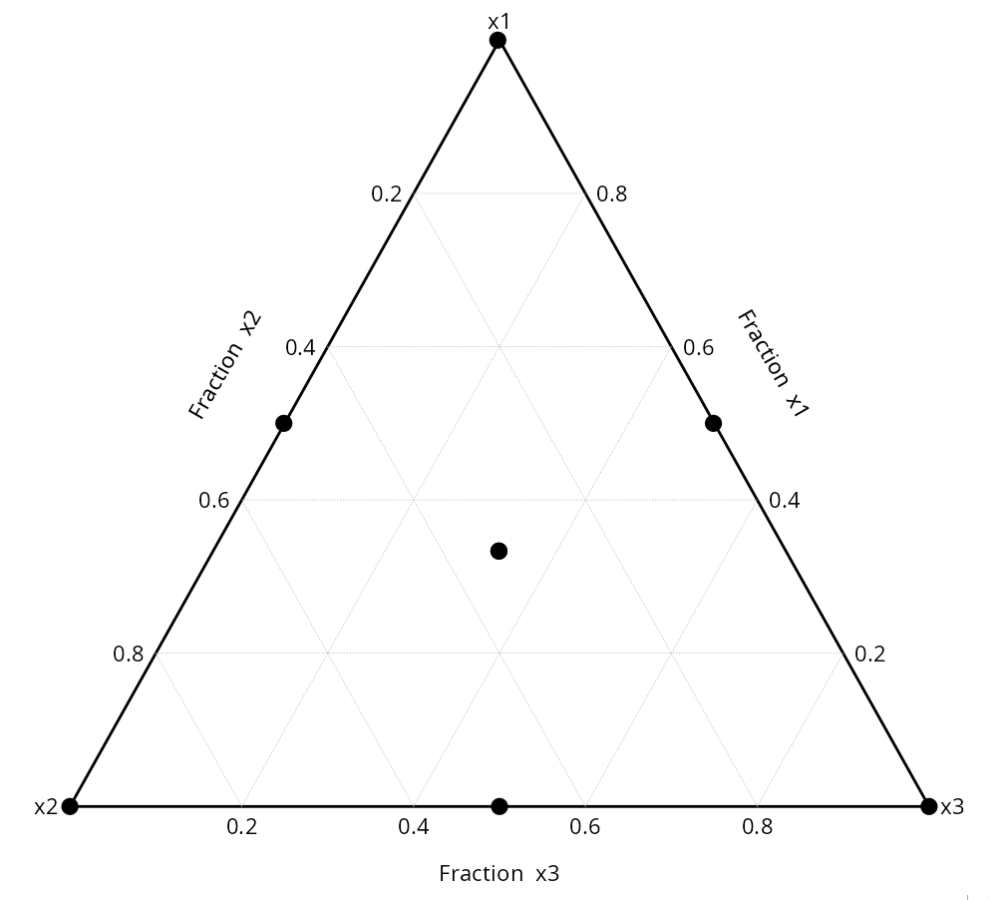
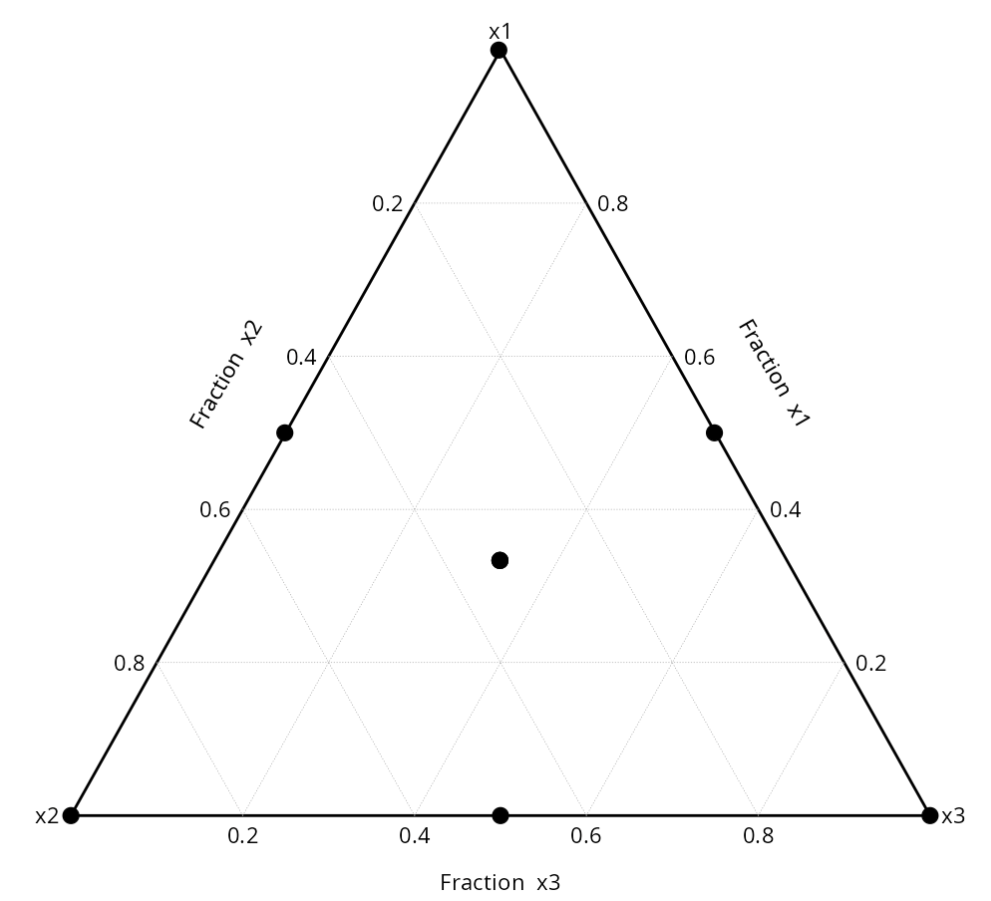
Suppose that three ingredients are essential in the analysis of a chemical process and that, in order to more accurately study the relationship between the ingredients and the response of interest, a {3,2} experimental design was conducted. In addition to the points corresponding to the Lattice design, three additional experiments were performed at the central points in this study.
To perform the statistical analysis, configure as shown in the following figure.
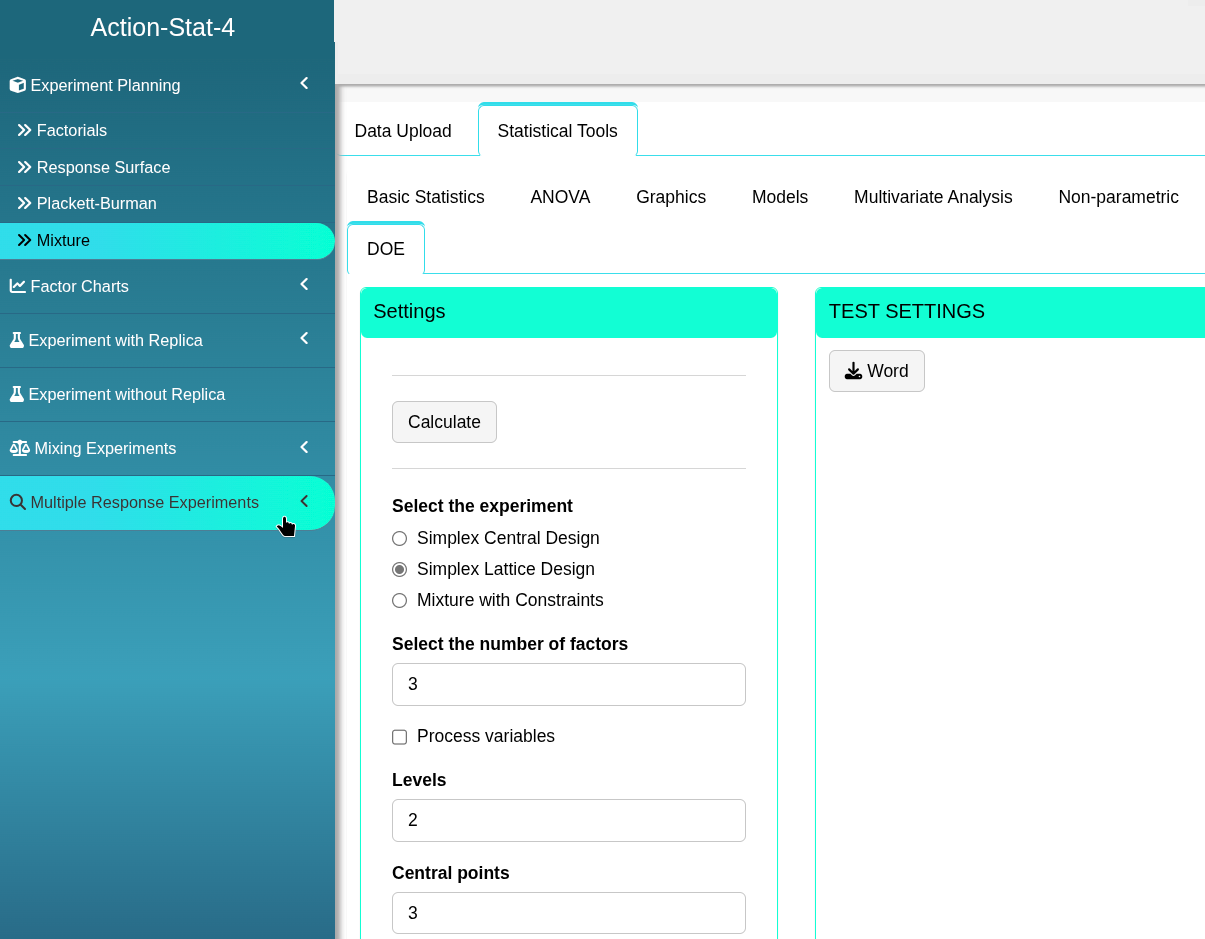

Clicking on Calculate will give you the results, as well as the option to generate and download the analysis in Word format.
The results are:
Simplex Lattice Design
| Order | x1 | x2 | x3 | |
|---|---|---|---|---|
| 1 | 1 | 0.0000 | 0.0000 | 1.0000 |
| 2 | 2 | 0.3333 | 0.3333 | 0.3333 |
| 3 | 3 | 0.3333 | 0.3333 | 0.3333 |
| 4 | 4 | 0.0000 | 1.0000 | 0.0000 |
| 5 | 5 | 0.5000 | 0.0000 | 0.5000 |
| 6 | 6 | 0.0000 | 0.5000 | 0.5000 |
| 7 | 7 | 0.3333 | 0.3333 | 0.3333 |
| 8 | 8 | 0.5000 | 0.5000 | 0.0000 |
| 9 | 9 | 1.0000 | 0.0000 | 0.0000 |
Example 3:
A cake manufacturing company wants to determine the correct proportions for a suitable batter. To do this, they designed an experiment with two replicates and the following ingredients:
- Sugar;
- Flour;
- Yeast.
Considerando os seguintes limites de medida:
| $\quad$X1 | $\quad$X2 | $\quad$X3 |
| (0,2;0,3) | (0,6;0,7) | (0;0,1) |
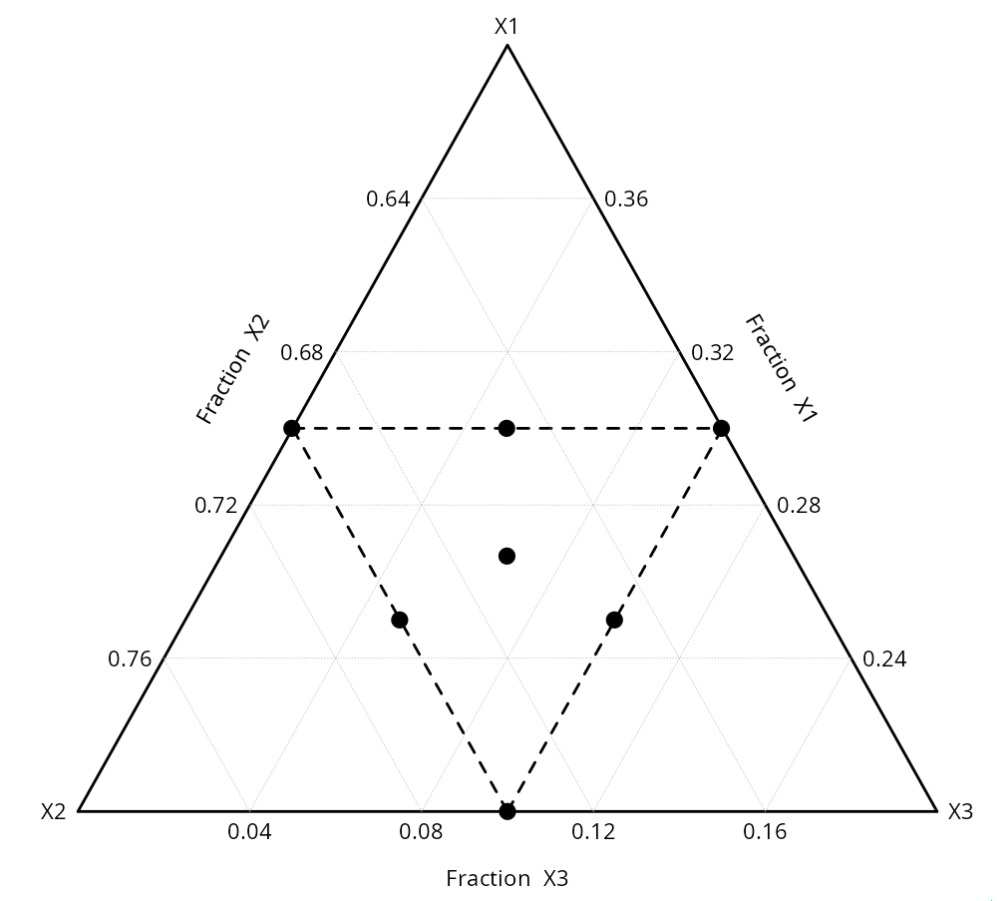
To perform the statistical analysis, configure as shown in the following figure.
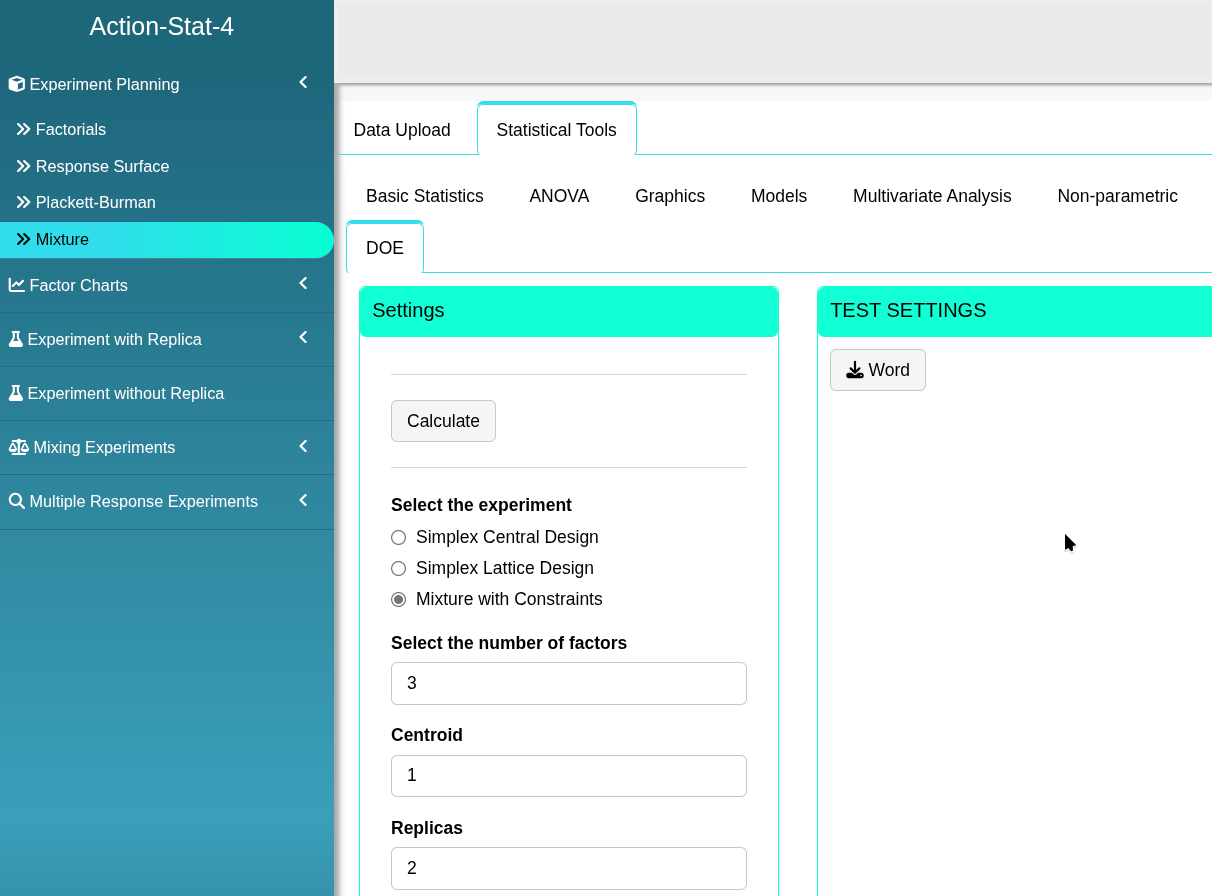
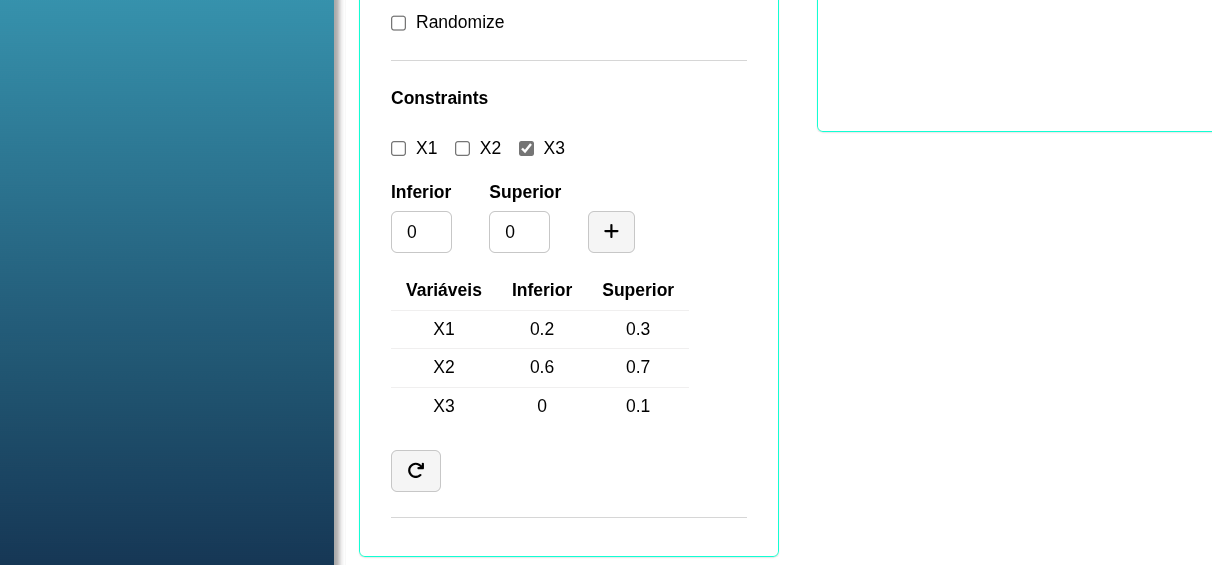
Clicking on Calculate will give you the results, as well as the option to generate and download the analysis in Word format.
The results are:
Misture with Constraints
| Order | X1 | X2 | X3 | |
|---|---|---|---|---|
| 1 | 1 | 0.2500 | 0.7000 | 0.0500 |
| 2 | 2 | 0.2500 | 0.6500 | 0.1000 |
| 3 | 3 | 0.2667 | 0.6667 | 0.0667 |
| 4 | 4 | 0.3000 | 0.6500 | 0.0500 |
| 5 | 5 | 0.3000 | 0.7000 | 0.0000 |
| 6 | 6 | 0.2000 | 0.7000 | 0.1000 |
| 7 | 7 | 0.2500 | 0.7000 | 0.0500 |
| 8 | 8 | 0.3000 | 0.7000 | 0.0000 |
| 9 | 9 | 0.3000 | 0.6000 | 0.1000 |
| 10 | 10 | 0.3000 | 0.6000 | 0.1000 |
| 11 | 11 | 0.2500 | 0.6500 | 0.1000 |
| 12 | 12 | 0.2667 | 0.6667 | 0.0667 |
| 13 | 13 | 0.2000 | 0.7000 | 0.1000 |
| 14 | 14 | 0.3000 | 0.6500 | 0.0500 |