2. Scott-Knott Analysis
The Scott and Knott (1974) procedure is a technique that uses the likelihood ratio test to group n treatments into k groups.
Example 1:
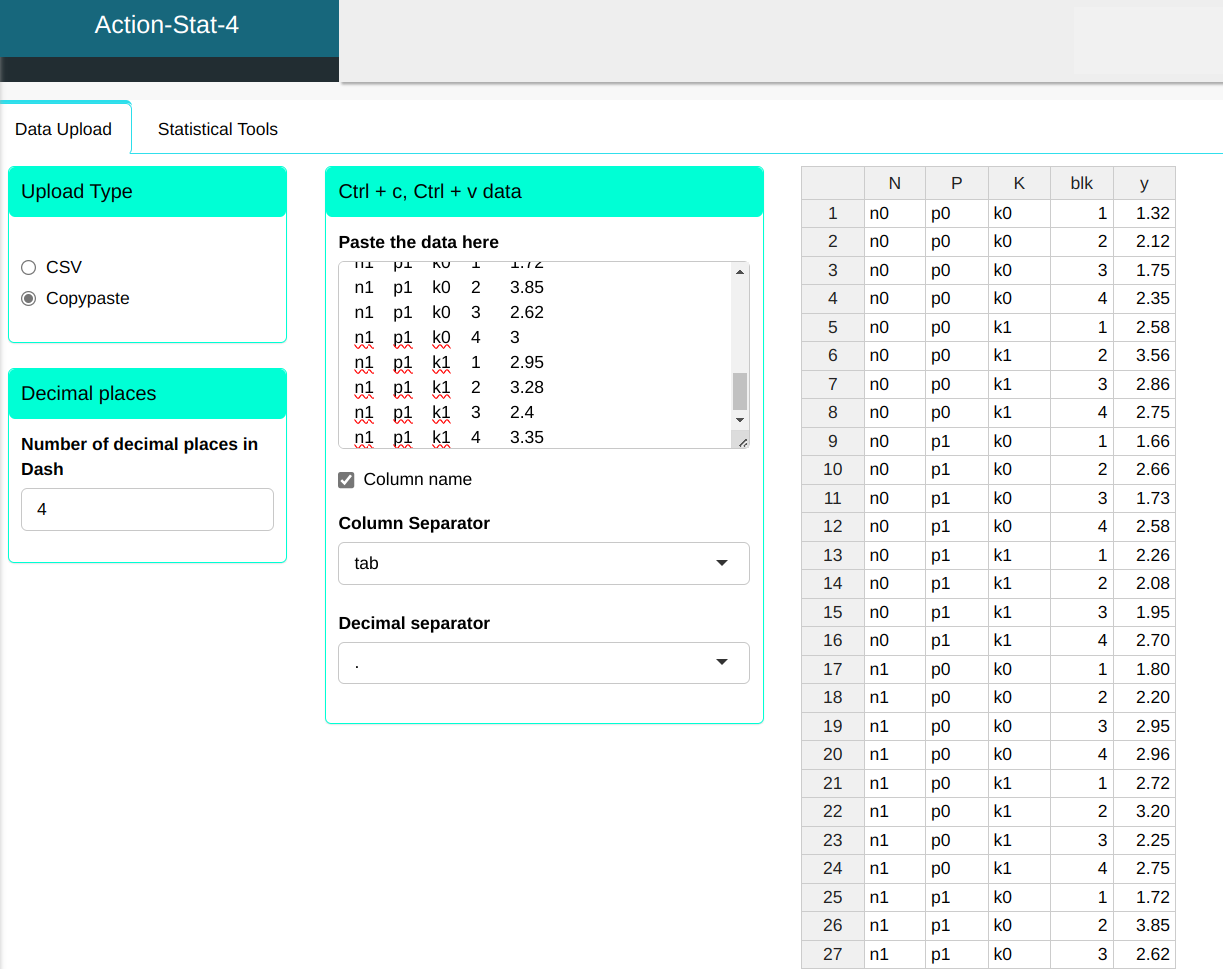
Let’s apply the Scott-Knott analysis to group the treatments in the table below into similar groups.
| N | P | K | blk | y |
|---|---|---|---|---|
| n0 | p0 | k0 | 1 | 1.32 |
| n0 | p0 | k0 | 2 | 2.12 |
| n0 | p0 | k0 | 3 | 1.75 |
| n0 | p0 | k0 | 4 | 2.35 |
| n0 | p0 | k1 | 1 | 2.58 |
| n0 | p0 | k1 | 2 | 3.56 |
| n0 | p0 | k1 | 3 | 2.86 |
| n0 | p0 | k1 | 4 | 2.75 |
| n0 | p1 | k0 | 1 | 1.66 |
| n0 | p1 | k0 | 2 | 2.66 |
| n0 | p1 | k0 | 3 | 1.73 |
| n0 | p1 | k0 | 4 | 2.58 |
| n0 | p1 | k1 | 1 | 2.26 |
| n0 | p1 | k1 | 2 | 2.08 |
| n0 | p1 | k1 | 3 | 1.95 |
| n0 | p1 | k1 | 4 | 2.7 |
| n1 | p0 | k0 | 1 | 1.8 |
| n1 | p0 | k0 | 2 | 2.2 |
| n1 | p0 | k0 | 3 | 2.95 |
| n1 | p0 | k0 | 4 | 2.96 |
| n1 | p0 | k1 | 1 | 2.72 |
| n1 | p0 | k1 | 2 | 3.2 |
| n1 | p0 | k1 | 3 | 2.25 |
| n1 | p0 | k1 | 4 | 2.75 |
| n1 | p1 | k0 | 1 | 1.72 |
| n1 | p1 | k0 | 2 | 3.85 |
| n1 | p1 | k0 | 3 | 2.62 |
| n1 | p1 | k0 | 4 | 3 |
| n1 | p1 | k1 | 1 | 2.95 |
| n1 | p1 | k1 | 2 | 3.28 |
| n1 | p1 | k1 | 3 | 2.4 |
| n1 | p1 | k1 | 4 | 3.35 |
We will upload the data to the system.
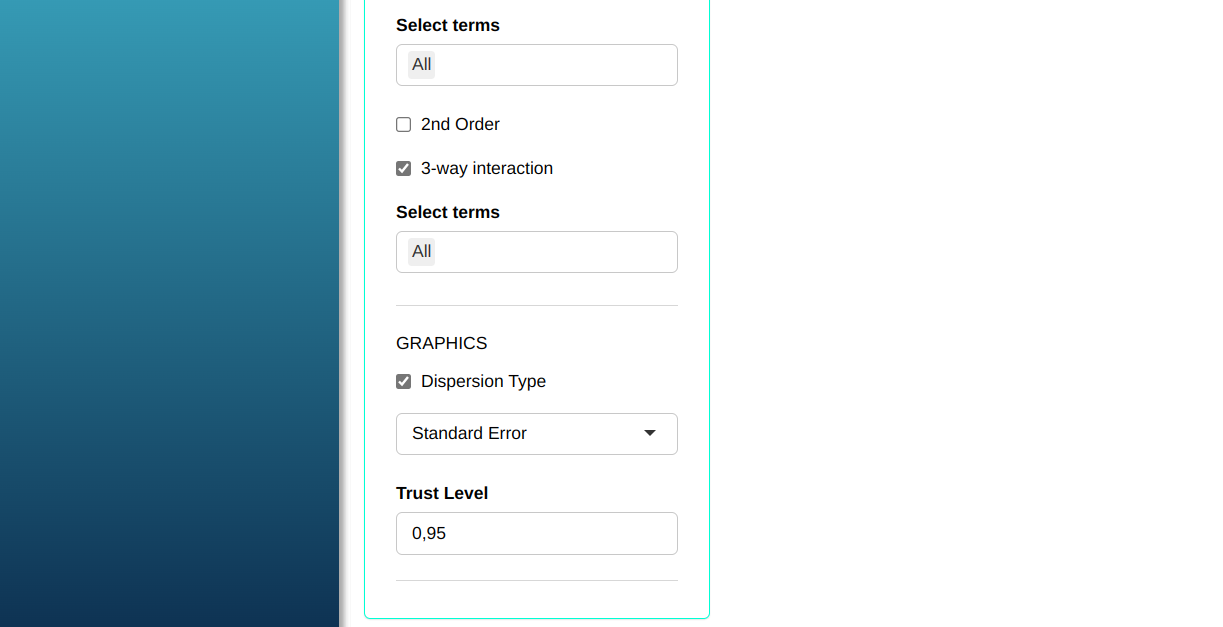
The Scott-Knott analysis will be performed with the settings shown in the figure below.
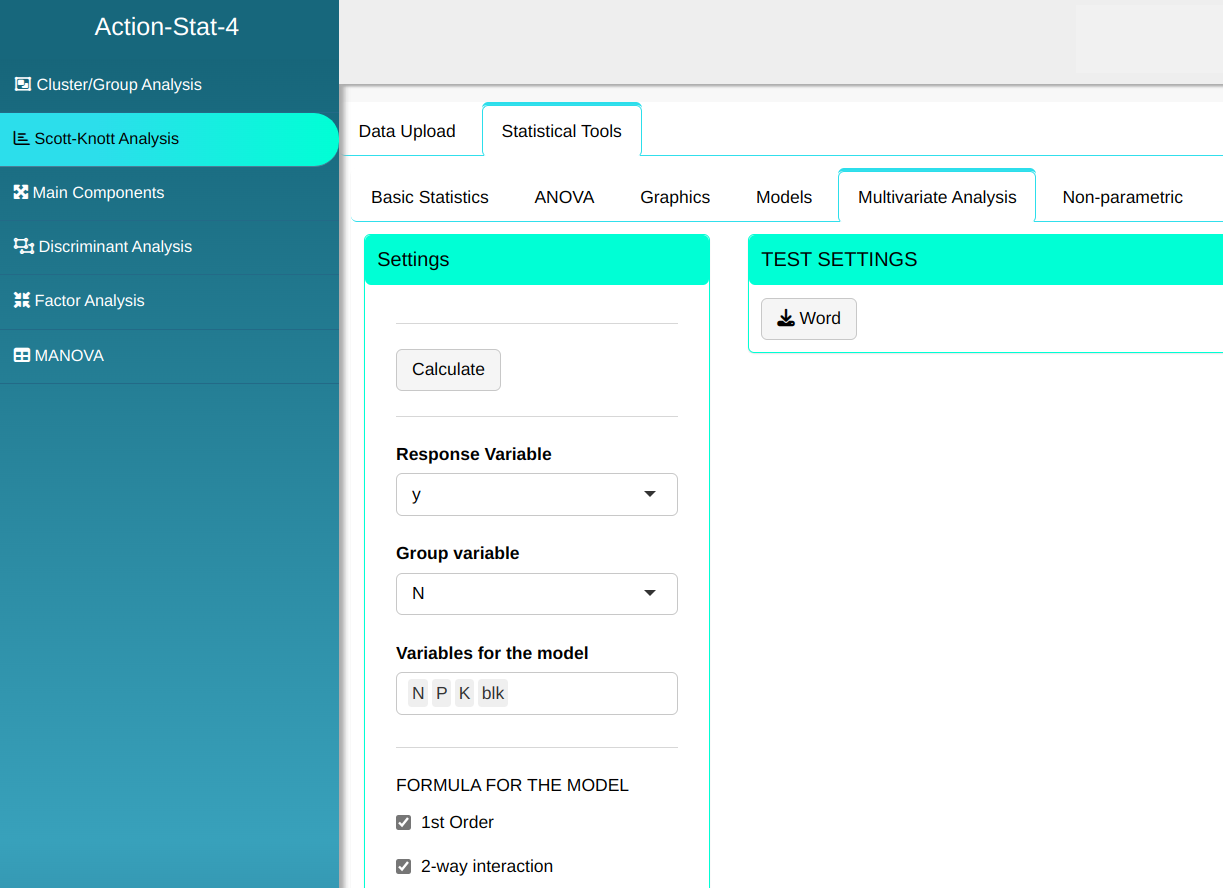
Then click Calculate to get the results. You can also generate the analyses and download them in Word format.

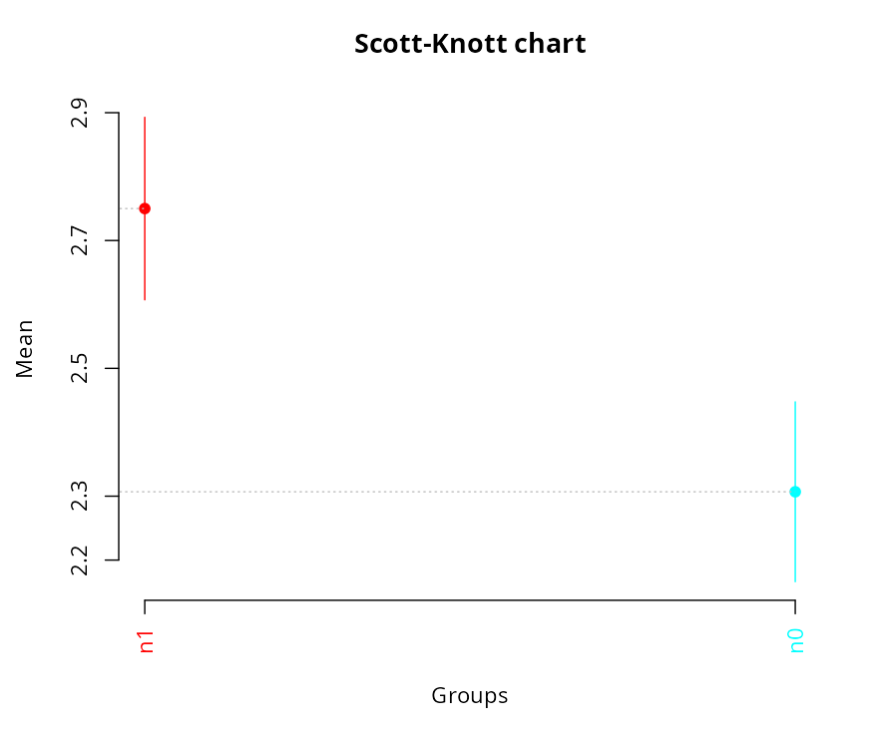
The results are:
Agrupamento (Algoritmo de Scott-Knott)
| Groups | Mean | Scott-Knott | Mean+Standard Error | Mean - Standard Error |
|---|---|---|---|---|
| n1 | 2.750 | a | 2.607 | 2.893 |
| n0 | 2.307 | b | 2.166 | 2.448 |
Example 2:
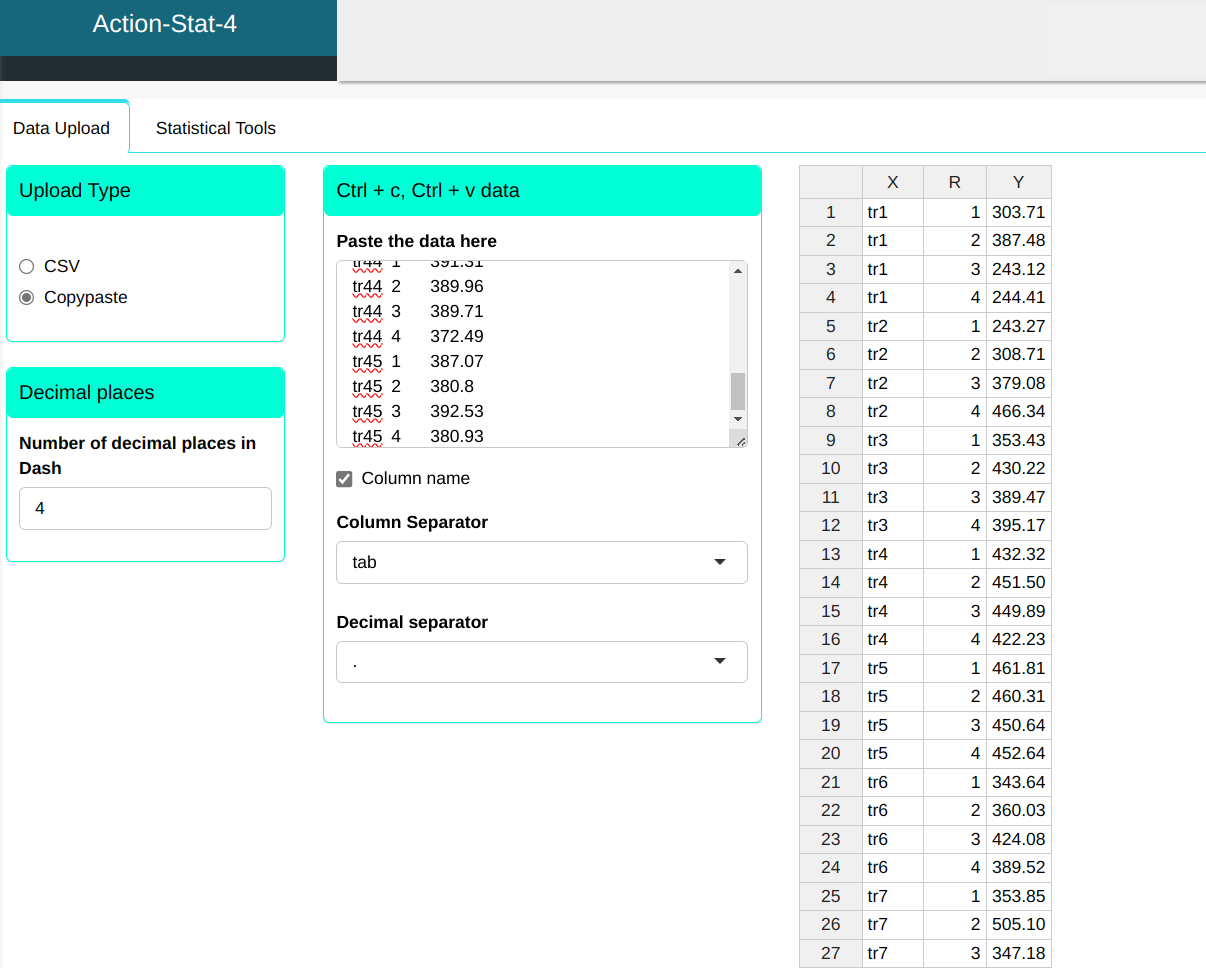
The data in the table below refers to 45 different types of treatments (column X) with 4 replicates each (column R). The responses were measured in the y column. Let’s apply Scott-Knott analysis to group these treatments into similar groups.
| X | R | Y |
|---|---|---|
| tr-1 | 1 | 303.71 |
| tr-1 | 2 | 387.48 |
| tr-1 | 3 | 243.12 |
| tr-1 | 4 | 244.41 |
| tr-2 | 1 | 243.27 |
| tr-2 | 2 | 308.71 |
| tr-2 | 3 | 379.08 |
| tr-2 | 4 | 466.34 |
| tr-3 | 1 | 353.43 |
| tr-3 | 2 | 430.22 |
| tr-3 | 3 | 389.47 |
| tr-3 | 4 | 395.17 |
| tr-4 | 1 | 432.32 |
| tr-4 | 2 | 451.5 |
| tr-4 | 3 | 449.89 |
| tr-4 | 4 | 422.23 |
| tr-5 | 1 | 461.81 |
| tr-5 | 2 | 460.31 |
| tr-5 | 3 | 450.64 |
| tr-5 | 4 | 452.64 |
| tr-6 | 1 | 343.64 |
| tr-6 | 2 | 360.03 |
| tr-6 | 3 | 424.08 |
| tr-6 | 4 | 389.52 |
| tr-7 | 1 | 353.85 |
| tr-7 | 2 | 505.1 |
| tr-7 | 3 | 347.18 |
| tr-7 | 4 | 409.39 |
| tr-8 | 1 | 376.46 |
| tr-8 | 2 | 383.6 |
| tr-8 | 3 | 368.52 |
| tr-8 | 4 | 379.59 |
| tr-9 | 1 | 397.32 |
| tr-9 | 2 | 382.49 |
| tr-9 | 3 | 372.34 |
| tr-9 | 4 | 395.65 |
| tr-10 | 1 | 402.68 |
| tr-10 | 2 | 388.91 |
| tr-10 | 3 | 377.91 |
| tr-10 | 4 | 391.31 |
| tr-11 | 1 | 370.65 |
| tr-11 | 2 | 381.84 |
| tr-11 | 3 | 378.9 |
| tr-11 | 4 | 390.16 |
| tr-12 | 1 | 387.94 |
| tr-12 | 2 | 401.63 |
| tr-12 | 3 | 398.43 |
| tr-12 | 4 | 393.95 |
| tr-13 | 1 | 405.28 |
| tr-13 | 2 | 388.02 |
| tr-13 | 3 | 375.33 |
| tr-13 | 4 | 421.38 |
| tr-14 | 1 | 389.74 |
| tr-14 | 2 | 394.8 |
| tr-14 | 3 | 379.14 |
| tr-14 | 4 | 370.75 |
| tr-15 | 1 | 383.01 |
| tr-15 | 2 | 378.22 |
| tr-15 | 3 | 392.4 |
| tr-15 | 4 | 391.19 |
| tr-16 | 1 | 306.69 |
| tr-16 | 2 | 386.29 |
| tr-16 | 3 | 249.55 |
| tr-16 | 4 | 243.92 |
| tr-17 | 1 | 256.87 |
| tr-17 | 2 | 312.19 |
| tr-17 | 3 | 378.55 |
| tr-17 | 4 | 467 |
| tr-18 | 1 | 356.05 |
| tr-18 | 2 | 443.09 |
| tr-18 | 3 | 391.43 |
| tr-18 | 4 | 386.47 |
| tr-19 | 1 | 421.96 |
| tr-19 | 2 | 453.42 |
| tr-19 | 3 | 461.09 |
| tr-19 | 4 | 423.83 |
| tr-20 | 1 | 463.66 |
| tr-20 | 2 | 462.27 |
| tr-20 | 3 | 451.75 |
| tr-20 | 4 | 456.44 |
| tr-21 | 1 | 348.77 |
| tr-21 | 2 | 362.53 |
| tr-21 | 3 | 429.85 |
| tr-21 | 4 | 391.1 |
| tr-22 | 1 | 354.74 |
| tr-22 | 2 | 519.12 |
| tr-22 | 3 | 349.15 |
| tr-22 | 4 | 420.63 |
| tr-23 | 1 | 378.47 |
| tr-23 | 2 | 385.42 |
| tr-23 | 3 | 371.61 |
| tr-23 | 4 | 371.75 |
| tr-24 | 1 | 389.87 |
| tr-24 | 2 | 392.98 |
| tr-24 | 3 | 371.85 |
| tr-24 | 4 | 394.08 |
| tr-25 | 1 | 420.47 |
| tr-25 | 2 | 390.08 |
| tr-25 | 3 | 378.94 |
| tr-25 | 4 | 380.15 |
| tr-26 | 1 | 372.57 |
| tr-26 | 2 | 384.68 |
| tr-26 | 3 | 383.08 |
| tr-26 | 4 | 397.54 |
| tr-27 | 1 | 385.02 |
| tr-27 | 2 | 389.89 |
| tr-27 | 3 | 399.57 |
| tr-27 | 4 | 398.8 |
| tr-28 | 1 | 410.15 |
| tr-28 | 2 | 387.02 |
| tr-28 | 3 | 378.37 |
| tr-28 | 4 | 423.13 |
| tr-29 | 1 | 390.52 |
| tr-29 | 2 | 399.14 |
| tr-29 | 3 | 380.5 |
| tr-29 | 4 | 382.63 |
| tr-30 | 1 | 388.67 |
| tr-30 | 2 | 388.44 |
| tr-30 | 3 | 392.69 |
| tr-30 | 4 | 393.38 |
| tr-31 | 1 | 325.99 |
| tr-31 | 2 | 381.41 |
| tr-31 | 3 | 273.55 |
| tr-31 | 4 | 248.53 |
| tr-32 | 1 | 253.63 |
| tr-32 | 2 | 314.45 |
| tr-32 | 3 | 379.23 |
| tr-32 | 4 | 467.72 |
| tr-33 | 1 | 375.61 |
| tr-33 | 2 | 434.47 |
| tr-33 | 3 | 380.64 |
| tr-33 | 4 | 396.86 |
| tr-34 | 1 | 434.89 |
| tr-34 | 2 | 455.26 |
| tr-34 | 3 | 438.48 |
| tr-34 | 4 | 425.06 |
| tr-35 | 1 | 462.11 |
| tr-35 | 2 | 451.76 |
| tr-35 | 3 | 470.8 |
| tr-35 | 4 | 451.99 |
| tr-36 | 1 | 345.65 |
| tr-36 | 2 | 361.05 |
| tr-36 | 3 | 426.21 |
| tr-36 | 4 | 390.07 |
| tr-37 | 1 | 354.8 |
| tr-37 | 2 | 496.63 |
| tr-37 | 3 | 348.22 |
| tr-37 | 4 | 410.72 |
| tr-38 | 1 | 387.07 |
| tr-38 | 2 | 365.21 |
| tr-38 | 3 | 372.14 |
| tr-38 | 4 | 384.97 |
| tr-39 | 1 | 410.36 |
| tr-39 | 2 | 386.29 |
| tr-39 | 3 | 376.62 |
| tr-39 | 4 | 398.01 |
| tr-40 | 1 | 384.49 |
| tr-40 | 2 | 369.99 |
| tr-40 | 3 | 384.72 |
| tr-40 | 4 | 375.07 |
| tr-41 | 1 | 383.9 |
| tr-41 | 2 | 393.21 |
| tr-41 | 3 | 371.61 |
| tr-41 | 4 | 391.21 |
| tr-42 | 1 | 388.59 |
| tr-42 | 2 | 401.63 |
| tr-42 | 3 | 400.36 |
| tr-42 | 4 | 388.48 |
| tr-43 | 1 | 405.39 |
| tr-43 | 2 | 389.75 |
| tr-43 | 3 | 376.22 |
| tr-43 | 4 | 419.04 |
| tr-44 | 1 | 391.31 |
| tr-44 | 2 | 389.96 |
| tr-44 | 3 | 389.71 |
| tr-44 | 4 | 372.49 |
| tr-45 | 1 | 387.07 |
| tr-45 | 2 | 380.8 |
| tr-45 | 3 | 392.53 |
| tr-45 | 4 | 380.93 |
We will upload the data to the system.
The Scott-Knott analysis will be performed with the settings shown in the figure below.
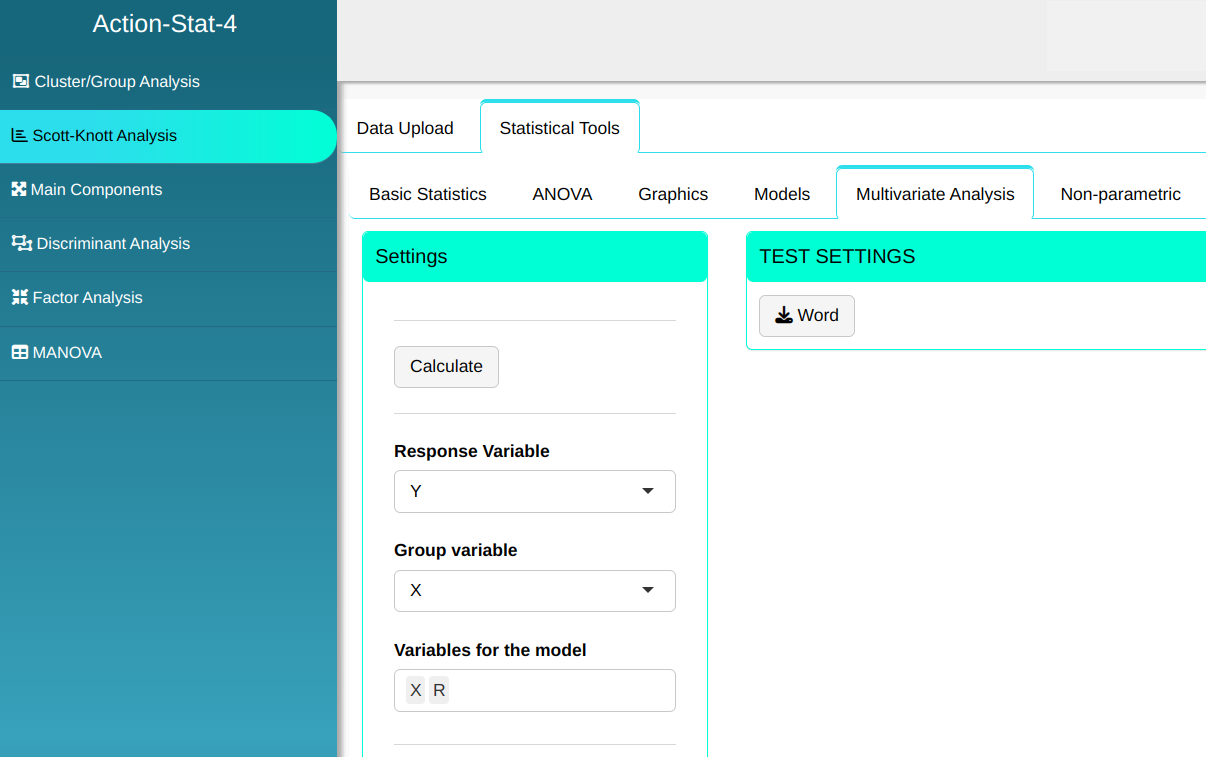
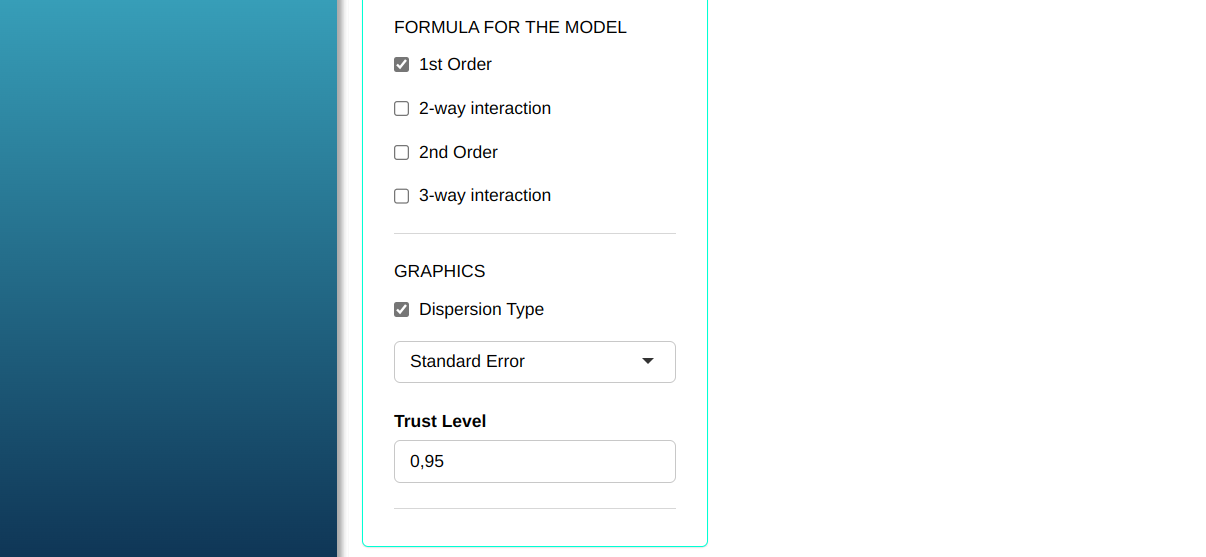
Then click Calculate to get the results. You can also generate the analyses and download them in Word format.
The results are:
Agrupamento (Algoritmo de Scott-Knott)
| Groups | Mean | Scott-Knott | Mean + Standard Error | Mean - Standard Error |
|---|---|---|---|---|
| tr-35 | 459.165 | a | 454.597 | 463.733 |
| tr-20 | 458.530 | a | 455.782 | 461.278 |
| tr-5 | 456.350 | a | 453.583 | 459.117 |
| tr-19 | 440.075 | a | 430.026 | 450.124 |
| tr-4 | 438.985 | a | 431.910 | 446.060 |
| tr-34 | 438.423 | a | 432.134 | 444.711 |
| tr-22 | 410.910 | b | 371.357 | 450.463 |
| tr-7 | 403.880 | b | 367.372 | 440.388 |
| tr-37 | 402.593 | b | 368.254 | 436.931 |
| tr-28 | 399.668 | b | 389.364 | 409.971 |
| tr-43 | 397.600 | b | 388.295 | 406.905 |
| tr-13 | 397.502 | b | 387.452 | 407.553 |
| tr-33 | 396.895 | b | 383.575 | 410.215 |
| tr-12 | 395.488 | b | 392.519 | 398.456 |
| tr-42 | 394.765 | b | 391.159 | 398.371 |
| tr-18 | 394.260 | b | 376.202 | 412.318 |
| tr-27 | 393.320 | b | 389.787 | 396.853 |
| tr-39 | 392.820 | b | 385.519 | 400.121 |
| tr-25 | 392.410 | b | 382.730 | 402.090 |
| tr-3 | 392.072 | b | 376.354 | 407.791 |
| tr-30 | 390.795 | b | 389.493 | 392.097 |
| tr-10 | 390.202 | b | 385.122 | 395.283 |
| tr-29 | 388.197 | b | 383.961 | 392.434 |
| tr-24 | 387.195 | b | 382.003 | 392.387 |
| tr-9 | 386.950 | b | 381.058 | 392.842 |
| tr-15 | 386.205 | b | 382.824 | 389.586 |
| tr-44 | 385.868 | b | 381.395 | 390.340 |
| tr-45 | 385.332 | b | 382.523 | 388.142 |
| tr-41 | 384.982 | b | 380.097 | 389.868 |
| tr-26 | 384.467 | b | 379.349 | 389.586 |
| tr-14 | 383.608 | b | 378.221 | 388.994 |
| tr-21 | 383.062 | b | 365.148 | 400.977 |
| tr-36 | 380.745 | b | 363.012 | 398.478 |
| tr-11 | 380.387 | b | 376.360 | 384.415 |
| tr-6 | 379.317 | b | 361.634 | 397.001 |
| tr-40 | 378.567 | b | 374.930 | 382.205 |
| tr-38 | 377.347 | b | 372.127 | 382.568 |
| tr-8 | 377.043 | b | 373.848 | 380.237 |
| tr-23 | 376.812 | b | 373.527 | 380.098 |
| tr-32 | 353.757 | c | 307.925 | 399.590 |
| tr-17 | 353.653 | c | 308.418 | 398.887 |
| tr-2 | 349.350 | c | 301.500 | 397.200 |
| tr-31 | 307.370 | d | 277.882 | 336.858 |
| tr-16 | 296.613 | d | 263.528 | 329.697 |
| tr-1 | 294.680 | d | 260.672 | 328.688 |
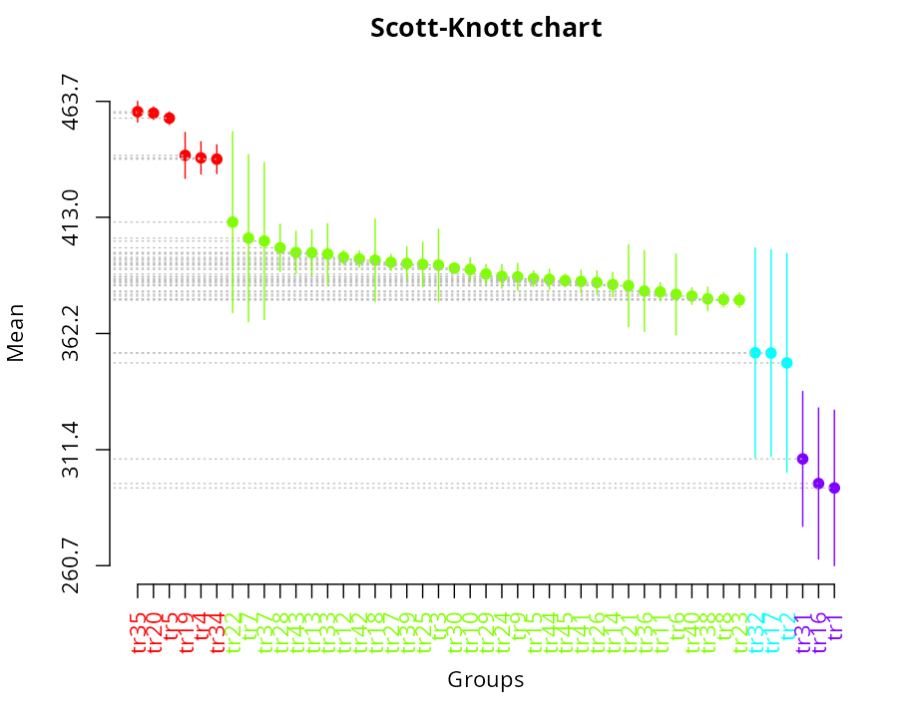
According to the Scott-Knott analysis at the 95% confidence level, all 45 treatments can be divided into 4 distinct groups, as shown in the Scott-Knott graph in the figure above.
Example 3:
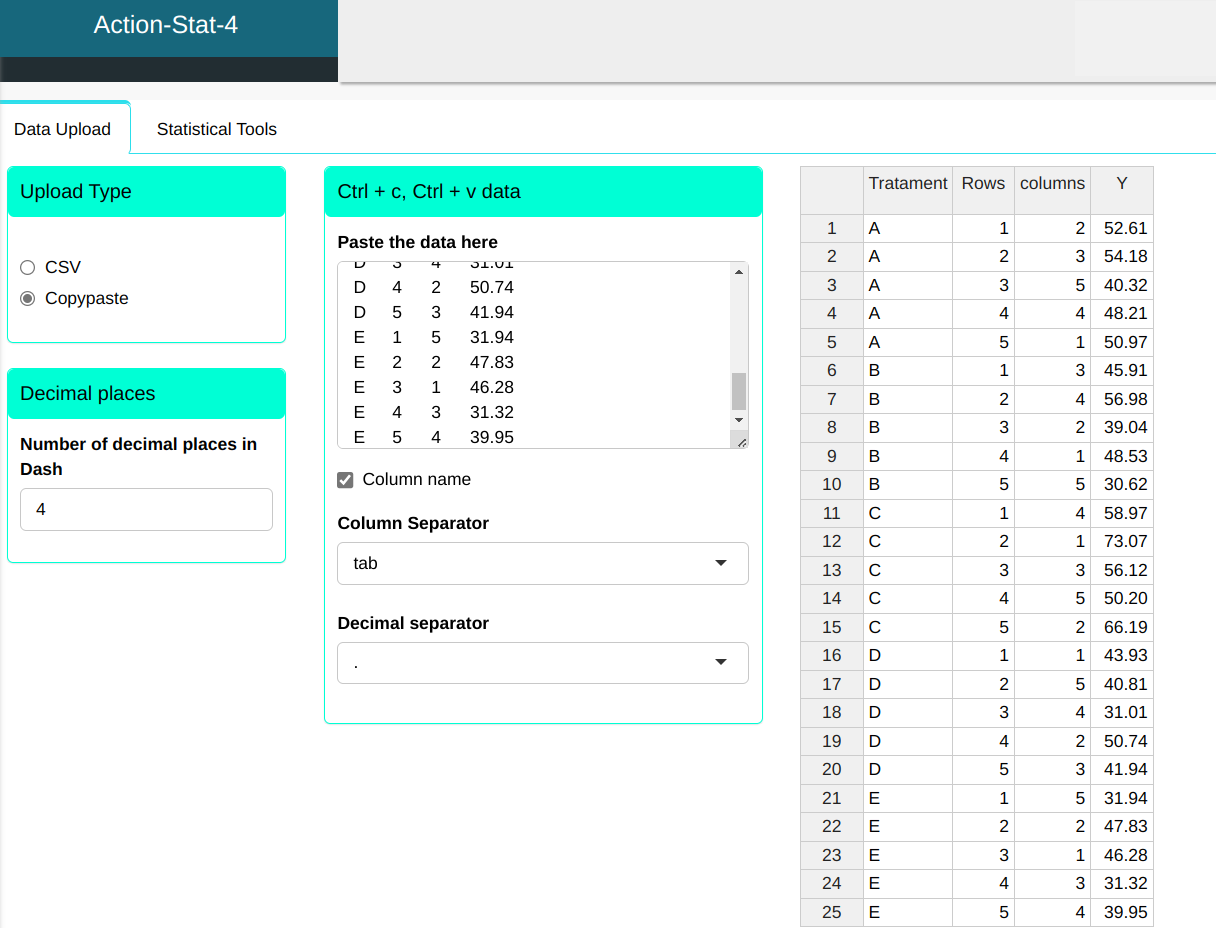
The data in the table has five types of treatments (A, B, C, D and E). Let’s apply the Scott-Knott method to group these treatments.
| Tratament | Rows | Columns | Y |
|---|---|---|---|
| A | 1 | 2 | 52.61 |
| A | 2 | 3 | 54.18 |
| A | 3 | 5 | 40.32 |
| A | 4 | 4 | 46.21 |
| A | 5 | 1 | 50.97 |
| B | 1 | 3 | 45.91 |
| B | 2 | 4 | 56.98 |
| B | 3 | 2 | 39.04 |
| B | 4 | 1 | 48.53 |
| B | 5 | 5 | 30.62 |
| C | 1 | 4 | 58.97 |
| C | 2 | 1 | 73.07 |
| C | 3 | 3 | 56.12 |
| C | 4 | 5 | 50.2 |
| C | 5 | 2 | 66.19 |
| D | 1 | 1 | 43.93 |
| D | 2 | 5 | 40.81 |
| D | 3 | 4 | 31.01 |
| D | 4 | 2 | 50.74 |
| D | 5 | 3 | 41.94 |
| E | 1 | 5 | 31.94 |
| E | 2 | 2 | 47.83 |
| E | 3 | 1 | 46.26 |
| E | 4 | 3 | 31.32v |
| E | 5 | 4 | 38.95 |
We will upload the data to the system.
The Scott-Knott analysis will be performed with the settings shown in the figure below.
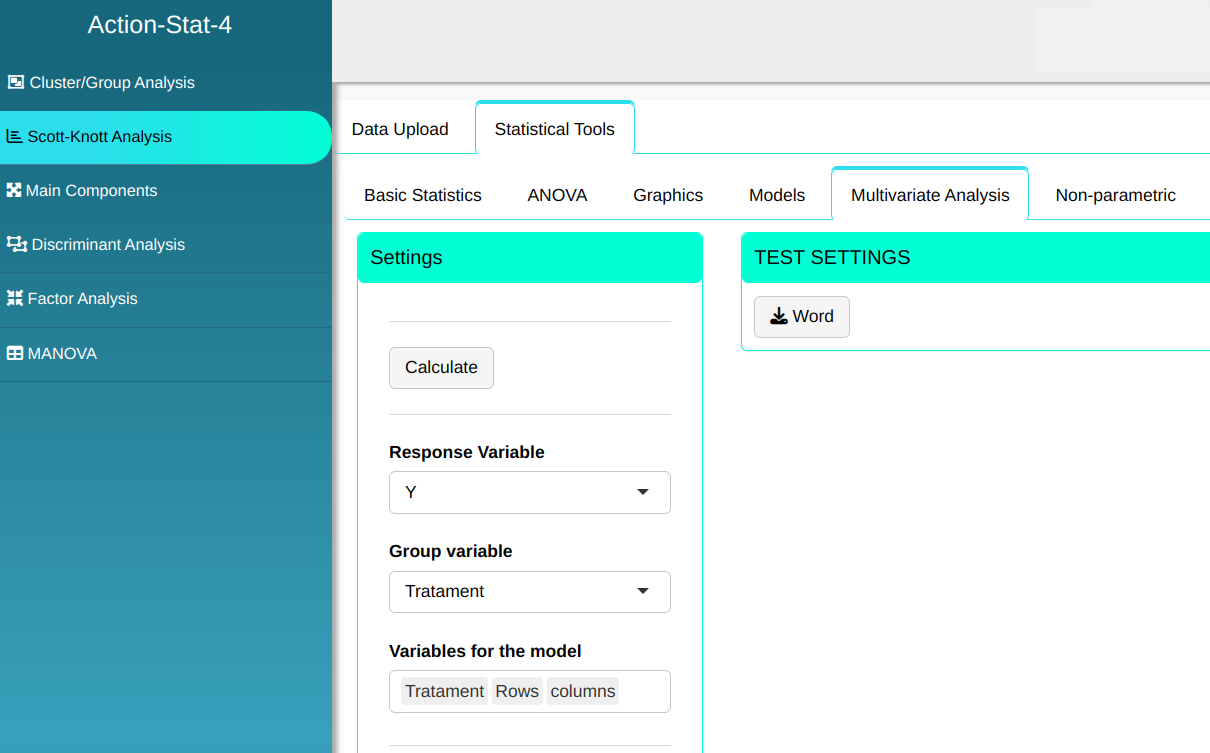
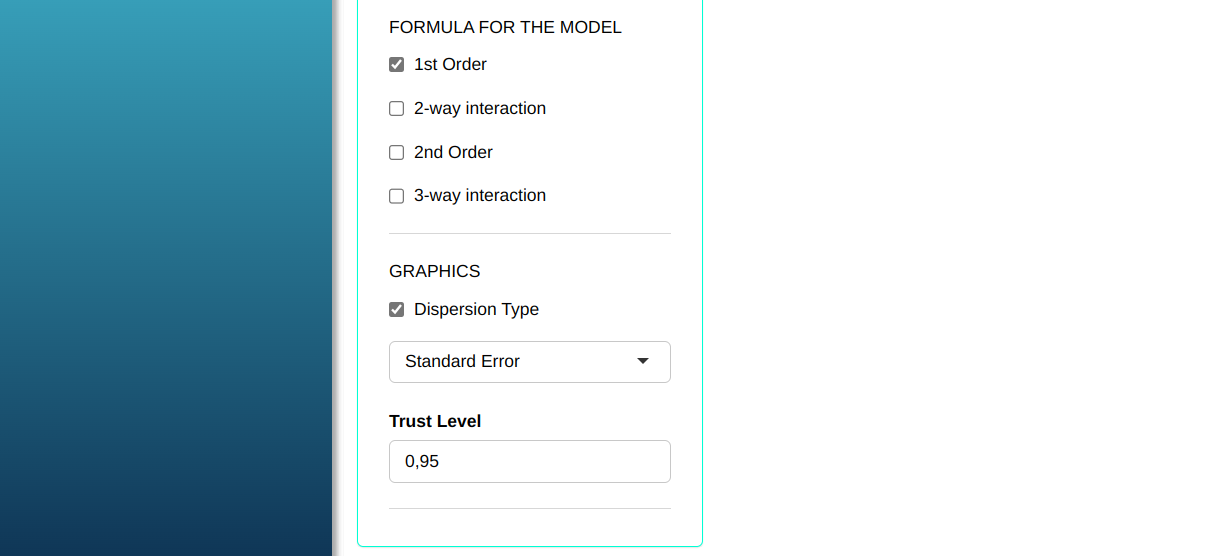
Then click Calculate to get the results. You can also generate the analyses and download them in Word format.
The results are:
Scott-Knott Clustering Algorithm
| Groups | Mean | Scott-Knott | Meam + Standard Error | Mean - Standard Error |
|---|---|---|---|---|
| C | 60.910 | a | 52.006 | 69.814 |
| A | 48.858 | b | 43.2284 | 54.4876 |
| B | 44.216 | b | 34.266 | 54.166 |
| D | 41.686 | b | 34.583 | 48.789 |
| E | 39.26 | b | 31.5275 | 46.992 |
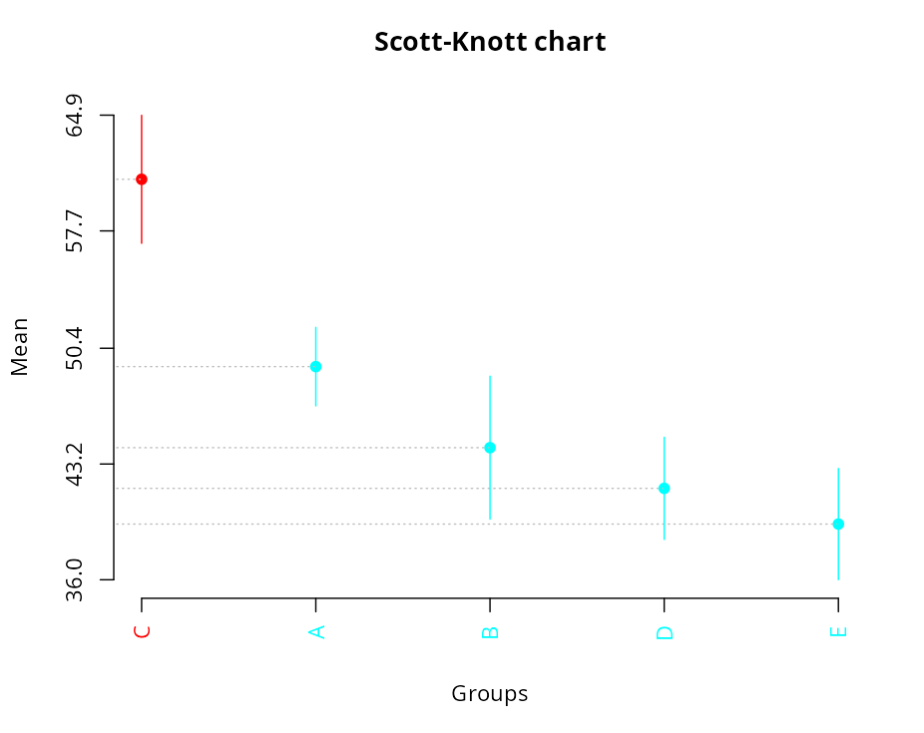
From the Scott-Knott analysis, it can be seen that the five treatments can be grouped into just two groups. One group containing only treatment C and the other containing treatments A,B,D and E.
The confidence level can directly change the results of the analysis, redo the above procedure by changing the confidence level to 75% (0.75) to see the difference.