3. Multiple Comparison Tests: Dunnett
The Dunnett strategy is used to compare all levels to one level reference.
Example:
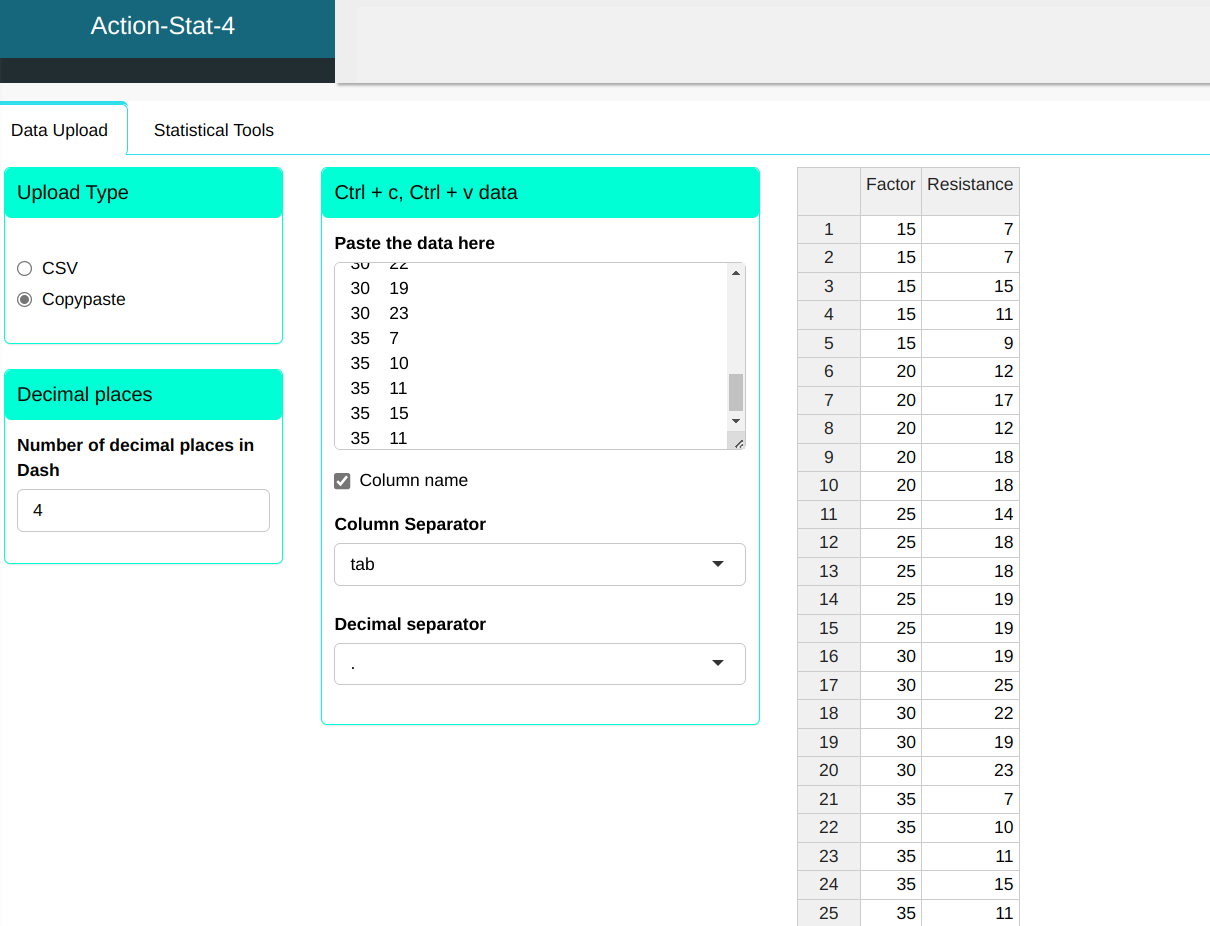
Consider the production process of a synthetic fiber, in which the experimenter wants to know the influence of the percentage of cotton on fiber strength. For this, an experiment was carried out completely randomized, in which different levels of cotton percentage were evaluated with respect to fiber resistance. An important point in planning of the experiment is that for each factor level (percentage cotton), the other factors that influence the process (such as the environment environment, machine, raw material, etc.) must present a standard homogeneous of variability. In the experiment, we took 5 levels for the percentage of cotton and 5 replications.
| Factor | Resistance |
|---|---|
| 15 | 7 |
| 15 | 7 |
| 15 | 15 |
| 15 | 11 |
| 15 | 9 |
| 20 | 12 |
| 20 | 17 |
| 20 | 12 |
| 20 | 18 |
| 20 | 18 |
| 25 | 14 |
| 25 | 18 |
| 25 | 18 |
| 25 | 19 |
| 25 | 19 |
| 30 | 19 |
| 30 | 25 |
| 30 | 22 |
| 30 | 19 |
| 30 | 23 |
| 35 | 7 |
| 35 | 10 |
| 35 | 11 |
| 35 | 15 |
| 35 | 11 |
To perform a Dunnett test, the following configuration is designed, as shown in the figure below.
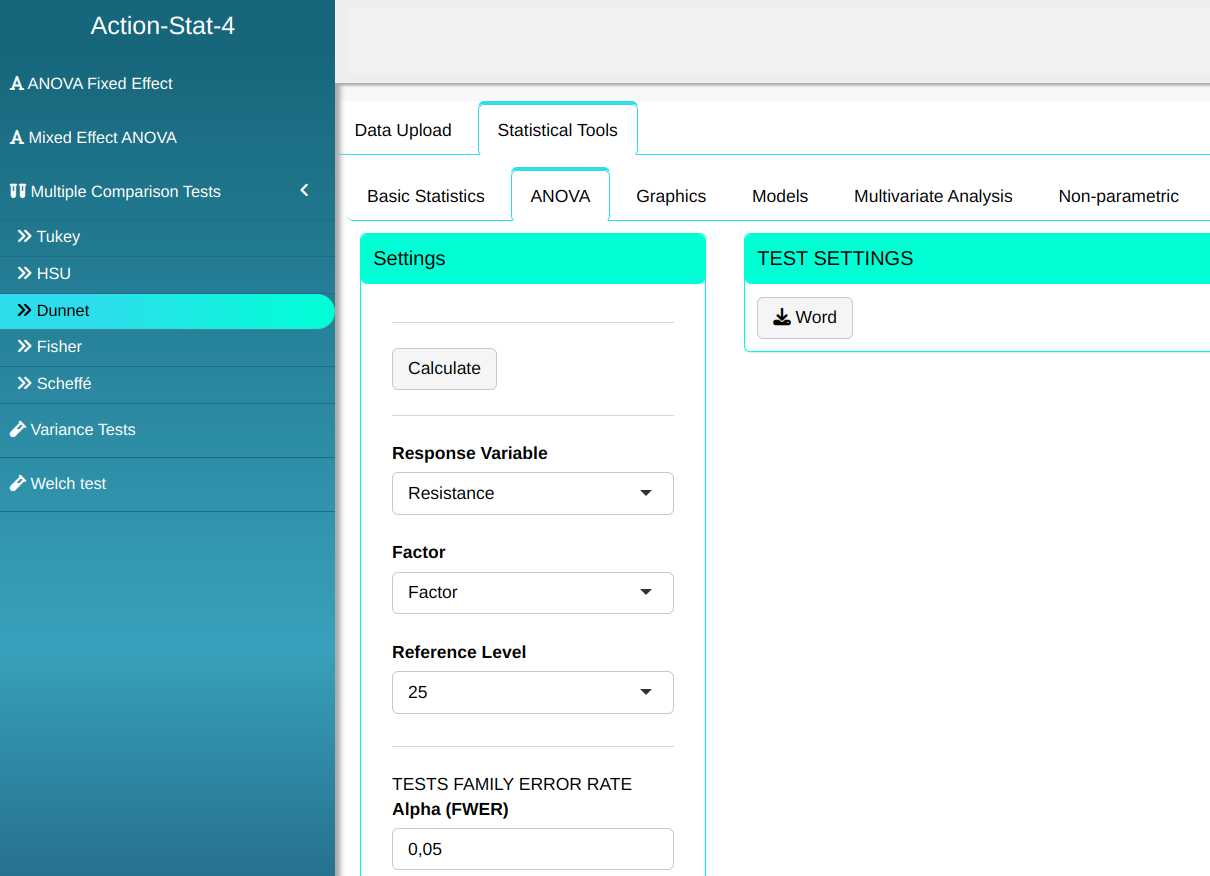

Then click Calculate to get the results. You can also generate the analyses and download them in Word format.

The results are:
Dunnett test
| Mean | Lower Limit | Upper Limit | P-Value | |
|---|---|---|---|---|
| 15 - 25 | -7.8 | -12.561 | -3,039 | 0.001 |
| 20 - 25 | -2.2 | -6.961 | 2.561 | 0.563 |
| 30 - 25 | 4.0 | -0.761 | 8.761 | 0.116 |
| 35 - 25 | -6.8 | -11.561 | -2.039 | 0.004 |
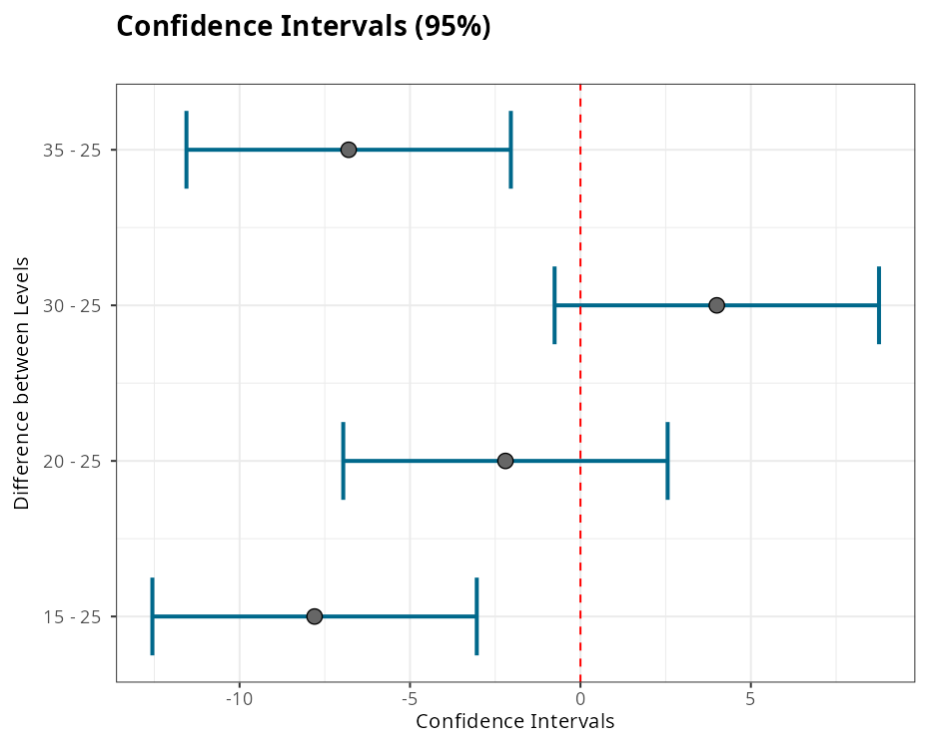
The interpretation of the Dunnett test is similar to that of the Tukey test, that is, equality between levels will be rejected if the P-value is greater than the alpha or if the confidence interval does not contain the value "zero". Thus, in the example, we reject the hypothesis of equality between the levels 15 and 25 and between levels 35 and 25. For other comparisons, no significant difference was detected.