4. Multiple comparison tests: Fisher
Fisher’s strategy is used to perform all pairwise comparisons. between levels of a factor.
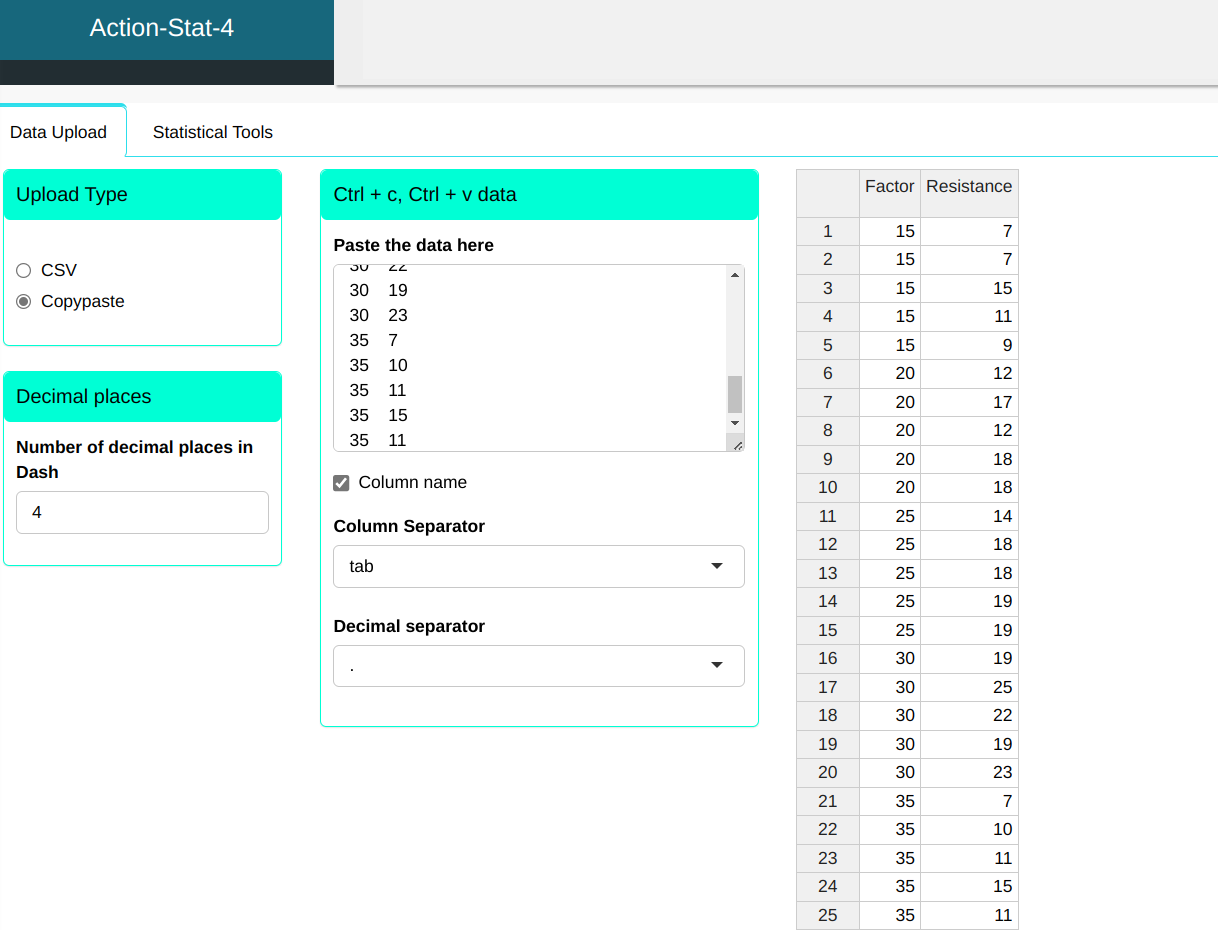
Example 1:
Let us consider the production process of a synthetic fiber, in which the The experimenter wants to know the influence of the percentage of cotton on fiber resistance. For this, an experiment was carried out completely random, in which different levels of cotton percentage were evaluated. evaluated with respect to fiber strength. An important point in The planning of the experiment is that for each factor level (percentage cotton), the other factors that influence the process (such as the environment environment, machine, raw material, etc.) must present a standard homogeneous of variability. In the experiment, we take 5 levels for the cotton percentage and 5 repetitions.
| Factor | Resistance |
|---|---|
| 15 | 7 |
| 15 | 7 |
| 15 | 15 |
| 15 | 11 |
| 15 | 9 |
| 20 | 12 |
| 20 | 17 |
| 20 | 12 |
| 20 | 18 |
| 20 | 18 |
| 25 | 14 |
| 25 | 18 |
| 25 | 18 |
| 25 | 19 |
| 25 | 19 |
| 30 | 19 |
| 30 | 25 |
| 30 | 22 |
| 30 | 19 |
| 30 | 23 |
| 35 | 7 |
| 35 | 10 |
| 35 | 11 |
| 35 | 15 |
| 35 | 11 |

We will do the Fisher test.
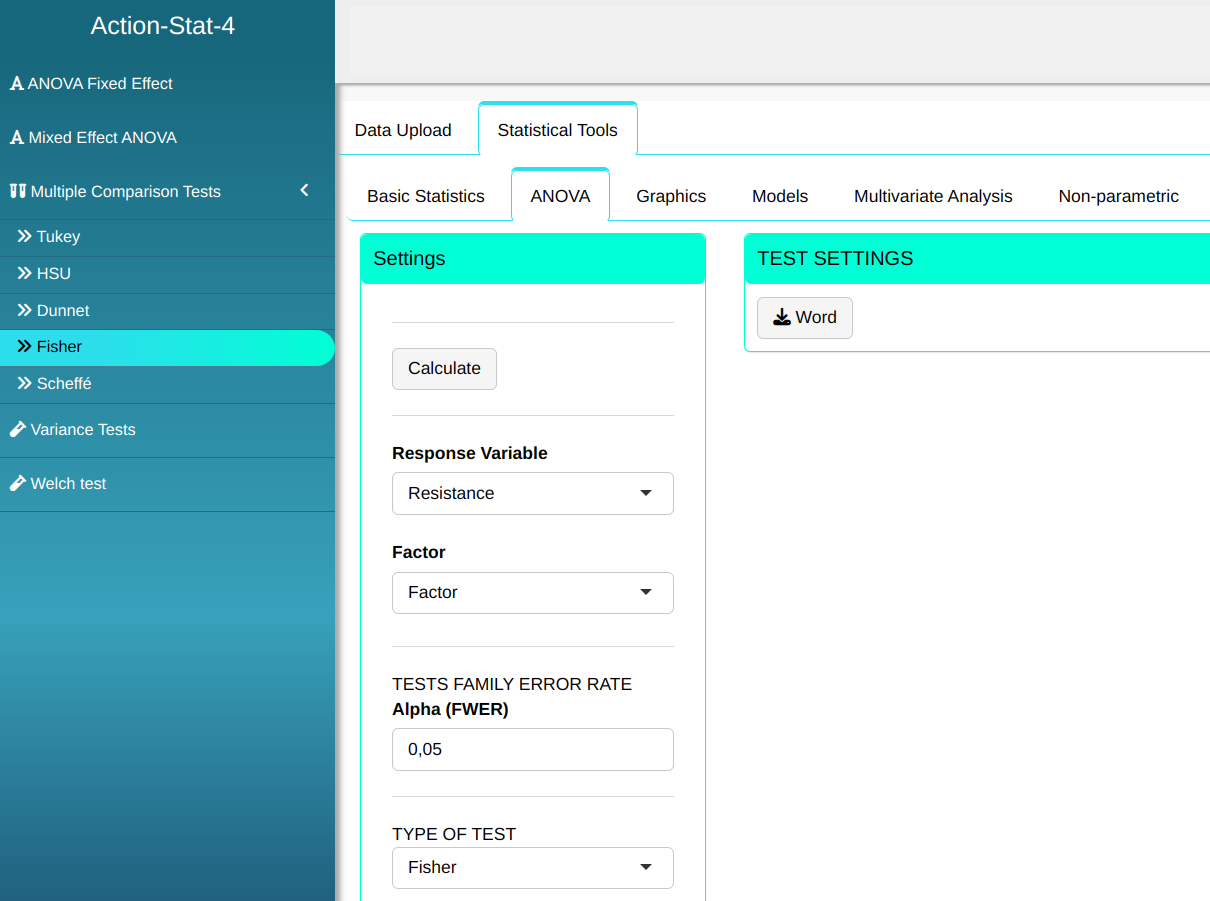

Then click Calculate to get the results. You can also generate the analyses and download them in Word format.

The results are:
Analysis result
| Factor | Center | Lower limit | Upper limit | p value |
|---|---|---|---|---|
| 15-20 | -5.6 | -9.345 | -1.855 | 0.005 |
| 15-25 | -7.8 | -11.545 | -4.055 | 0.000 |
| 15-30 | -11.8 | -15.545 | -8.055 | 0.000 |
| 15-35 | -1.0 | -4.745 | 2.745 | 0.584 |
| 20-25 | -2.2 | -5.945 | 1.545 | 0.235 |
| 20-30 | -6.2 | -9.945 | -2.455 | 0.002 |
| 20-35 | 4.6 | 0.855 | 8.345 | 0.019 |
| 25-30 | -4.0 | -7.745 | -0.255 | 0.038 |
| 25-35 | 6.8 | 3.055 | 10.545 | 0.001 |
| 30-35 | 10.8 | 7.055 | 14.545 | 0.000 |
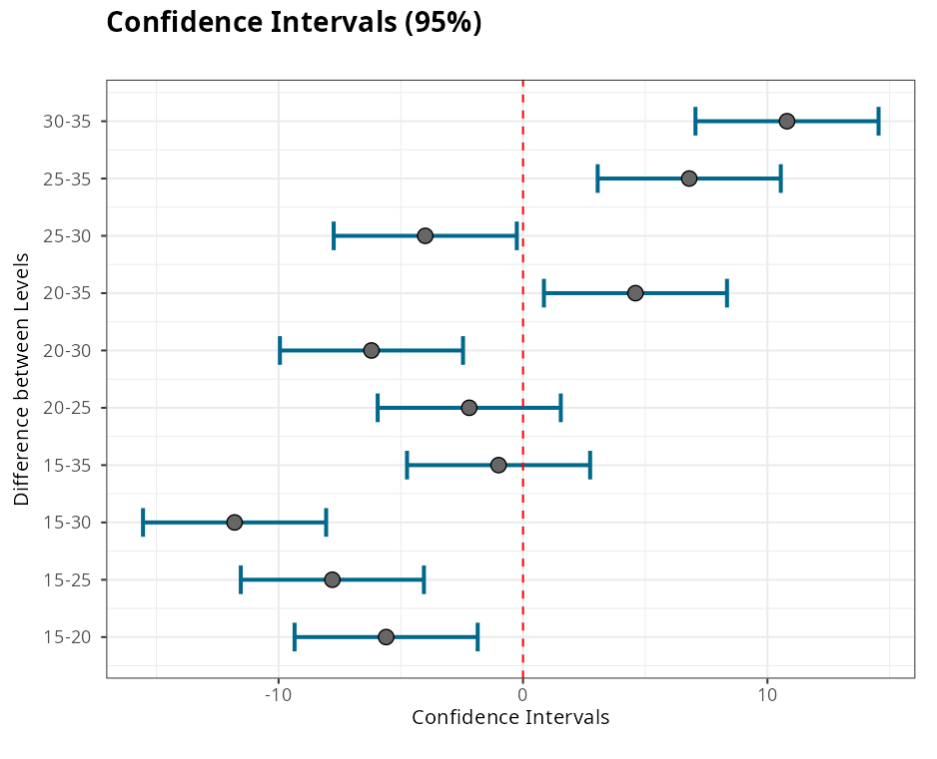
Like the previous tests, we reject the equality between the means of levels if the P value is less than alpha or if the confidence interval is not contain the value "zero" . Therefore, in the example, we reject the hypothesis. of equality between levels for all comparisons, except between levels 15 and 35, 20 and 25.
Example 2:
With the same data as Example 1, we will now apply the Fisher-Bonferroni Test.
| Factor | Resistance |
|---|---|
| 15 | 7 |
| 15 | 7 |
| 15 | 15 |
| 15 | 11 |
| 15 | 9 |
| 20 | 12 |
| 20 | 17 |
| 20 | 12 |
| 20 | 18 |
| 20 | 18 |
| 25 | 14 |
| 25 | 18 |
| 25 | 18 |
| 25 | 19 |
| 25 | 19 |
| 30 | 19 |
| 30 | 25 |
| 30 | 22 |
| 30 | 19 |
| 30 | 23 |
| 35 | 7 |
| 35 | 10 |
| 35 | 11 |
| 35 | 15 |
| 35 | 11 |
We will do the Fisher test.
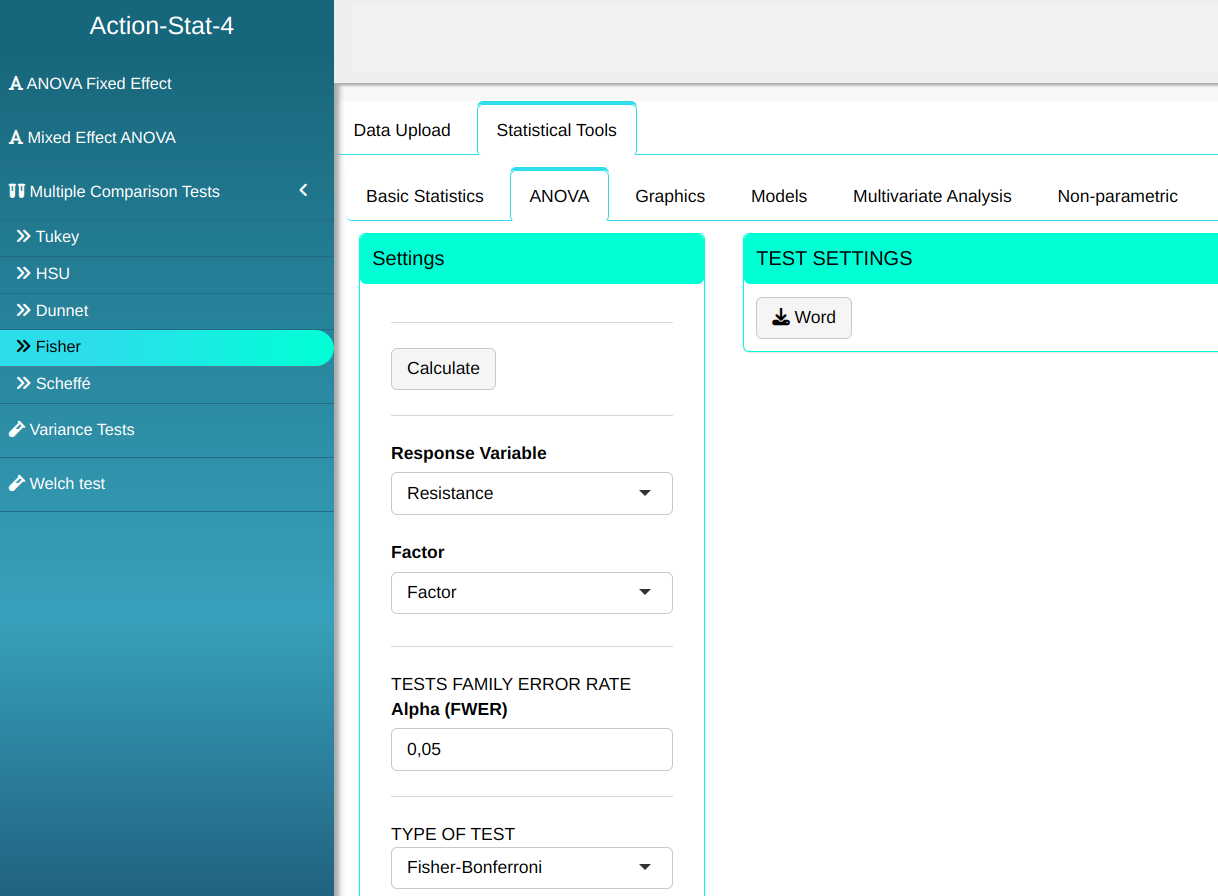

Then click Calculate to get the results. You can also generate the analyses and download them in Word format.
The results are:
Analysis result
| Factor | Center | Lower limit | Upper limit | P-Value |
|---|---|---|---|---|
| 20-15 | 5.6 | -0.062 | 11,262 | 0.054 |
| 25-15 | 7.8 | 2,138 | 13,462 | 0.003 |
| 30-15 | 11.8 | 6,138 | 17,462 | 0.000 |
| 35-15 | 1.0 | -4,662 | 6,662 | 1,000 |
| 25-20 | 2.2 | -3,462 | 7,862 | 1,000 |
| 30-20 | 6.2 | 0.538 | 11,862 | 0.025 |
| 20-35 | 4.6 | -1,062 | 10,262 | 0.186 |
| 30-25 | 4.0 | -1,662 | 9,662 | 0.375 |
| 25-35 | 6.8 | 1,138 | 12,462 | 0.012 |
| 30-35 | 10.8 | 5,138 | 16,462 | 0.000 |
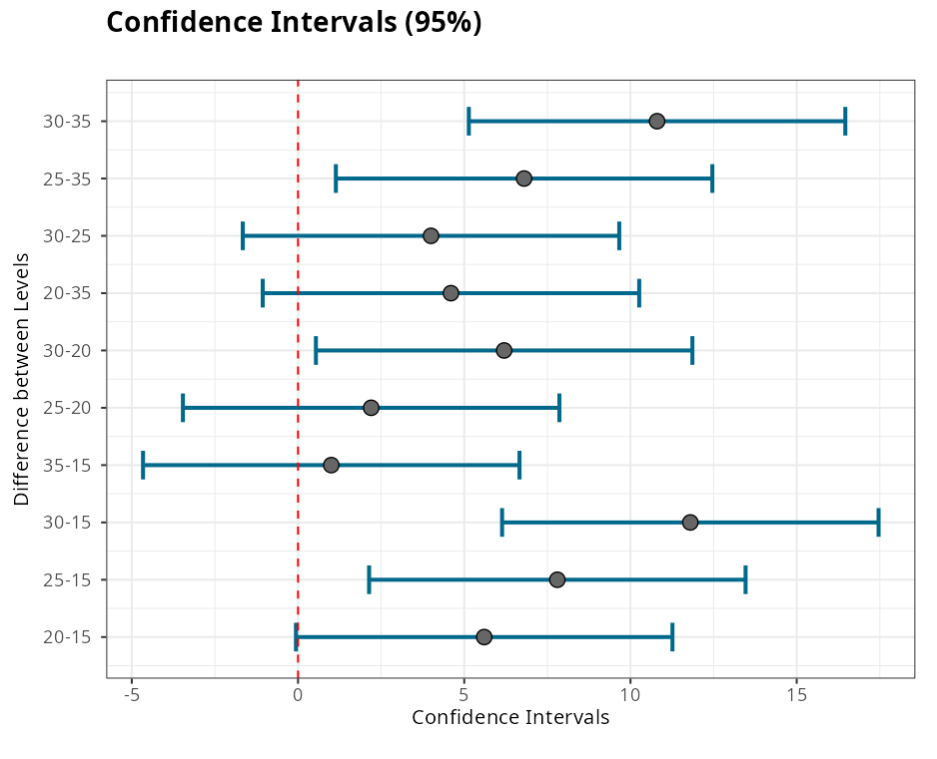
When considering a 5% significance level, we do not reject the hypothesis of equality between level means: 20-15, 35-15- 25-20, 20-35 and 30-25.