2. Multiple Comparison Tests: HSU
The HSU strategy is used to detect the level that has the highest response or the level that presents the lowest response.
Example:
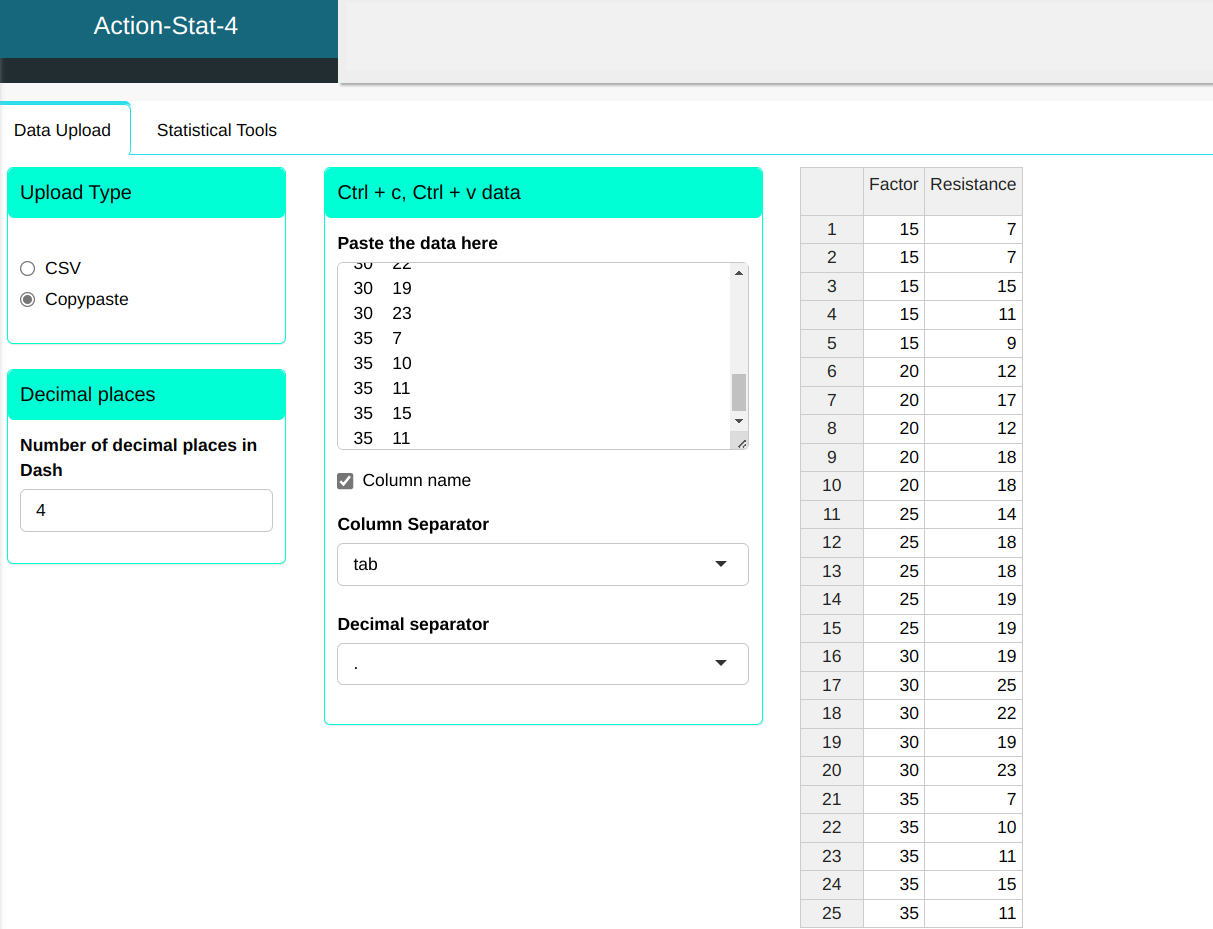
Consider the production process of a synthetic fiber, in which the experimenter wants to know the influence of the percentage of cotton on fiber strength. For this, an experiment was carried out completely randomized, in which different levels of cotton percentage were evaluated with respect to fiber resistance. An important point in planning of the experiment is that for each factor level (percentage cotton), the other factors that influence the process (such as the environment environment, machine, raw material, etc.) must present a standard homogeneous of variability. In the experiment, we took 5 levels for the percentage of cotton and 5 replications.
| Factor | Resistance |
|---|---|
| 15 | 7 |
| 15 | 7 |
| 15 | 15 |
| 15 | 11 |
| 15 | 9 |
| 20 | 12 |
| 20 | 17 |
| 20 | 12 |
| 20 | 18 |
| 20 | 18 |
| 25 | 14 |
| 25 | 18 |
| 25 | 18 |
| 25 | 19 |
| 25 | 19 |
| 30 | 19 |
| 30 | 25 |
| 30 | 22 |
| 30 | 19 |
| 30 | 23 |
| 35 | 7 |
| 35 | 10 |
| 35 | 11 |
| 35 | 15 |
| 35 | 11 |
We will take the HSU test.
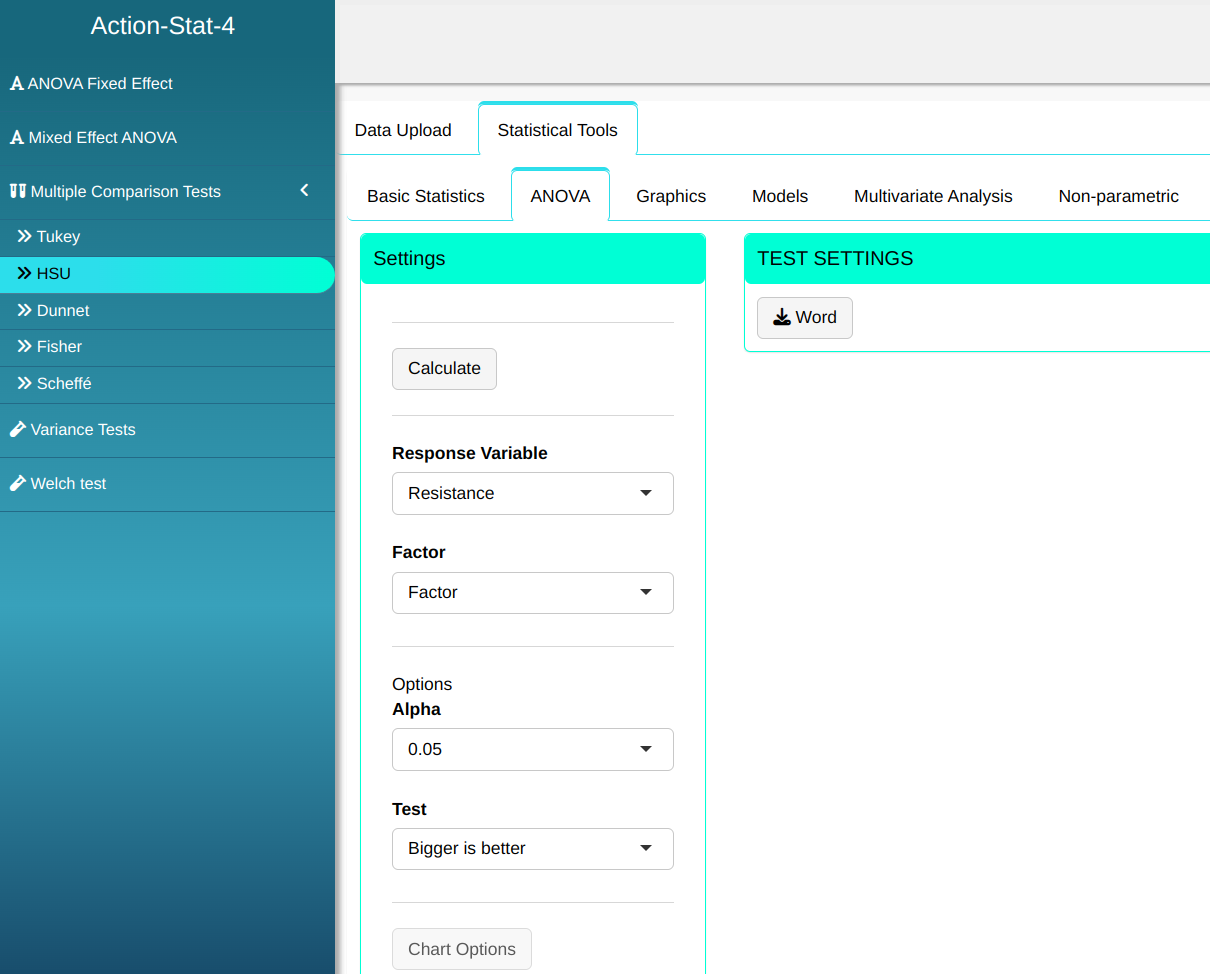
Clicking on Calculate we obtain the results.

The results are:
TEST: Bigger is better
| Level | Mean | Lower Limit | Upper Limit |
|---|---|---|---|
| 15 | -11.8 | -15.939 | 0.000 |
| 20 | -6.2 | -10.339 | 0.000 |
| 25 | -4.0 | -8.139 | 0.139 |
| 30 | 4.0 | -0.139 | 8.139 |
| 35 | -10.8 | -14.939 | 0.000 |
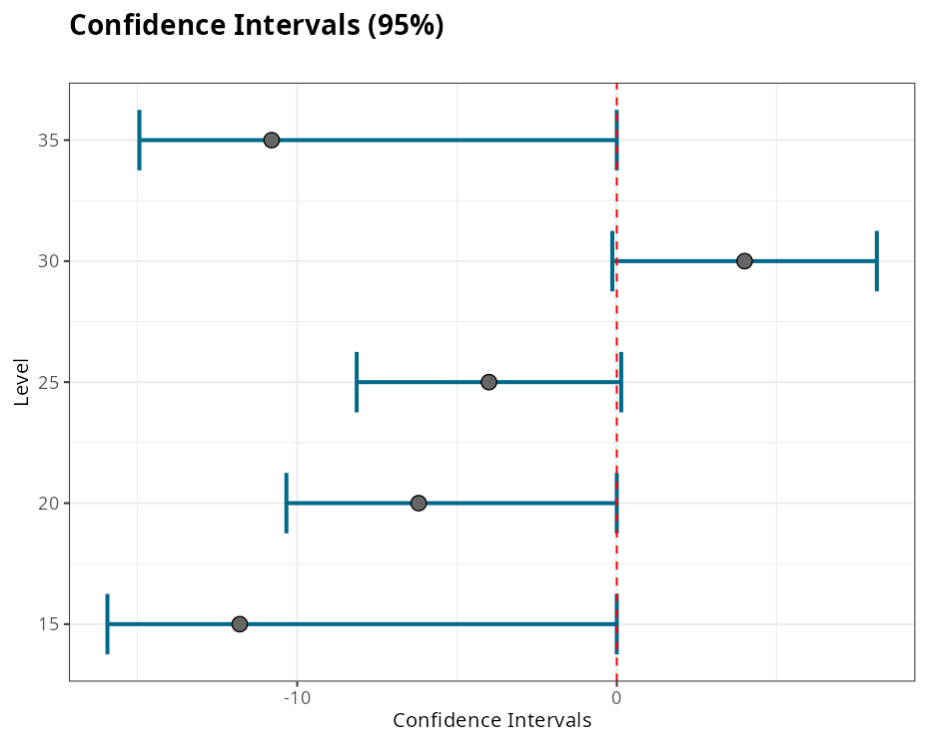
In the HSU test we want most of the range to be positive, so level 30 is the best, when we consider the test “highest average is the best.”