1. Multiple Comparison Tests: Tukey
The Tukey test (TSD - Tukey Significant Difference) is used to test averages.
Example 1:
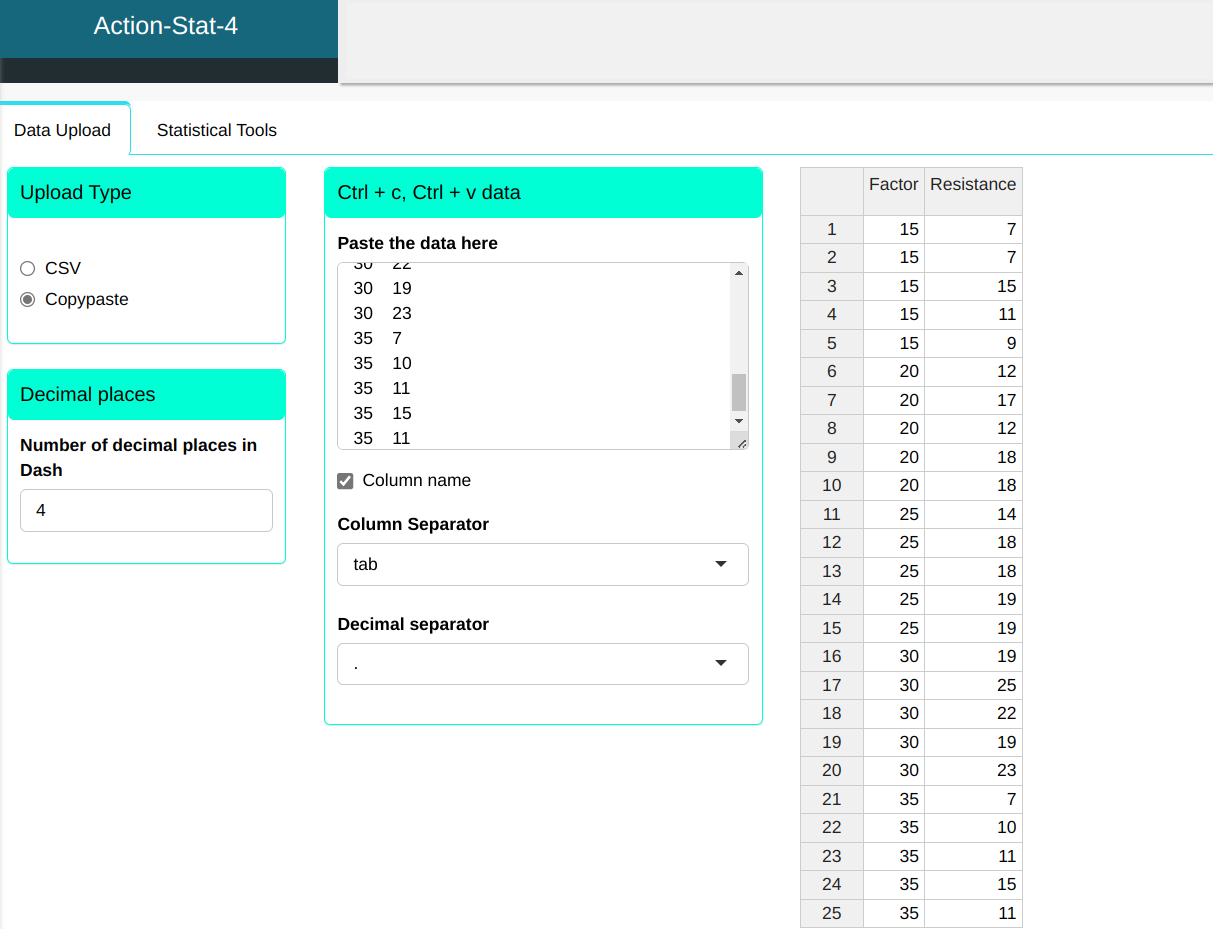
Consider the production process of a synthetic fiber, in which the experimenter wants to know the influence of the percentage of cotton on fiber strength. For this, an experiment was carried out completely randomized, in which different levels of cotton percentage were evaluated with respect to fiber resistance. An important point in planning of the experiment is that for each factor level (percentage cotton), the other factors that influence the process (such as the environment environment, machine, raw material, etc.) must present a standard homogeneous of variability. In the experiment, we took 5 levels for the percentage of cotton and 5 replications.
| Factor | Resistance |
|---|---|
| 15 | 7 |
| 15 | 7 |
| 15 | 15 |
| 15 | 11 |
| 15 | 9 |
| 20 | 12 |
| 20 | 17 |
| 20 | 12 |
| 20 | 18 |
| 20 | 18 |
| 25 | 14 |
| 25 | 18 |
| 25 | 18 |
| 25 | 19 |
| 25 | 19 |
| 30 | 19 |
| 30 | 25 |
| 30 | 22 |
| 30 | 19 |
| 30 | 23 |
| 35 | 7 |
| 35 | 10 |
| 35 | 11 |
| 35 | 15 |
| 35 | 11 |
We will perform the Tukey test.

Clicking on Calculate we get the results

The results are:
Anova Table
| G.L. | Sum of Squares | Mean Square | F.Stat. | P-Value | |
|---|---|---|---|---|---|
| Factor | 4 | 475.76 | 118.94 | 14,757 | 0 |
| Residuals | 20 | 161.20 | 8.06 |
Multiple Comparisons
| Comparisons | Center | Lower Limit | Upper Limit | P-value |
|---|---|---|---|---|
| 20-15 | 5.6 | 0.227 | 10,973 | 0.039 |
| 25-15 | 7.8 | 2.427 | 13.173 | 0.003 |
| 30-15 | 11.8 | 6.427 | 17.173 | 0.000 |
| 35-15 | 1.0 | -4.373 | 6.373 | 0.980 |
| 25-20 | 2.2 | -3.173 | 7.573 | 0.737 |
| 30-20 | 6.2 | 0.827 | 11.573 | 0.019 |
| 35-20 | -4.6 | -9.973 | 0.773 | 0.116 |
| 30-25 | 4.0 | -1.373 | 9.373 | 0.210 |
| 35-25 | -6.8 | -12.173 | -1.427 | 0.0091 |
| 35-30 | -10.8 | -16.173 | -5.427 | 0.0001 |
Clustering
| Factor | Means | Groups | |
|---|---|---|---|
| 30 | 30 | 21.6 | a |
| 25 | 25 | 17.6 | ab |
| 20 | 20 | 15.4 | bc |
| 35 | 35 | 10.8 | cd |
| 15 | 15 | 9.8 | d |
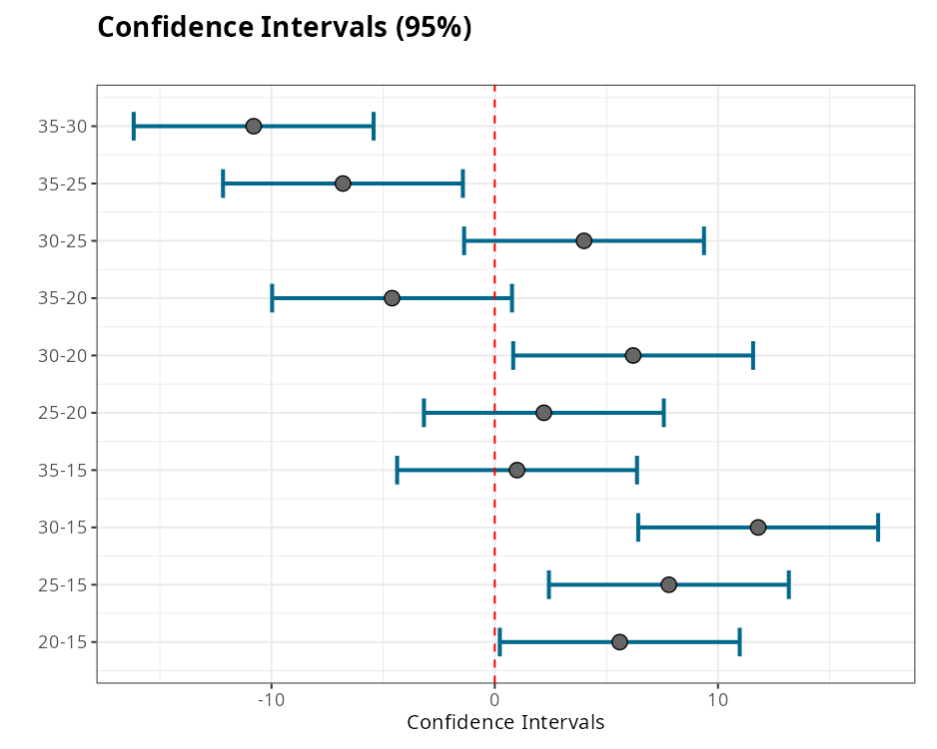
The Tukey test assesses equality between levels, so it is a test of hypotheses. In these results we see that the hypothesis of equality is rejected between levels 20-15, 25-15, 30-15, 30-20, 35-25 and 35-30, as these have a P-value less than 0.05.
Another way to assess whether or not there is equality between levels is using confidence intervals and the graph, if the value "zero" , belongs to the confidence interval we do not reject the hypothesis of equality between levels.