4. Variance tests
These tests evaluate the equality of variance between factor levels, using the Bartlet and Levene tests. They can only be used when there is a single factor. This tool also generates the graph of the intervals of confidence for the standard deviation.
Example 1:
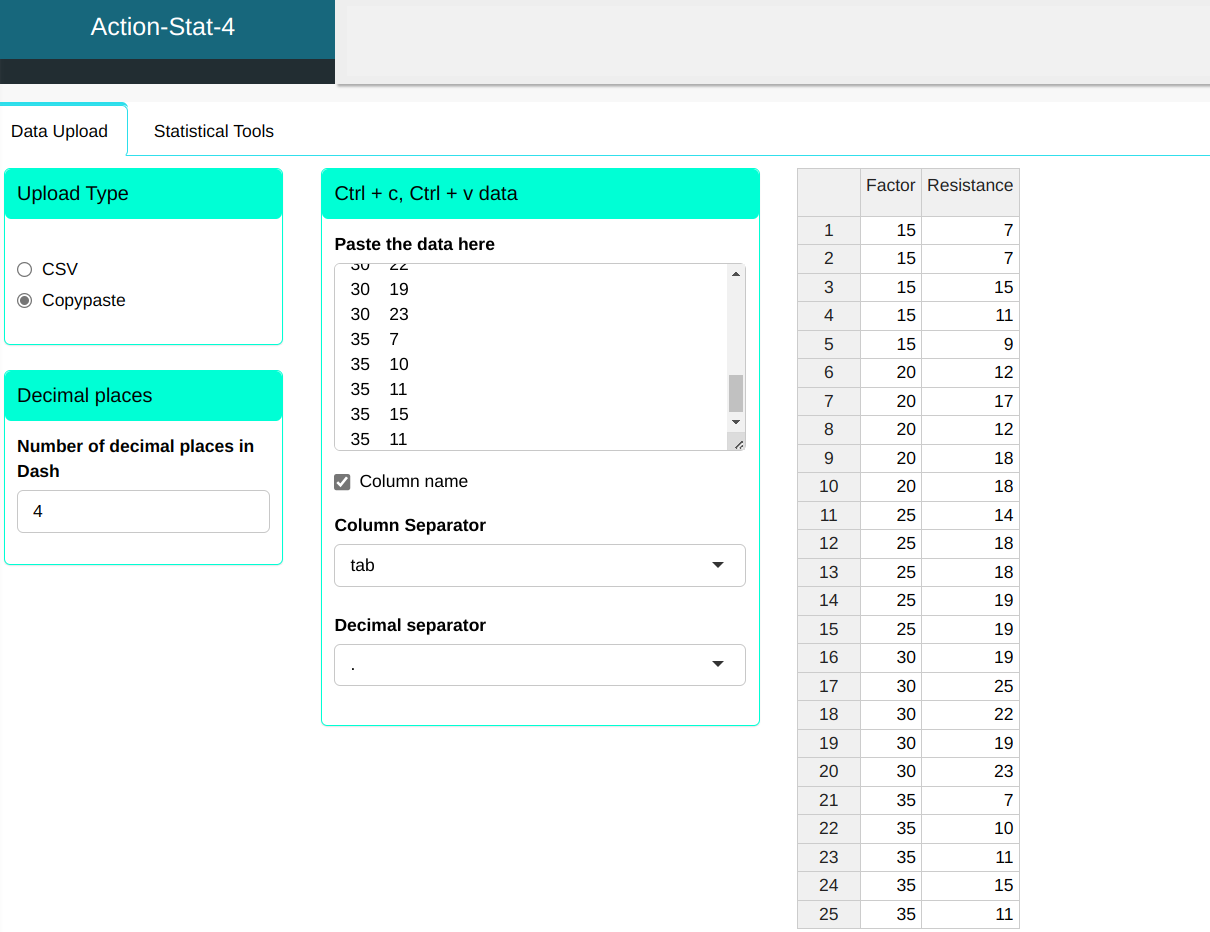
Let us consider the production process of a synthetic fiber, in which the The experimenter wants to know the influence of the percentage of cotton on fiber resistance. For this, an experiment was carried out completely random, in which different levels of cotton percentage were evaluated. evaluated with respect to fiber strength. An important point in The planning of the experiment is that for each factor level (percentage cotton), the other factors that influence the process (such as the environment environment, machine, raw material, etc.) must present a standard homogeneous of variability. In the experiment, we take 5 levels for the cotton percentage and 5 repetitions.
| Factor | Resistance |
|---|---|
| 15 | 7 |
| 15 | 7 |
| 15 | 15 |
| 15 | 11 |
| 15 | 9 |
| 20 | 12 |
| 20 | 17 |
| 20 | 12 |
| 20 | 18 |
| 20 | 18 |
| 25 | 14 |
| 25 | 18 |
| 25 | 18 |
| 25 | 19 |
| 25 | 19 |
| 30 | 19 |
| 30 | 25 |
| 30 | 22 |
| 30 | 19 |
| 30 | 23 |
| 35 | 7 |
| 35 | 10 |
| 35 | 11 |
| 35 | 15 |
| 35 | 11 |
To perform a Variance test, the following configuration is designed, as shown in the figure below.
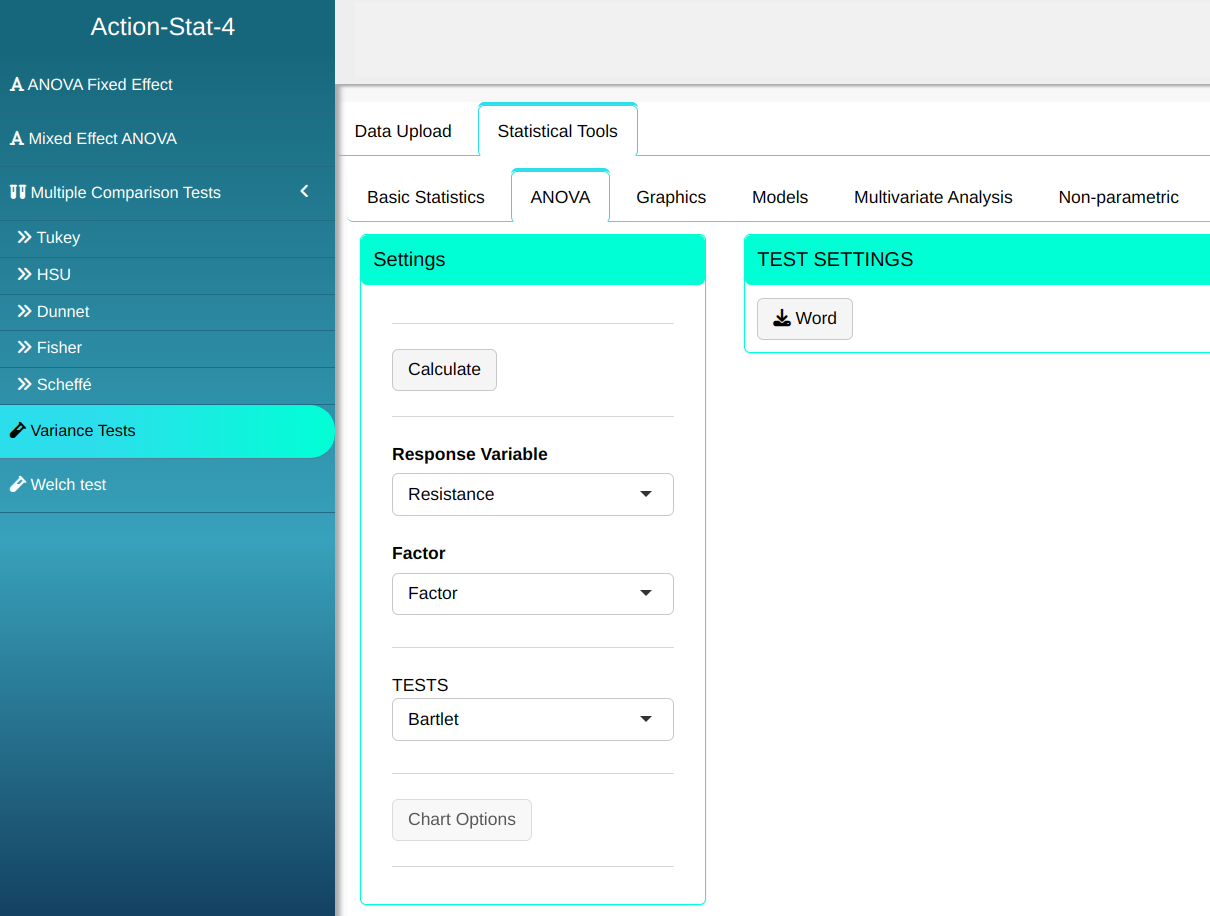
Then click Calculate to get the results. You can also generate the analyses and download them in Word format.

The results are:
Variance test
| Information | Value |
|---|---|
| Bartlett (Statistical test) | 0.933 |
| Degrees of freedom | 4.000 |
| p-value | 0.920 |
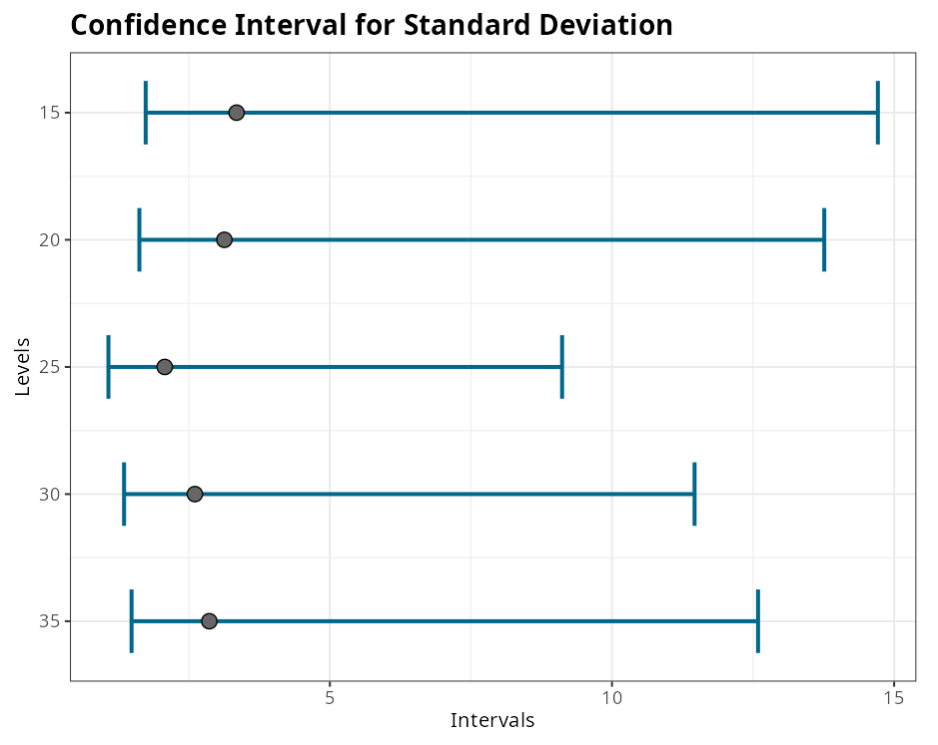
Confidence interval for Standard Deviation
| Factor | Lower limit | Standard deviation | Upper limit |
|---|---|---|---|
| 15 | 1.736 | 3.347 | 14.712 |
| 20 | 1.624 | 3.130 | 13.762 |
| 25 | 1.076 | 2.074 | 9.116 |
| 30 | 1.353 | 2.608 | 11.463 |
| 35 | 1.486 | 2.864 | 12.588 |
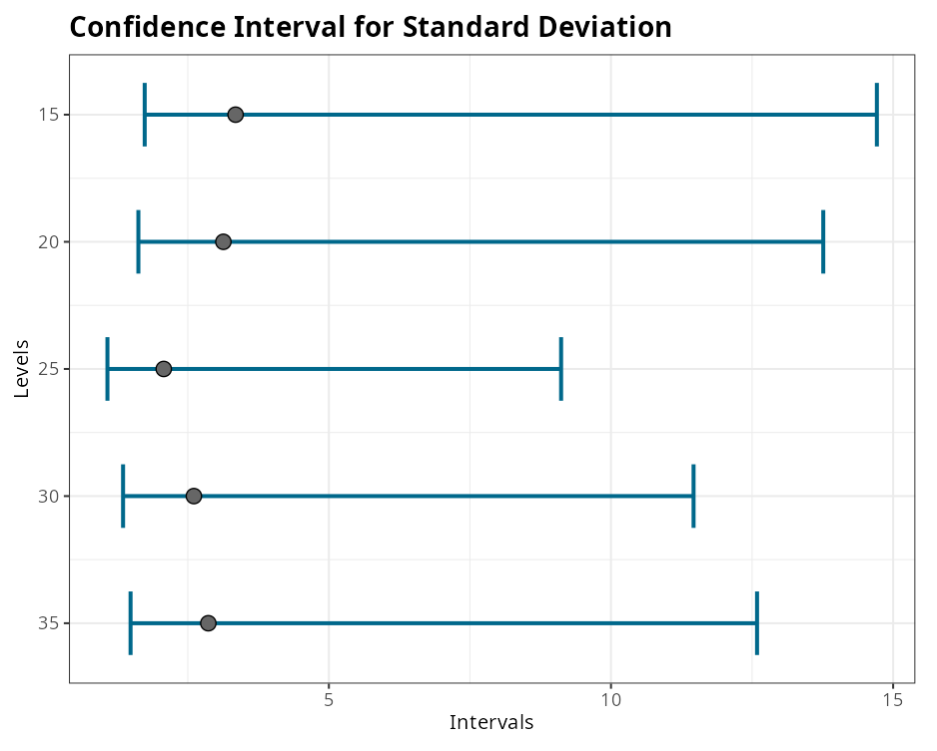
We verify that the P value of the test is greater than the significance level chosen 5%, therefore we do not reject the hypothesis of equality of variations.
Example 2:
With the same data as Example 1, we will now apply the Levene Test.
| Factor | Resistance |
|---|---|
| 15 | 7 |
| 15 | 7 |
| 15 | 15 |
| 15 | 11 |
| 15 | 9 |
| 20 | 12 |
| 20 | 17 |
| 20 | 12 |
| 20 | 18 |
| 20 | 18 |
| 25 | 14 |
| 25 | 18 |
| 25 | 18 |
| 25 | 19 |
| 25 | 19 |
| 30 | 19 |
| 30 | 25 |
| 30 | 22 |
| 30 | 19 |
| 30 | 23 |
| 35 | 7 |
| 35 | 10 |
| 35 | 11 |
| 35 | 15 |
| 35 | 11 |

To perform a Variance test, the following configuration is designed, as shown in the figure below.
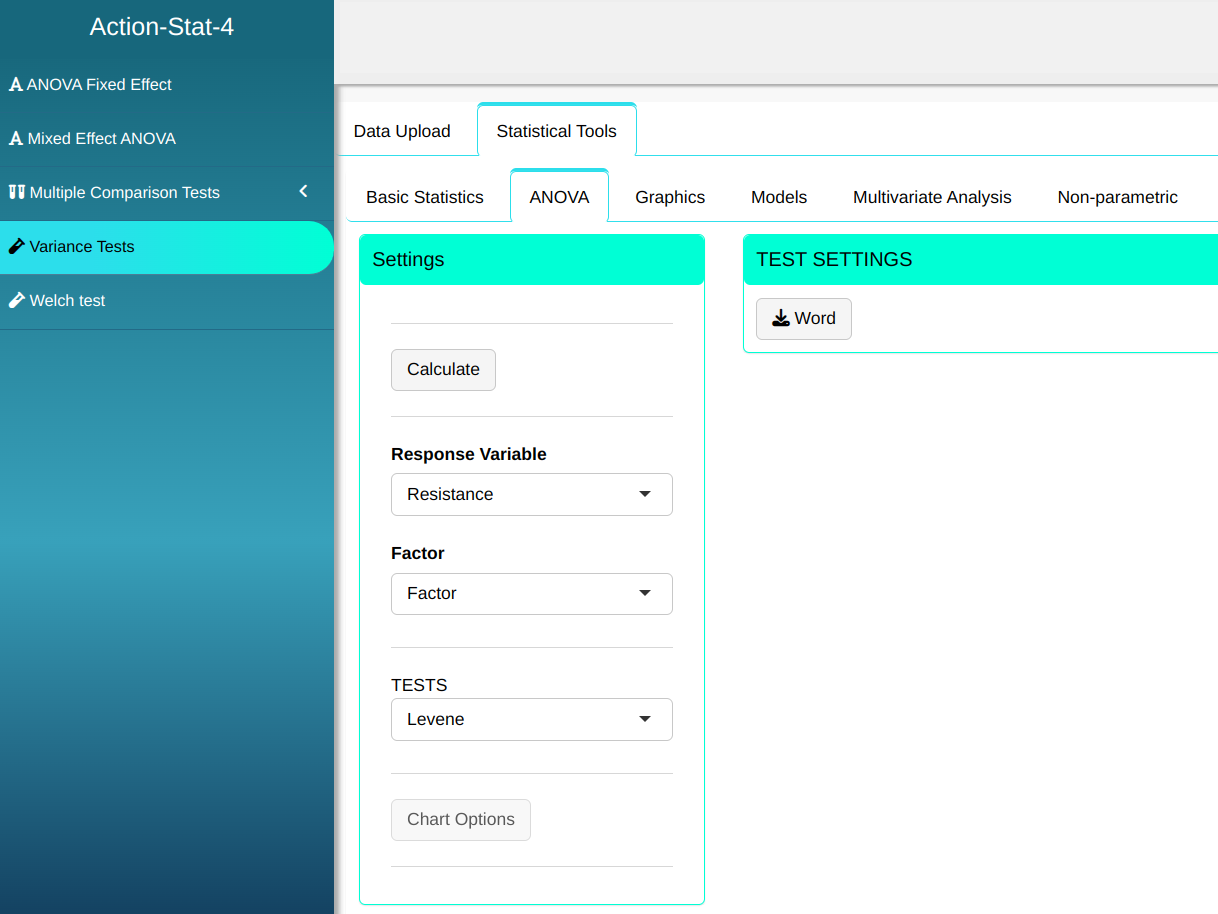
By clicking Calculate we obtain the results:
The results are:
Variance test
| Information | Value |
|---|---|
| Levene (Statistical test) | 0.318 |
| Degrees of freedom | 4.000 |
| P-value | 0.863 |
Confidence intervals for Standard Deviation
| Factor | Lower Limit | Standard Deviation | Upper Limit |
|---|---|---|---|
| 15 | 1.736 | 3.347 | 14.712 |
| 20 | 1.624 | 3.130 | 13.762 |
| 25 | 1.076 | 2.074 | 9.116 |
| 35 | 1.486 | 2.864 | 12.588 |
| 30 | 1.353 | 2.608 | 11.463 |
We verify that the p value of the test is greater than the level of significance chosen 5%, therefore we do not reject the hypothesis of equality of variations.