5. Welch test
The Welch Test is used to evaluate the significance between the difference of the observed means.
Example:
Let us consider a process, product or service in which we wish to evaluate the impact of factor A, so that A has k levels, these being fixed levels. Let us consider that a sample of N experimental units is randomly selected from a population of experimental units. The experimental unit is the basic unit to which treatments are applied.
| Factor | Resistance |
|---|---|
| 15 | 7 |
| 15 | 7 |
| 15 | 15 |
| 15 | 11 |
| 15 | 9 |
| 20 | 12 |
| 20 | 17 |
| 20 | 12 |
| 20 | 18 |
| 20 | 18 |
| 25 | 14 |
| 25 | 18 |
| 25 | 18 |
| 25 | 19 |
| 25 | 19 |
| 30 | 19 |
| 30 | 25 |
| 30 | 22 |
| 30 | 19 |
| 30 | 23 |
| 35 | 7 |
| 35 | 10 |
| 35 | 11 |
| 35 | 15 |
| 35 | 11 |
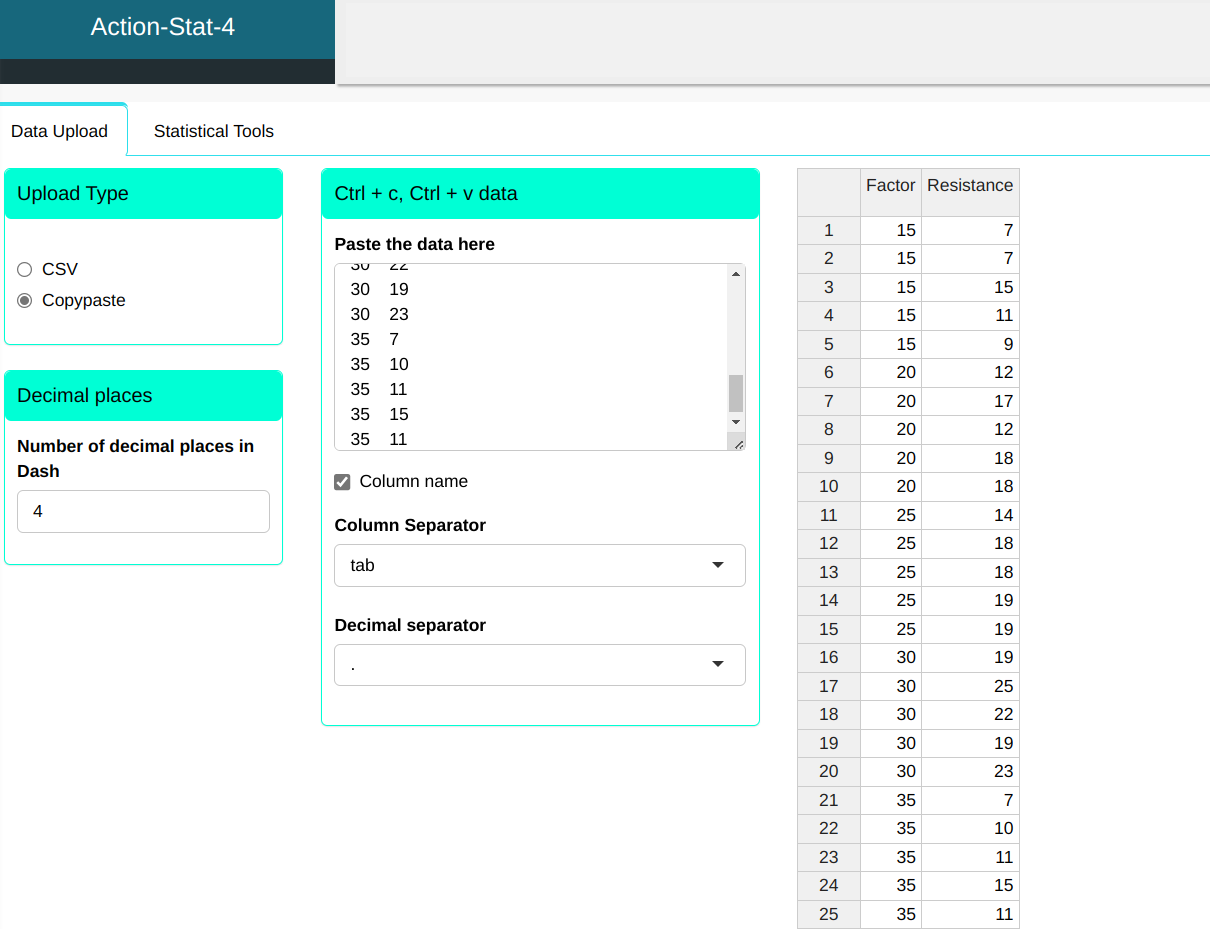
We will do the Welch test:

Then click Calculate to get the results. You can also generate the analyses and download them in Word format.

The results are:
Welch Test (Heteroscedastic Model)
Table 1: Welch Test (Heteroscedastic Model)
| F-Statistic | GL Num | GL Denom | P-Value | |
|---|---|---|---|---|
| F | 12.451 | 4 | 9.916 | 0.000698745 |
Confidence Interval of Means
| Factor | Mean | Standard Deviation | Lower Limit | Upper Limit |
|---|---|---|---|---|
| 15 | 9.8 | 3.347 | 5.645 | 13.955 |
| 20 | 15.4 | 3.130 | 11.513 | 19.287 |
| 25 | 17.6 | 2.074 | 15.025 | 20.175 |
| 30 | 21.6 | 2.608 | 18.362 | 24.838 |
| 35 | 10.8 | 2.864 | 7.244 | 14.356 |

As the p-value = 0.000698745, we reject the H0 hypothesis, that is, for a significance level of 5% we have evidence that the mean are not equal. The graph above helps us reach this conclusion.
The graph shows the mean of each level and the respective confidence intervals.