4. Experiment without Replicas
Through this manual we analyze experiments without replicates.
Example 1:
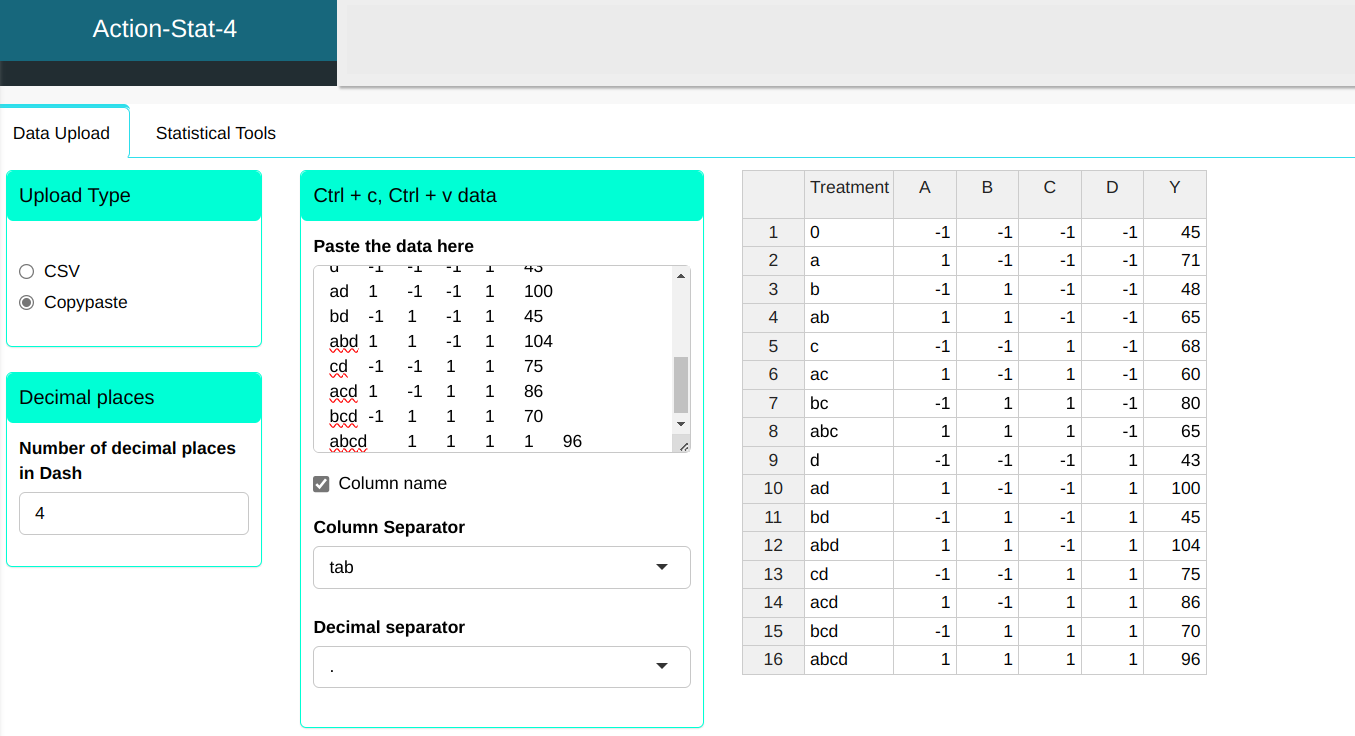
A certain chemical product is produced in a pressure vessel. With the objective of studying study which factors influence the filtration rate of the product (Y), a factorial experiment was carried out in which 4 factors were considered: A (temperature), B (pressure), C (formaldehyde concentration) and D (agitation speed). Each factor is observed at two levels.
| Treatment | A | B | C | D | Y |
|---|---|---|---|---|---|
| 0 | -1 | -1 | -1 | -1 | 45 |
| a | 1 | -1 | -1 | -1 | 71 |
| b | -1 | 1 | -1 | -1 | 48 |
| ab | 1 | 1 | -1 | -1 | 65 |
| c | -1 | -1 | 1 | -1 | 68 |
| ac | 1 | -1 | 1 | -1 | 60 |
| bc | -1 | 1 | 1 | -1 | 80 |
| abc | 1 | 1 | 1 | -1 | 65 |
| d | -1 | -1 | -1 | 1 | 43 |
| ad | 1 | -1 | -1 | 1 | 100 |
| bd | -1 | 1 | -1 | 1 | 45 |
| abd | 1 | 1 | -1 | 1 | 104 |
| cd | -1 | -1 | 1 | 1 | 75 |
| acd | 1 | -1 | 1 | 1 | 86 |
| bcd | -1 | 1 | 1 | 1 | 70 |
| abcd | 1 | 1 | 1 | 1 | 96 |
We will upload the data to the system.
Configure as shown in the figure below to realize the analysis.
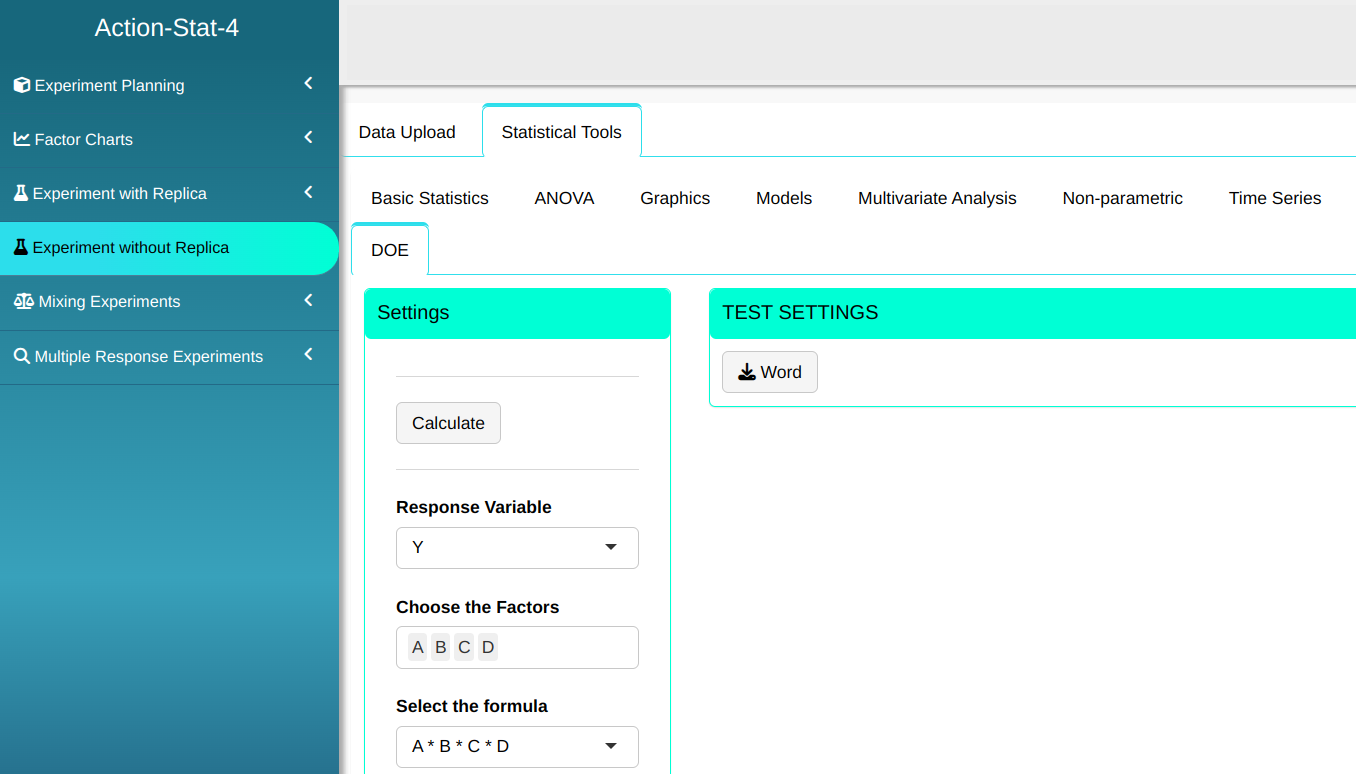

Then click Calculate we obtain the results. You can also generate the analyses and download them in Word format.

The results are
Experiment Analysis without Replication
| Effects | Estimate | Lower Limit | Upper Limit | t Statistic | P-value | |
|---|---|---|---|---|---|---|
| Intercepto | 70.0625 | |||||
| A | 21.6250 | 10.8125 | 14.8772 | 28.3728 | 8.2381 | 0.0004 |
| B | 3.1250 | 1.5625 | -3.6228 | 9.8728 | 1.1905 | 0.2873 |
| C | 9.8750 | 4.9375 | 3.1272 | 16.6228 | 3.7619 | 0.0131 |
| D | 14.6250 | 7.3125 | 7.8772 | 21.3728 | 5.5714 | 0.0026 |
| A:B | 0.1250 | 0.0625 | -6.6228 | 6.8728 | 0.0476 | 0.9639 |
| A:C | -18.1250 | -9.0625 | -24.8728 | -11.3772 | 6.9048 | 0.0010 |
| B:C | 2.3750 | 1.1875 | -4.3728 | 9.1228 | 0.9048 | 0.4071 |
| A:D | 16.6250 | 8.3125 | 9.8772 | 23.3728 | 6.3333 | 0.0014 |
| B:D | -0.3750 | -0.1875 | -7.1228 | 6.3728 | 0.1429 | 0.8920 |
| C:D | -1.1250 | -0.5625 | -7.8728 | 5.6228 | 0.4286 | 0.6861 |
| A:B:C | 1.8750 | 0.9375 | -4.8728 | 8.6228 | 0.7143 | 0.5070 |
| A:B:D | 4.1250 | 2.0625 | -2.6228 | 10.8728 | 1.5714 | 0.1769 |
| A:C:D | -1.6250 | -0.8125 | -8.3728 | 5.1228 | 0.6190 | 0.5630 |
| B:C:D | -2.6250 | -1.3125 | -9.3728 | 4.1228 | 1.0000 | 0.3632 |
| A:B:C:D | 1.3750 | 0.6875 | -5.3728 | 8.1228 | 0.5238 | 0.6228 |
Experiment Analysis withou Replication
| alpha | PSE | ME | SME | t.crit |
|---|---|---|---|---|
| 0.0500 | 2.6250 | 6.7478 | 13.6990 | 2.5706 |
Experiment Analysis withou Replication
| Module Effects | Half-normal score | |
|---|---|---|
| A | 21.6250 | 2.1280 |
| B | 3.1250 | 0.7835 |
| C | 9.8750 | 1.0364 |
| D | 14.6250 | 1.1918 |
| A:B | 0.1250 | 0.0418 |
| A:C | 18.1250 | 1.6449 |
| B:C | 2.3750 | 0.5730 |
| A:D | 16.6250 | 1.3830 |
| B:D | 0.3750 | 0.1257 |
| C:D | 1.1250 | 0.2104 |
| A:B:C | 1.8750 | 0.4770 |
| A:B:D | 4.1250 | 0.9027 |
| A:C:D | 1.6250 | 0.3853 |
| B:C:D | 2.6250 | 0.6745 |
| A:B:C:D | 1.3750 | 0.2967 |
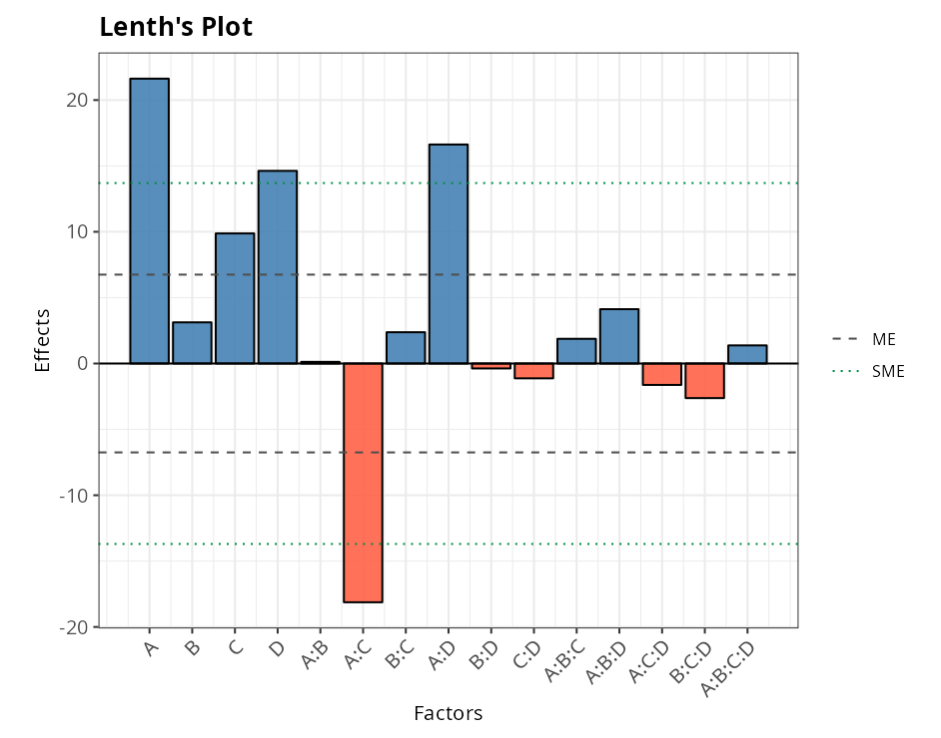
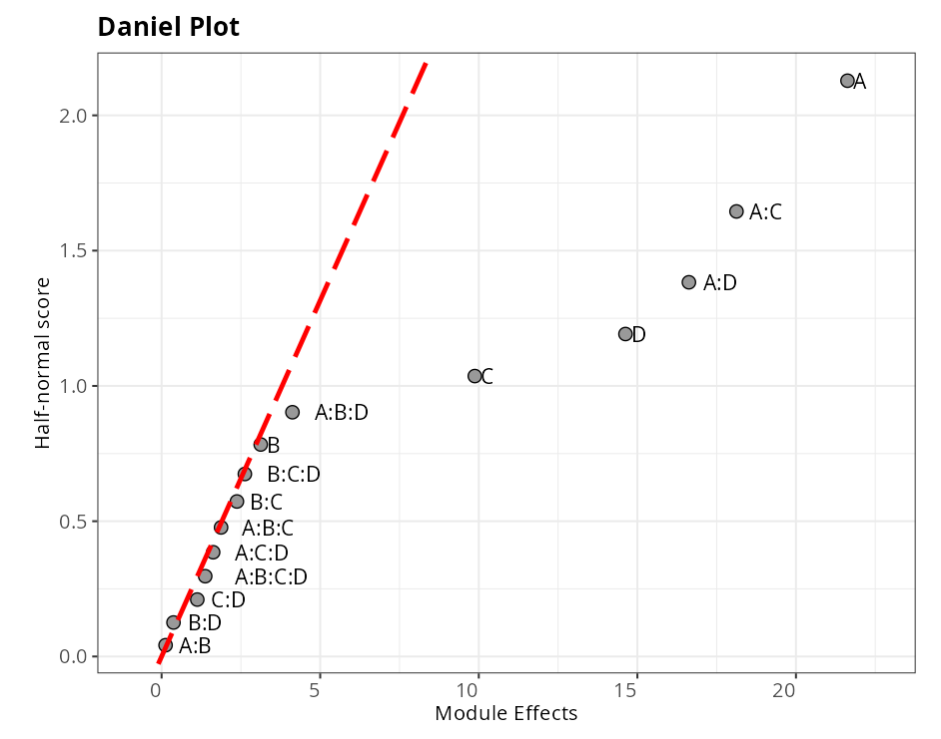
From the results and graphs obtained, we have that factors A, D, and the interactions A:C and A:D are significant.