1. Main Effects
“ACTION” provides the main effects graph tool that used this is used to analyze the behavior of the main effects of a factor applied to the process and/or product.
Example:
In this type of planning, the most used within the industry, k factors are involved, each of them present at only two levels.
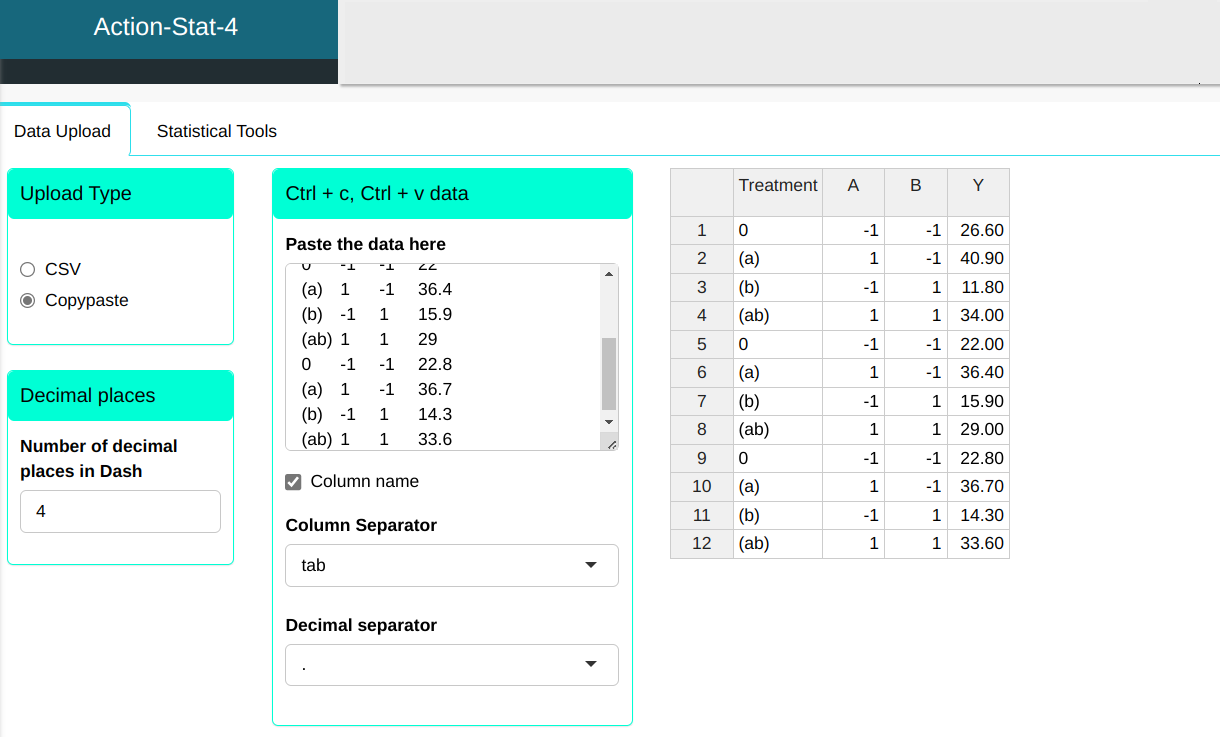
| Treatment | A | B | Y |
|---|---|---|---|
| 0 | -1 | -1 | 26.6 |
| (a) | 1 | -1 | 40.9 |
| (b) | -1 | 1 | 11.8 |
| (ab) | 1 | 1 | 34 |
| 0 | -1 | -1 | 22 |
| (a) | 1 | -1 | 36.4 |
| (b) | -1 | 1 | 15.9 |
| (ab) | 1 | 1 | 29 |
| 0 | -1 | -1 | 22.8 |
| (a) | 1 | -1 | 36.7 |
| (b) | -1 | 1 | 14.3 |
| (ab) | 1 | 1 | 33.6 |
We will make the Main Effects Chart.
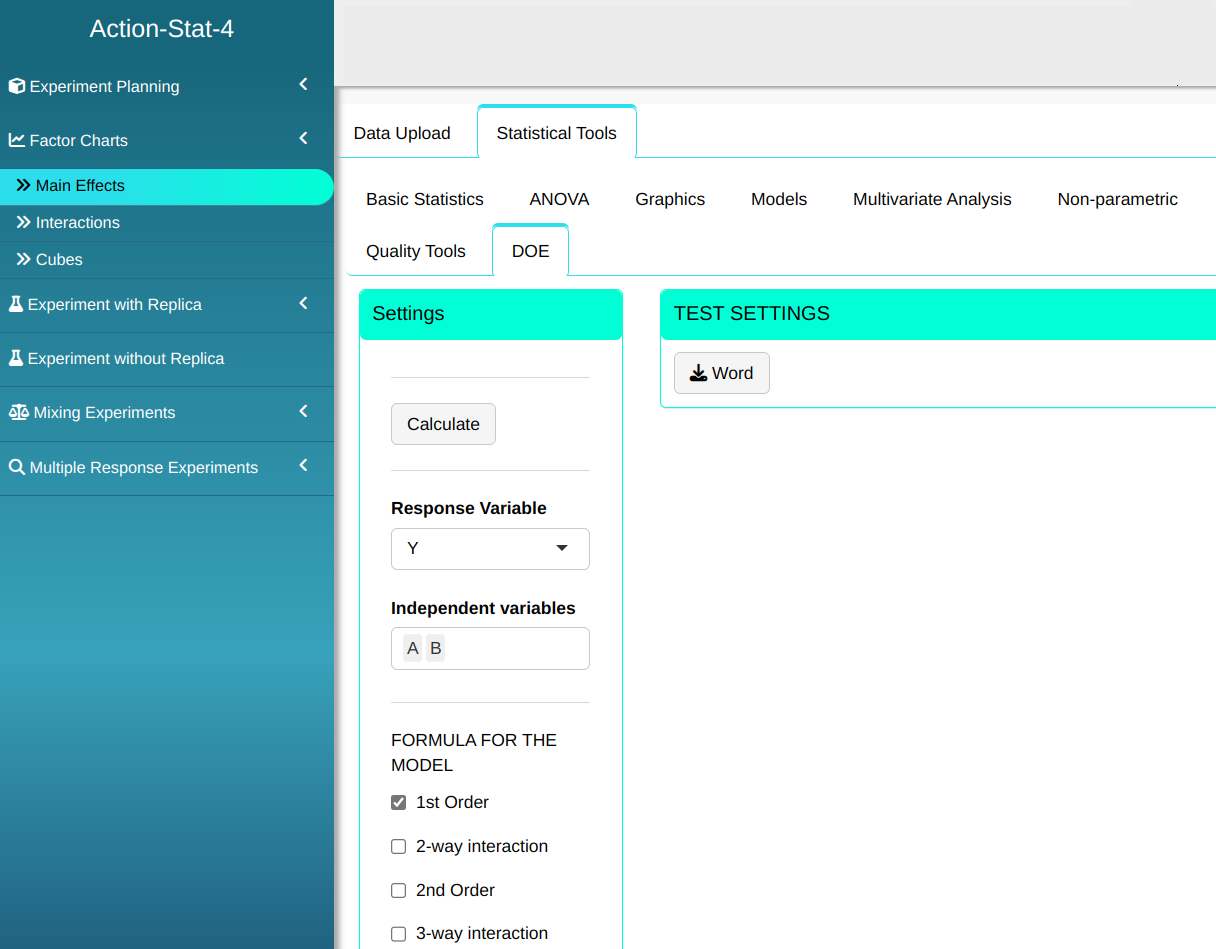

Clicking on Calculate we obtain the results.
The results are:
Confidence interval of the Effect-A
| Level | Lower Limit | Mean Effect | Upper Limit |
|---|---|---|---|
| -1 | 16.5012 | 18.9 | 21.2988 |
| 1 | 32.7012 | 35.1 | 37.4988 |
Confidence interval of the Effect B
| Level | Lower Limit | Mean Effect | Upper Limit |
|---|---|---|---|
| -1 | 28.5012 | 30.9 | 33.2988 |
| 1 | 20.7012 | 23.1 | 25.4988 |
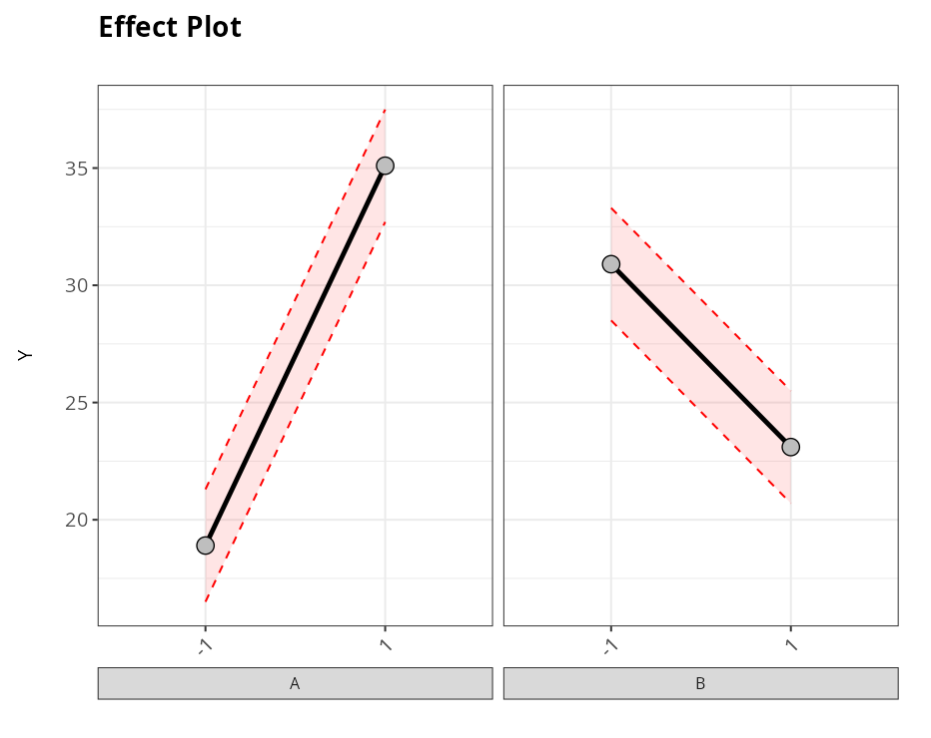
As there is apparently no interaction, we can analyze the graph and see that on average, when we change from A− to A+ the reaction time increases and when we go from B− to B+ the reaction time decreases. Again, we cannot conclude just by using the graphs, we need to do a statistical analysis to verify if each factor is significant and if the interaction is really not significant, and what would be the best levels to obtain the shortest reaction time.