2. Interactions
The Interaction Graph is used when we have at least two factors. With this graph it is possible to identify whether there is interaction between the factors present or whether they are independent.
Example:
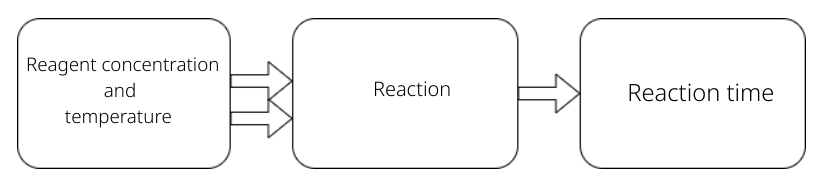
Study the effect on time of a given chemical reaction with the variation in temperature and concentration of a reactant, as shown in scheme below.
| Variable Answer | Y: Reaction time |
|---|---|
| Factors | A: Concentration of Reagent (Levels $V_{-1}$=10% e $V_{+1}$=20%) |
| B: Temperature (levels $T_{-1}$=80ºC e $T_{+1}$=90ºC) | |
| Treatment | $V_{-1}$ $T_{-1}$ - concentration in 10% e temperature in 80ºC ((0)),$\quad$ & |
| $V_{+1}$ $T_{-1}$ - concentration in 20% e temperature in 80ºC (a), | |
| $V_{-1}$ $T_{+1}$ - concentration in 10% e temperature in 90ºC (b) | |
| $V_{+1}$ $T_{+1}$ - concentration in 20% e temperature in 90ºC (ab) | |
| (The number of treatments is 2k, in this case $2^2$=4) | |
| Experimental Unit | Time period for each reaction |
| Replicas | Repetition of the experiment done under the same conditions |
| experimental, in the case of the example under the same temperature | |
| level and reagent. How much more replicas, more reliable the | |
| results of the experiment. |
Build a table like below:
| Treatment | A | B | Y |
|---|---|---|---|
| 0 | -1 | -1 | 26.6 |
| (a) | 1 | -1 | 40.9 |
| (b) | -1 | 1 | 11.8 |
| (ab) | 1 | 1 | 34 |
| 0 | -1 | -1 | 22 |
| (a) | 1 | -1 | 36.4 |
| (b) | -1 | 1 | 15.9 |
| (ab) | 1 | 1 | 29 |
| 0 | -1 | -1 | 22.8 |
| (a) | 1 | -1 | 36.7 |
| (b) | -1 | 1 | 14.3 |
| (ab) | 1 | 1 | 33.6 |
–
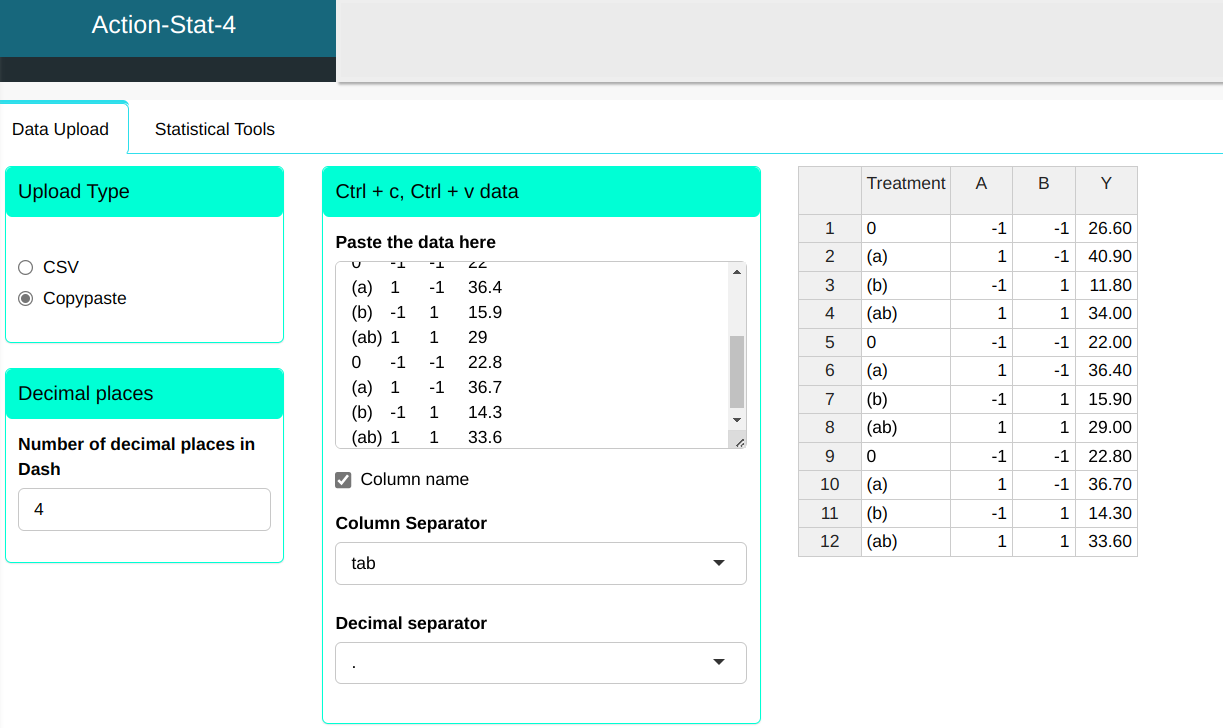
We will upload the data to the system.
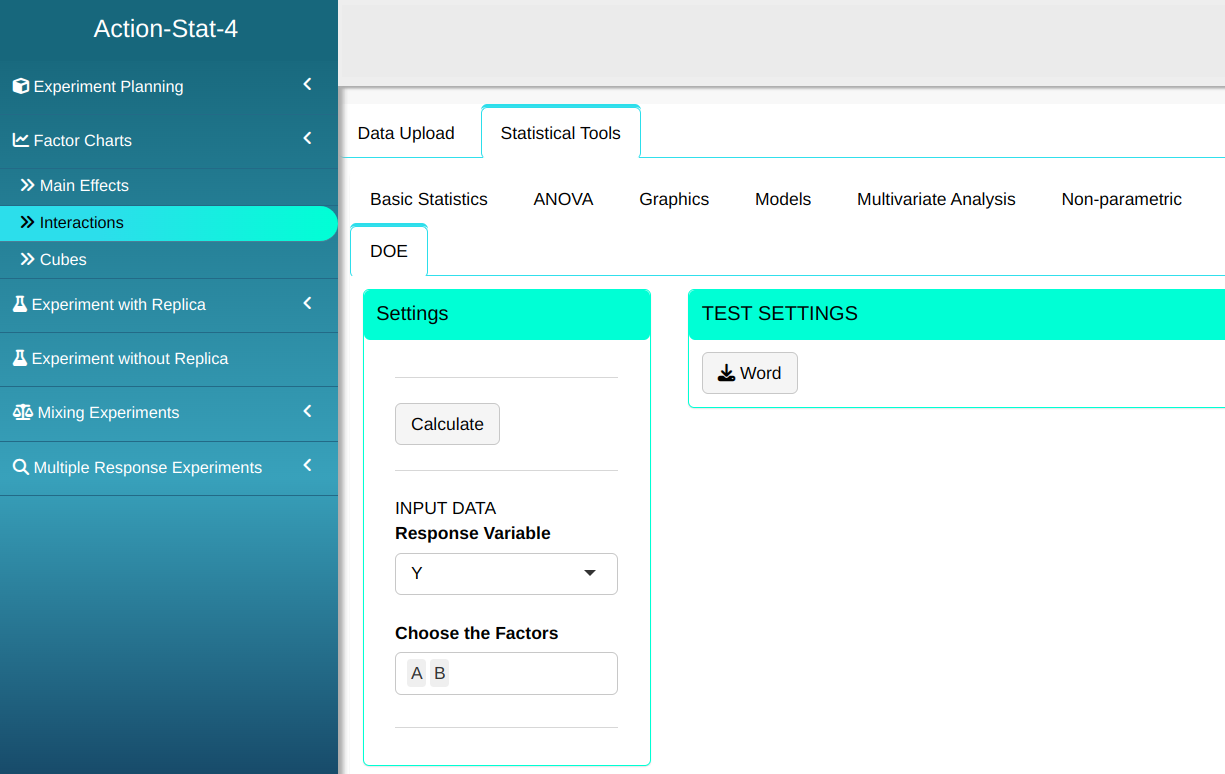
We will make the interactions graph, simply configure as shown in the figure below.
Clicking on Calculate we obtain the results. You can also generate the analyses And download the results in Word format.

The results are:
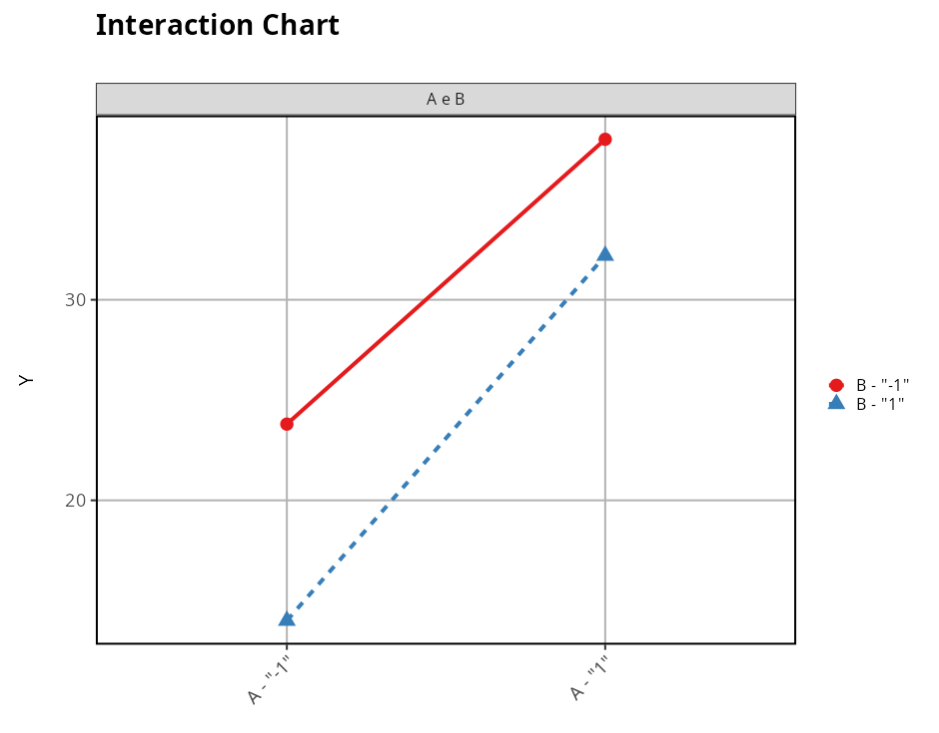
In Figure 1, we see that there appears to be no interaction between factors A and B, given that the lines are approximately parallel, that is, when we change the level of factor B, the behavior of factor A is similar in two levels indicating that there is no relationship between A and B.