3. Cubes
The cubic graph is used to visually identify possible Solutions for the experiment.
Example 1:
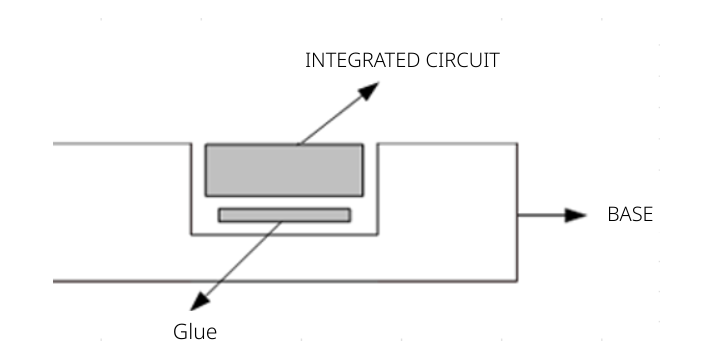
Process of gluing an integrated circuit to a base.
The following table summarizes the conditions of the experiment.
| Response variables | Y:Glue Strength (lbs) |
|---|---|
| A: Type of glue (levels A_{-1}: current mark and A_{+1}: new brand) | |
| Factors | B: Base material (levels B_{-1}: current and B_{+1}: new specification) |
| C: Curing time at 100ºC (levels C_{-1}: 90 min and C_{+1}: 120 min) | |
| Number of treatments: | $2^3$ =8 |
| Number of replicas: | 2 |
| Number of runs: | 8*2=16 |
The observed data of the (complete) experiment with 2 repetitions are given. then with the random order of execution in parentheses
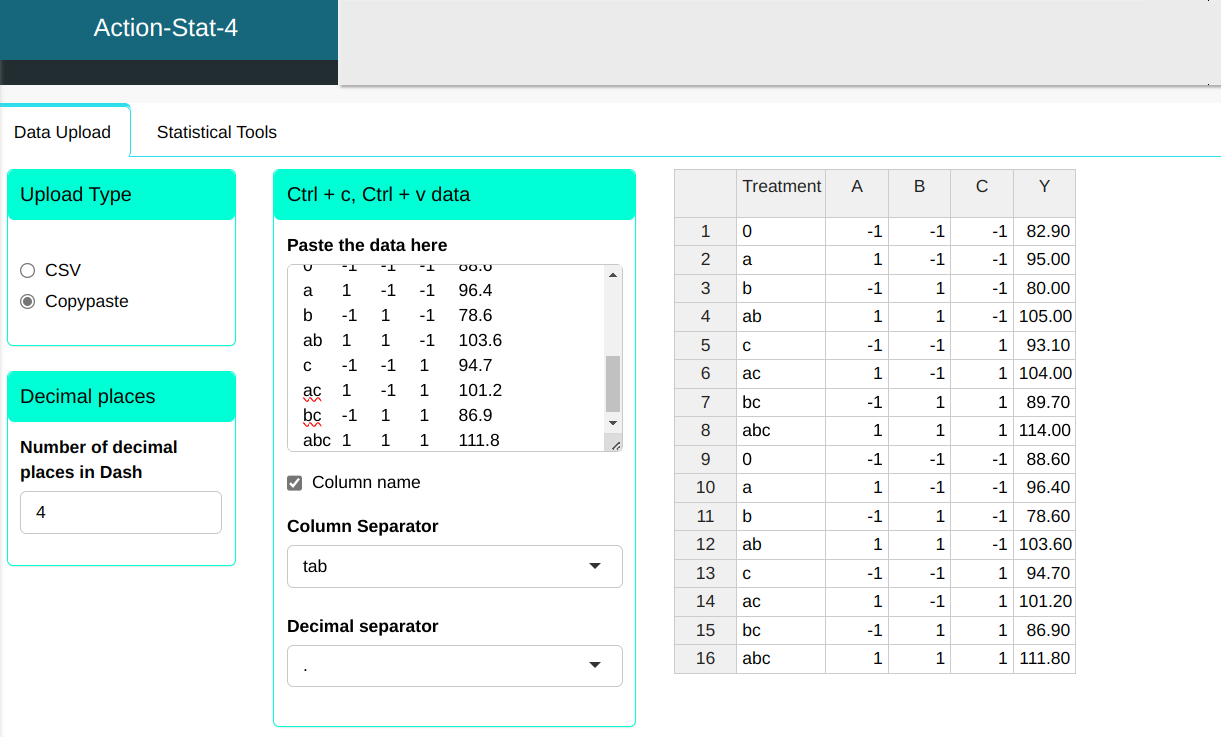
We will build a table like the following:
| Treatment | A | B | C | Y |
|---|---|---|---|---|
| 0 | -1 | -1 | -1 | 82.9 |
| a | 1 | -1 | -1 | 95 |
| b | -1 | 1 | -1 | 80 |
| ab | 1 | 1 | -1 | 105 |
| c | -1 | -1 | 1 | 93.1 |
| ac | 1 | -1 | 1 | 104 |
| bc | -1 | 1 | 1 | 89.7 |
| abc | 1 | 1 | 1 | 114 |
| 0 | -1 | -1 | -1 | 88.6 |
| a | 1 | -1 | -1 | 96.4 |
| b | -1 | 1 | -1 | 78.6 |
| ab | 1 | 1 | -1 | 103.6 |
| c | -1 | -1 | 1 | 94.7 |
| ac | 1 | -1 | 1 | 101.2 |
| bc | -1 | 1 | 1 | 86.9 |
| abc | 1 | 1 | 1 | 111.8 |
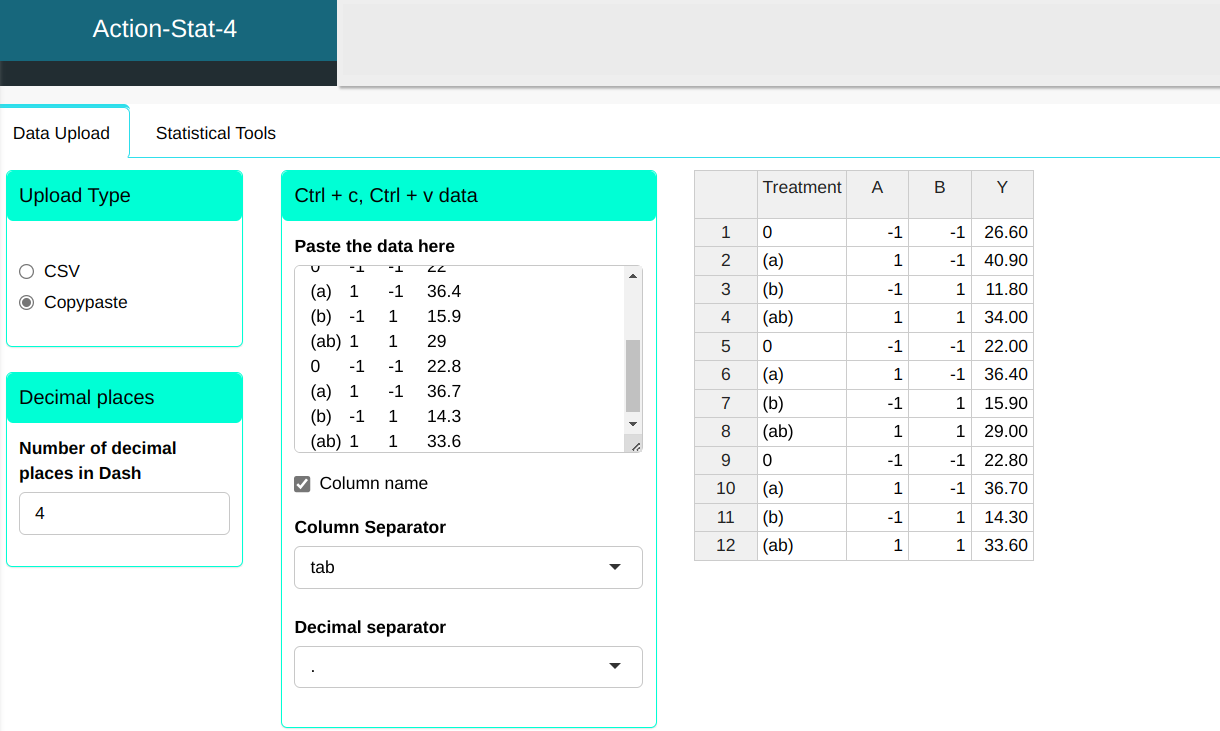
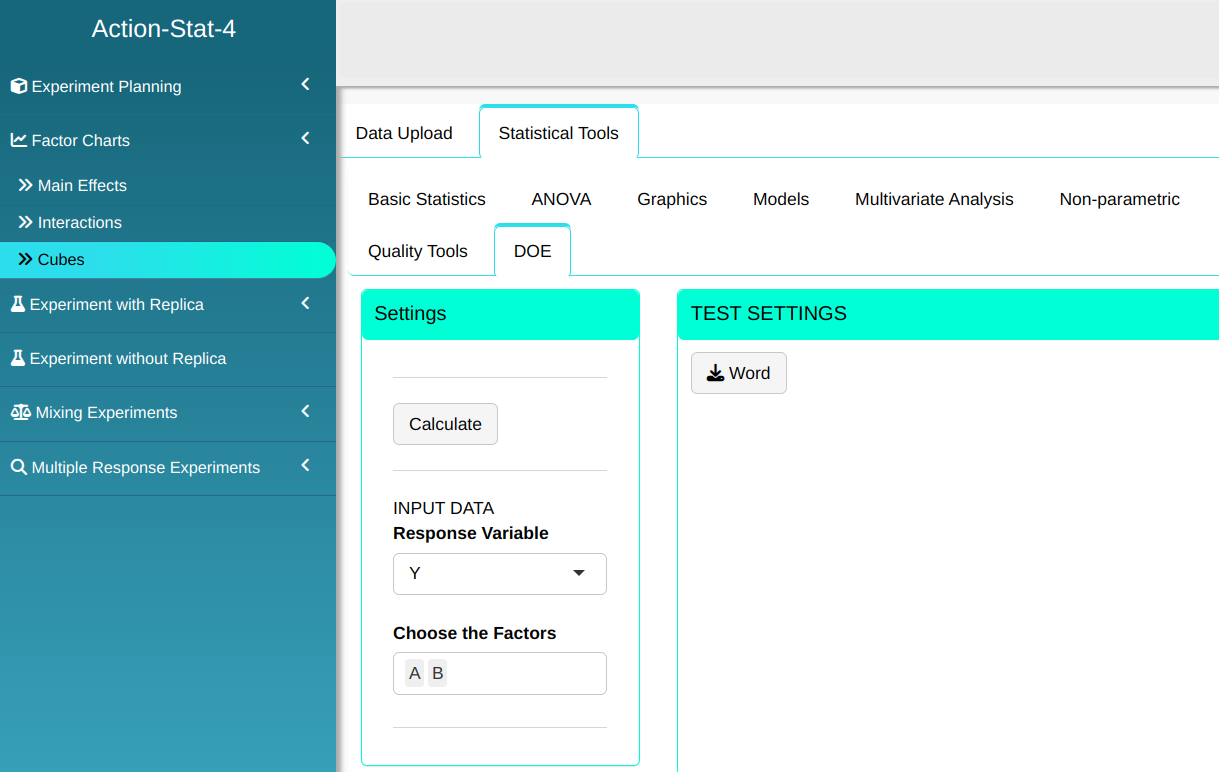
We will upload the data to the system.
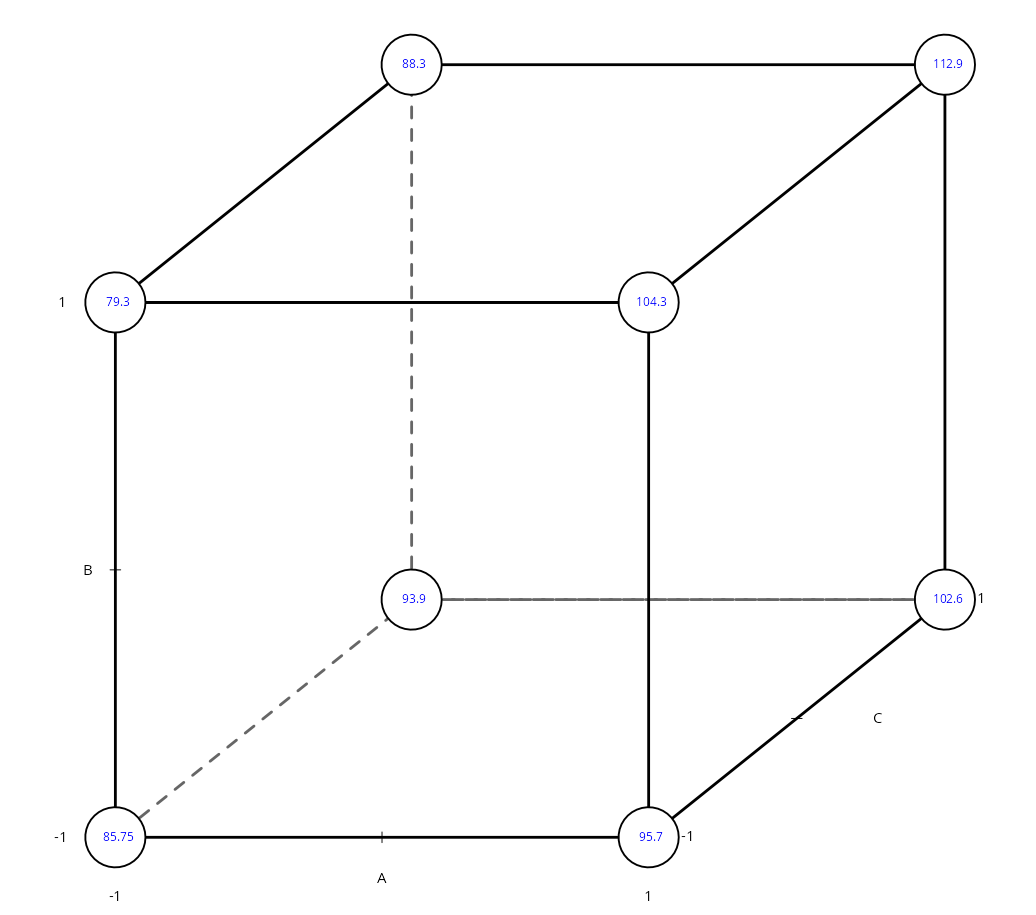
We will make the cube graph.
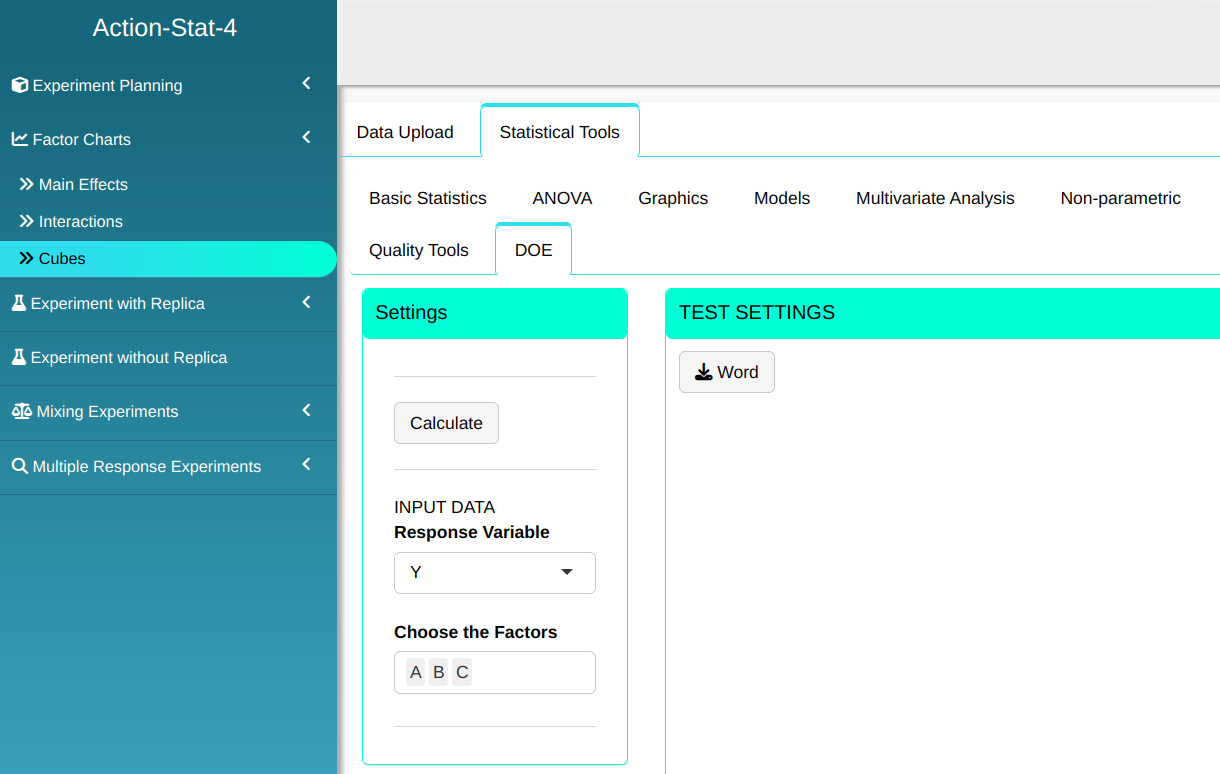
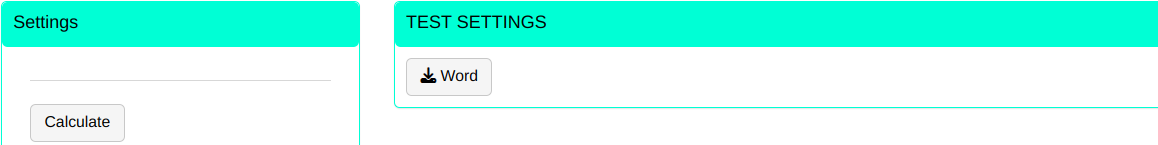
By clicking on Calculate we obtain the results and you can download the results in Word format.
The results are:
Mean values
| A | B | C | Y | |
|---|---|---|---|---|
| 1 | -1 | -1 | -1 | 85.75 |
| 2 | 1 | -1 | -1 | 95.70 |
| 3 | -1 | -1 | 1 | 93.90 |
| 4 | 1 | -1 | 1 | 102.60 |
| 5 | -1 | 1 | -1 | 79.30 |
| 6 | 1 | 1 | -1 | 104.30 |
| 7 | -1 | 1 | 1 | 88.30 |
| 8 | 1 | 1 | 1 | 112.90 |
Example 2:
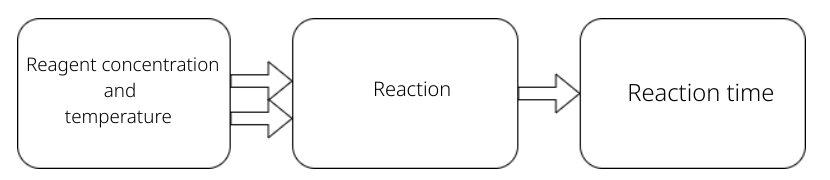
Study the effect over time of a certain chemical reaction with the variation in the temperature and concentration of a reactant, as shown in scheme below.
For the previous example, we can define:
| Variable Answer | Y: Reaction time |
|---|---|
| Factors | A: Concentration of Reagent (Levels $V_{-1}$=10% e $V_{+1}$=20%) |
| B: Temperature (levels $T_{-1}$=80ºC e $T_{+1}$=90ºC) | |
| Treatment | $V_{-1}$ $T_{-1}$ - concentration in 10% e temperature in 80ºC ((0)),$\quad$ & |
| $V_{+1}$ $T_{-1}$ - concentration in 20% e temperature in 80ºC (a), | |
| $V_{-1}$ $T_{+1}$ - concentration in 10% e temperature in 90ºC (b) | |
| $V_{+1}$ $T_{+1}$ - concentration in 20% e temperature in 90ºC (ab) | |
| (The number of treatments is 2k, in this case $2^2$=4) | |
| Experimental Unit | Time period for each reaction |
| Replicas | Repetition of the experiment done under the same conditions |
| experimental, in the case of the example under the same temperature | |
| level and reagent. How much more replicas, more reliable the | |
| results of the experiment. |
We will build a table like the following:
| Treatment | A | B | Y |
|---|---|---|---|
| 0 | -1 | -1 | 26.6 |
| (a) | 1 | -1 | 40.9 |
| (b) | -1 | 1 | 11.8 |
| (ab) | 1 | 1 | 34 |
| 0 | -1 | -1 | 22 |
| (a) | 1 | -1 | 36.4 |
| (b) | -1 | 1 | 15.9 |
| (ab) | 1 | 1 | 29 |
| 0 | -1 | -1 | 22.8 |
| (a) | 1 | -1 | 36.7 |
| (b) | -1 | 1 | 14.3 |
| (ab) | 1 | 1 | 33.6 |
We will upload the data to the system.
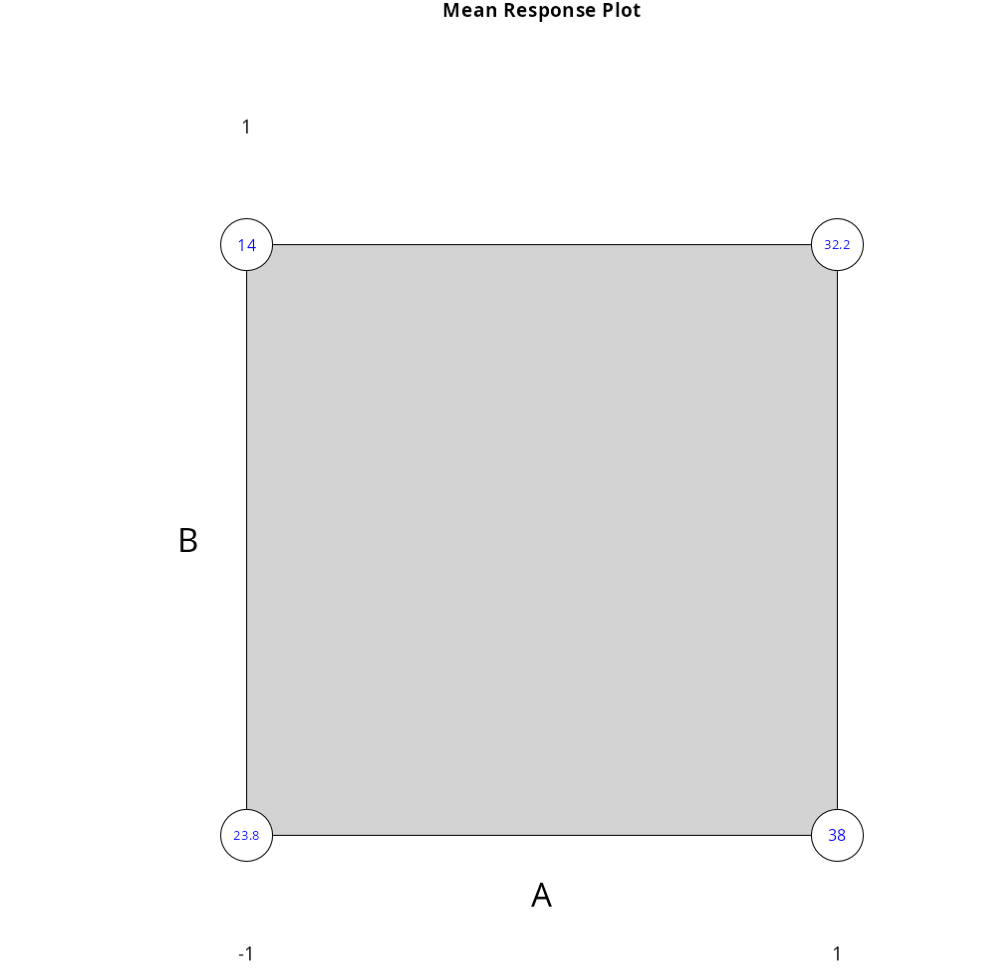
We will make the graph of the cube.
By clicking on Calculate we obtain the results and you can download the results in Word format
The results are:
Mean values
| A | B | Y | |
|---|---|---|---|
| 1 | -1 | -1 | 23.8 |
| 2 | 1 | -1 | 38.0 |
| 3 | -1 | 1 | 14.0 |
| 4 | 1 | 1 | 32.2 |
Response mean graph