2. Response surface
This type of experiment is suitable for studying efficiently and Economic the effect of factors on the variable of interest.
Example 1:
An important step in the production of a polyamide resin is the addition of amines. It was hypothesized that the manner of addition has a profound effect on the molecular weight distribution of the resin. Three variables were then considered: amine temperature ($x_1$, ºC), agitation ($x_2$, RPM), and the addition rate ($x_3$, 1/min). Since it is difficult to determine the levels of addition and agitation, three levels were considered and a Box-Behnken experiment was proposed as follows.
| Level | Temperature | Agitation | Rate | $x_1$ | $x_2$ | $x_3$ |
|---|---|---|---|---|---|---|
| High | 200 | 10 | 25 | 1 | 1 | 1 |
| Medium | 175 | 7.5 | 20 | 0 | 0 | 0 |
| Low | 150 | 5 | 15 | -1 | -1 | -1 |
To carry out the Experiment Planning, we will carry out the next steps:
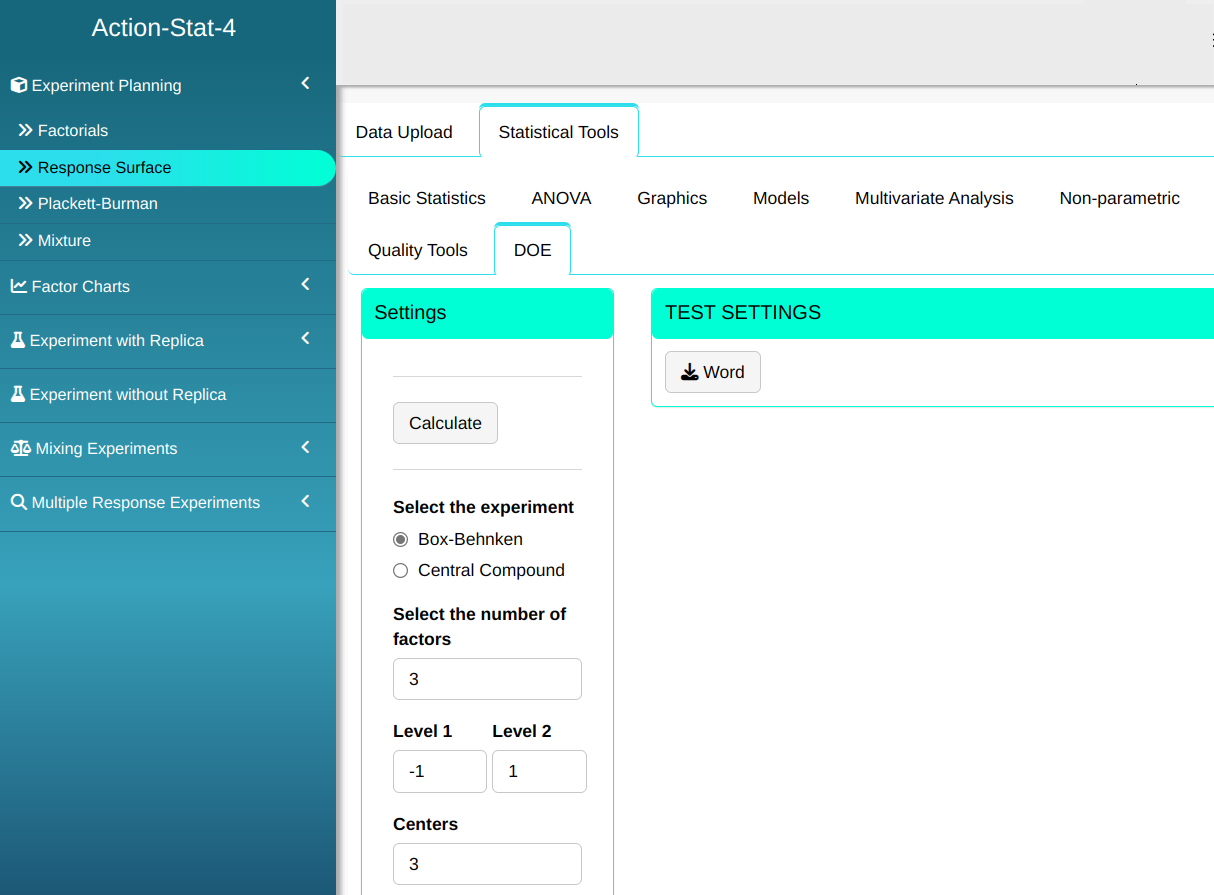

By clicking on Calculate we obtain the results and download the results in Word format.

The results are:
Box-Behnken
| Order | A | B | C | |
|---|---|---|---|---|
| 3 | 1 | -1 | 1 | 0 |
| 15 | 2 | 0 | 0 | 0 |
| 12 | 3 | 0 | 1 | 1 |
| 10 | 4 | 0 | 1 | -1 |
| 8 | 5 | 1 | 0 | 1 |
| 4 | 6 | 1 | 1 | 0 |
| 13 | 7 | 0 | 0 | 0 |
| 9 | 8 | 0 | -1 | -1 |
| 11 | 9 | 0 | -1 | 1 |
| 7 | 10 | -1 | 0 | 1 |
| 14 | 11 | 0 | 0 | 0 |
| 1 | 12 | -1 | -1 | 0 |
| 5 | 13 | -1 | 0 | -1 |
| 6 | 14 | 1 | 0 | -1 |
| 2 | 15 | 1 | -1 | 0 |
Example 2:
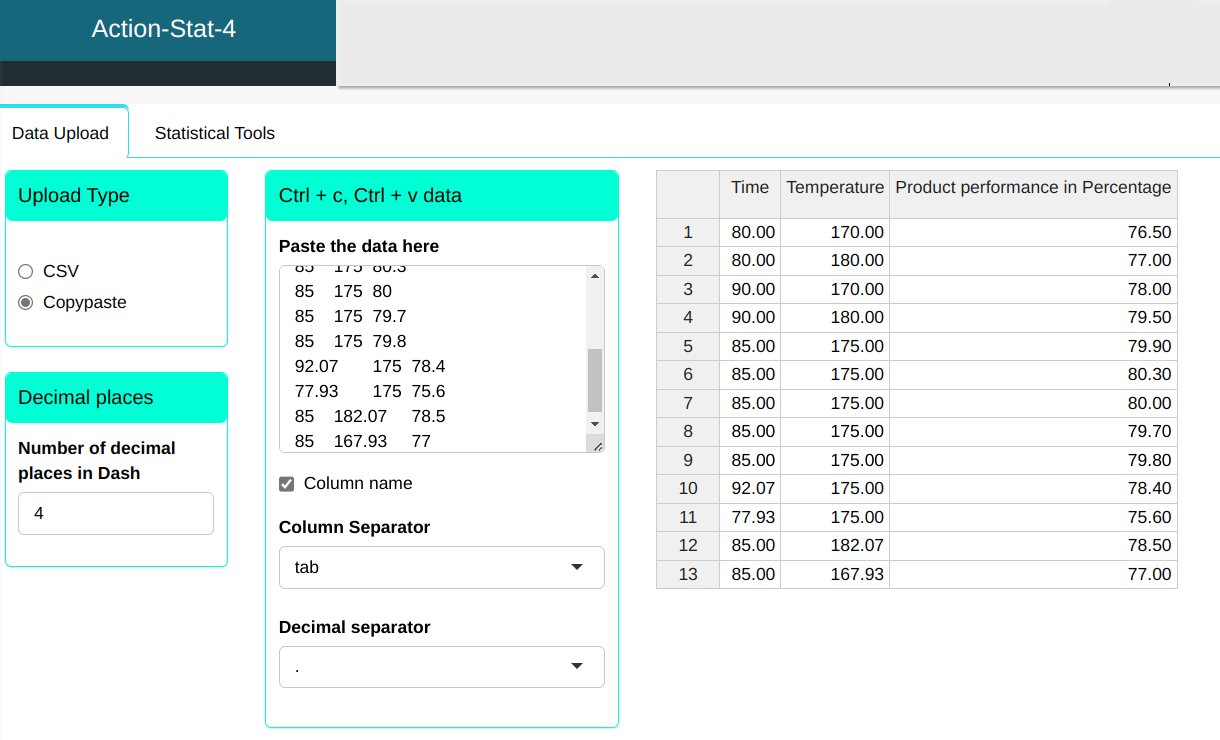
(Montgomery, 1985) In the analysis of a chemical process we will develop a 2nd order response surface model to relate time reaction rate and temperature in relation to product performance. at the table, we have the original data before composition planning central.
| Time | Temperature | Product (performance %) |
|---|---|---|
| 80 | 170 | 76.5 |
| 80 | 180 | 77 |
| 90 | 170 | 78 |
| 90 | 180 | 79.5 |
| 85 | 175 | 79.9 |
| 85 | 175 | 80.3 |
| 85 | 175 | 80 |
| 85 | 175 | 79.7 |
| 85 | 175 | 79.8 |
| 92.07 | 175 | 78.4 |
| 77.93 | 175 | 75.6 |
| 85 | 182.07 | 78.5 |
| 85 | 167.93 | 77 |
We will upload the data to the system.
To carry out the Experiment Planning, we will carry out the next steps:
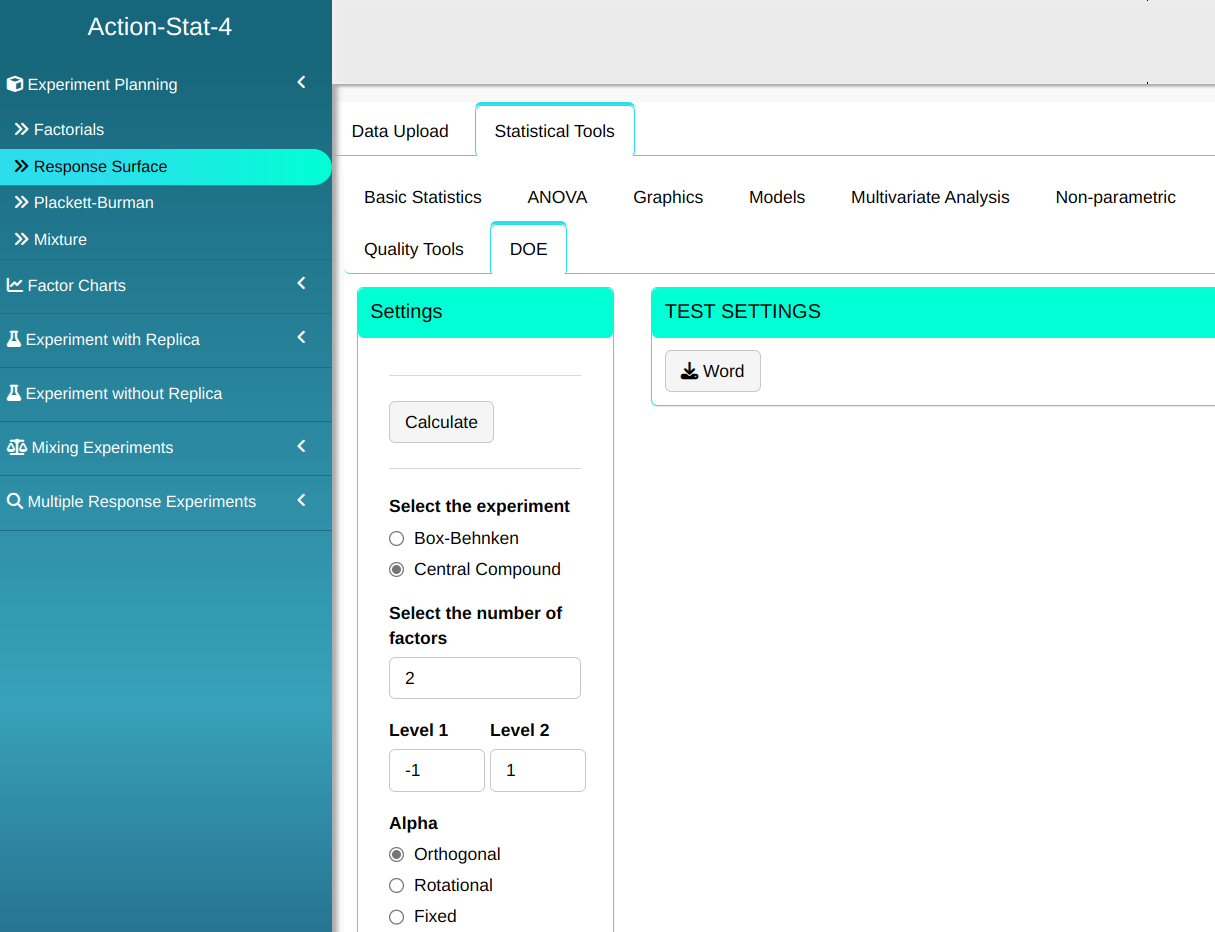

By clicking on Calculate we obtain the results and download the results in Word format.
The results are:
Central Composite
| Blocks | A | B | |
|---|---|---|---|
| C1-1 | 1 | -1 | -1 |
| C1-2 | 1 | 1 | -1 |
| C1-3 | 1 | -1 | 1 |
| C1-4 | 1 | 1 | 1 |
| C1-5 | 1 | 0 | 0 |
| C1-6 | 1 | 0 | 0 |
| C1-7 | 1 | 0 | 0 |
| C1-8 | 1 | 0 | 0 |
| S2-1 | 2 | -1.4142 | 0 |
| S2-2 | 2 | 1.4142 | 0 |
| S2-3 | 2 | 0 | -1.4142 |
| S2-4 | 2 | 0 | 1.4142 |
| S2-5 | 2 | 0 | 0 |
| S2-6 | 2 | 0 | 0 |
| S2-7 | 2 | 0 | 0 |
| S2-8 | 2 | 0 | 0 |