13. Tolerance Interval
The Tolerance Interval defines the upper and/or lower limits within which a given characteristic/specific percentage falls at a stated confidence level.
Example 1:
The aim is to determine a percentage of 90% of the population with a confidence level of 95%.
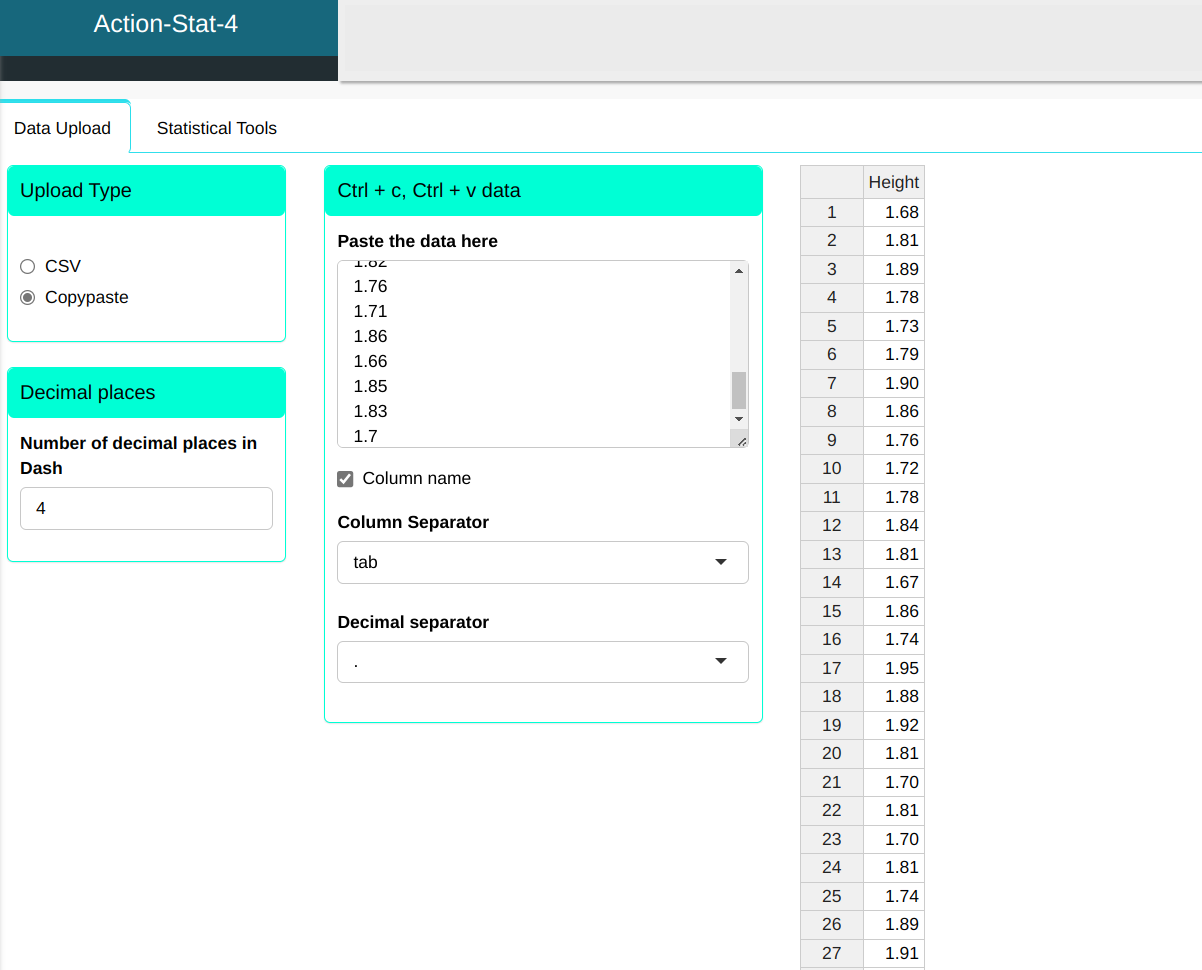
| Height |
|---|
| 1.68 |
| 1.81 |
| 1.89 |
| 1.78 |
| 1.73 |
| 1.79 |
| 1.90 |
| 1.86 |
| 1.76 |
| 1.72 |
| 1.78 |
| 1.84 |
| 1.81 |
| 1.67 |
| 1.86 |
| 1.74 |
| 1.95 |
| 1.88 |
| 1.92 |
| 1.81 |
| 1.70 |
| 1.81 |
| 1.70 |
| 1.81 |
| 1.74 |
| 1.89 |
| 1.91 |
| 1.80 |
| 1.82 |
| 1.76 |
| 1.71 |
| 1.86 |
| 1.66 |
| 1.85 |
| 1.83 |
| 1.7 |
We will upload the data to the system
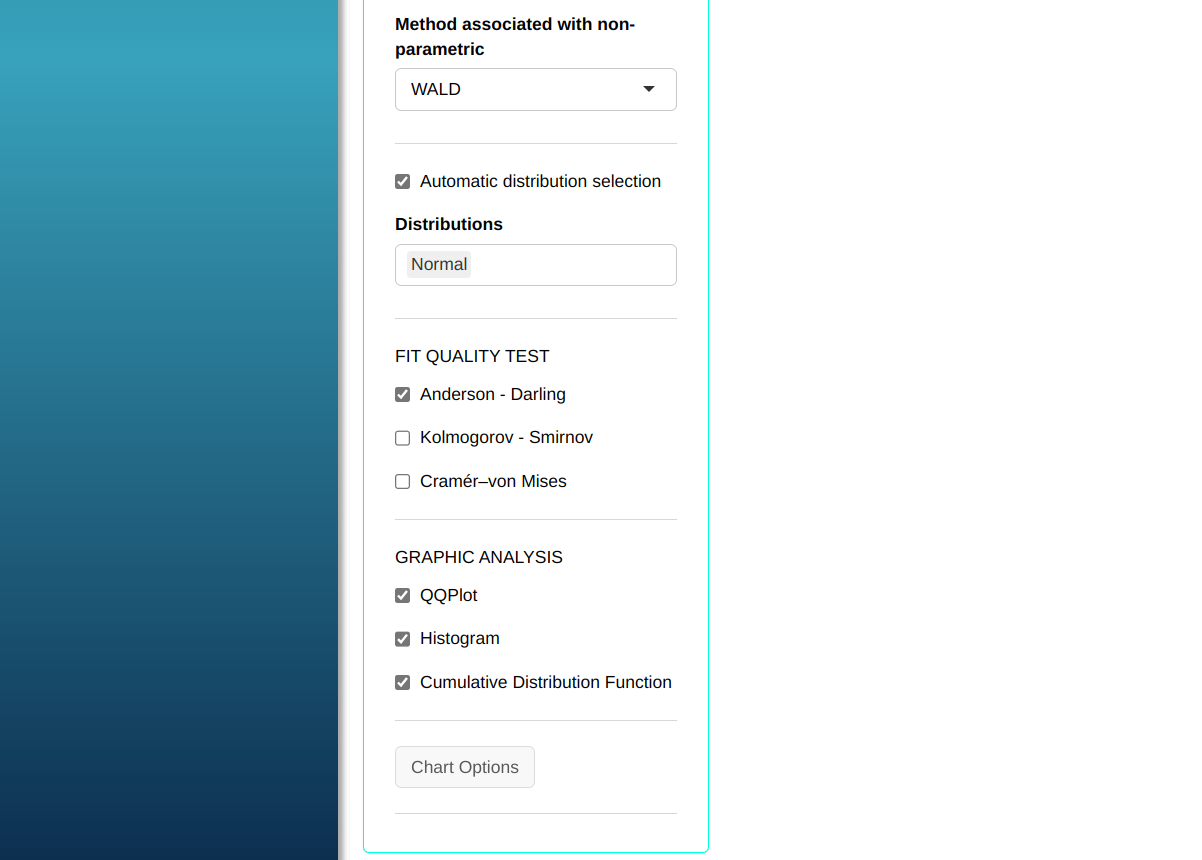
Configuring according to the figure below for calculate the Tolerance Interval
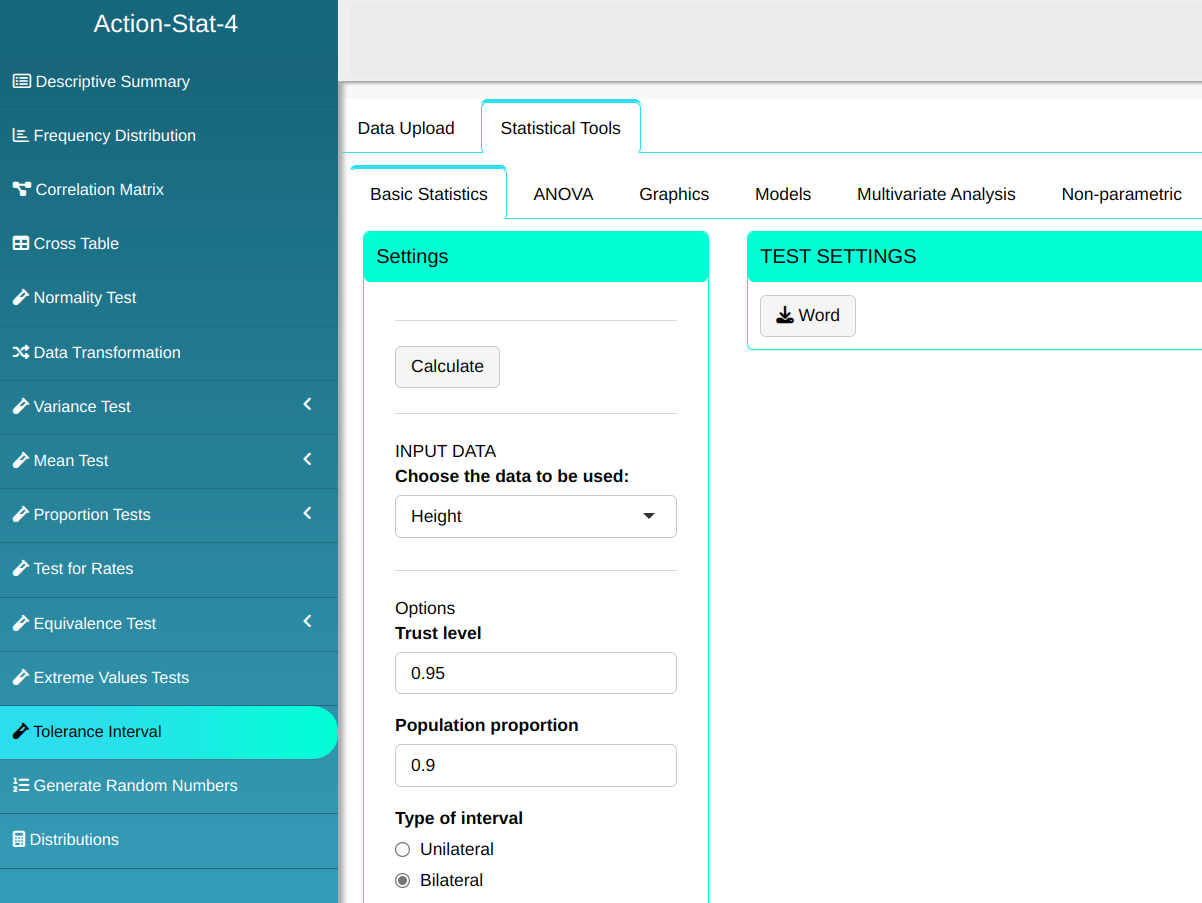
Then click Calculate to get the results. You can also generate the analyses and download them in Word format.
The results are as follows:
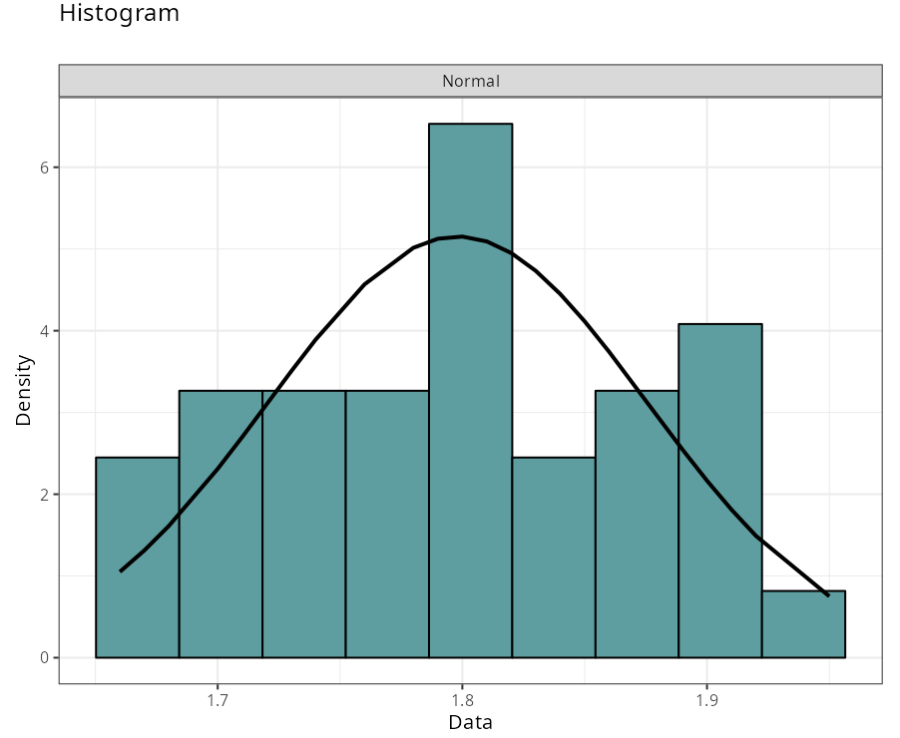
| Adjusted Distribution | ||
| $\quad \qquad$Normal |
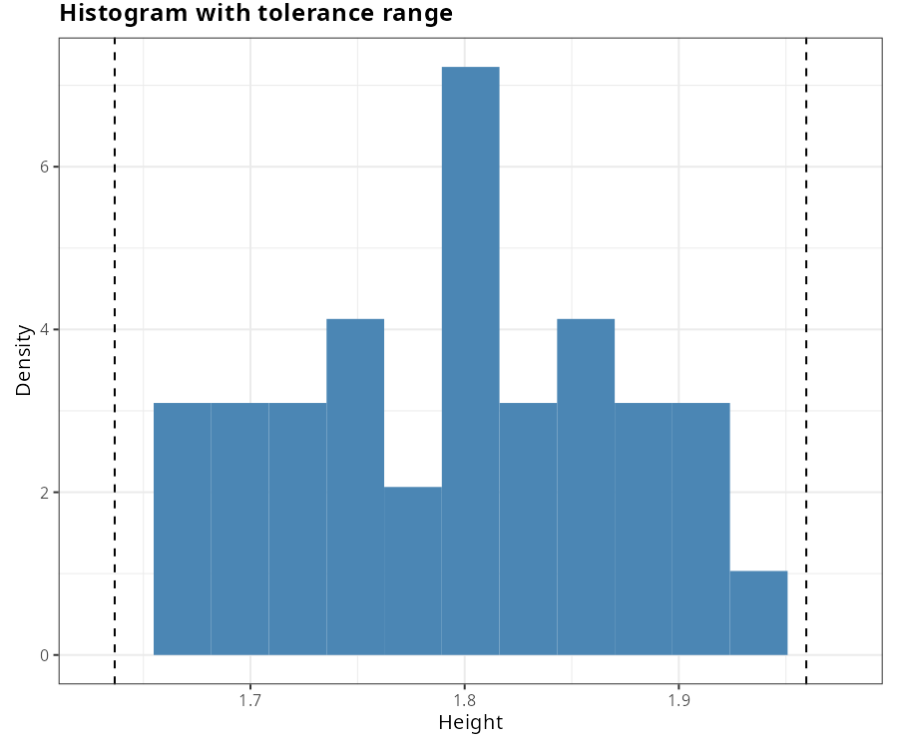
Tolerance Interval
| Significance Level | Population Proportion | Lower Limit | Upper Limit |
|---|---|---|---|
| 0.05 | 0.900 | 1,637 | 1,959 |
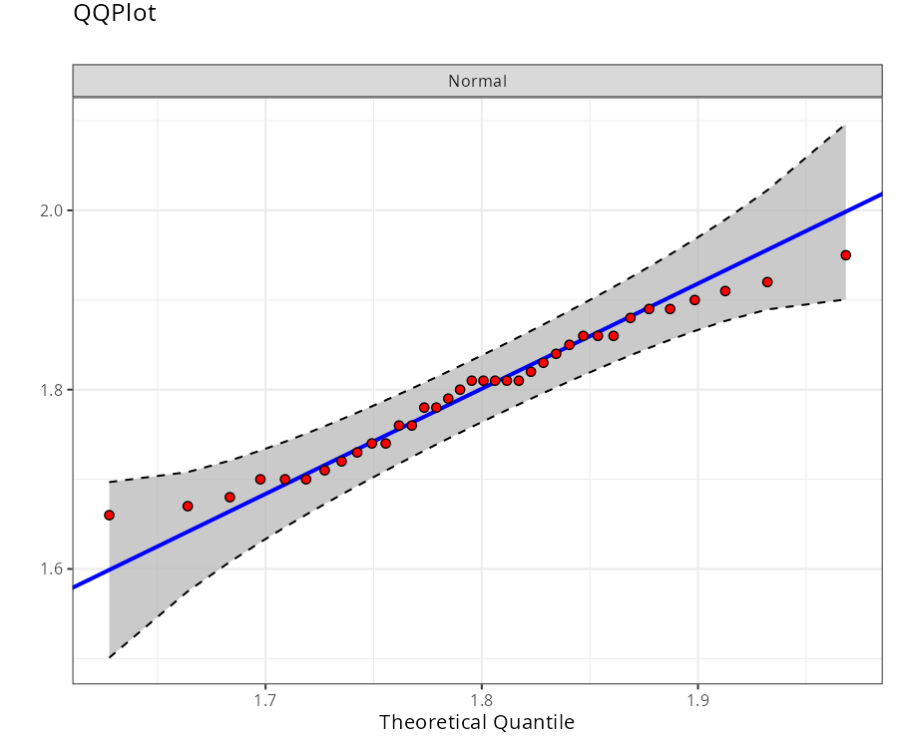
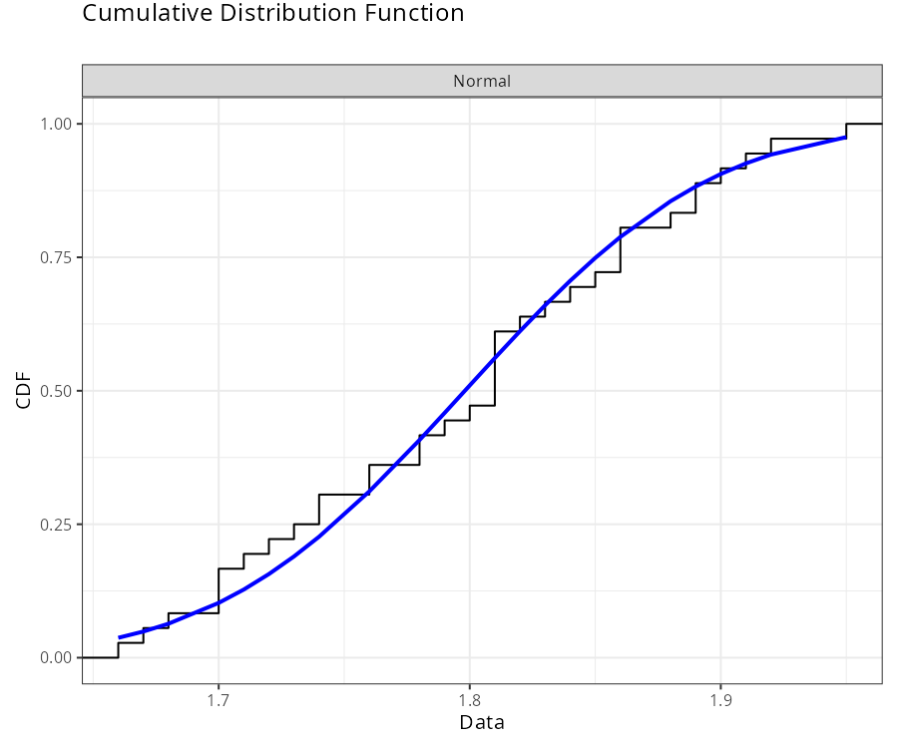
Anderson-Darling
| Distributions | Statistics | P-Value |
|---|---|---|
| Normal ($ \mu = 1.8, \quad \sigma = 0.077$) | 0.291 | 0.589 |