3. Correlation Matrix
The Correlation Matrix allows simultaneous analysis of the association between variables, using Pearson, Spearman or Kendall.
Details:
The Correlation Matrix tool allows you to calculate the correlation between variables using Pearson, Spearman or Kendall coefficients. The chart option allows you to generate a scatterplot matrix.
Example:
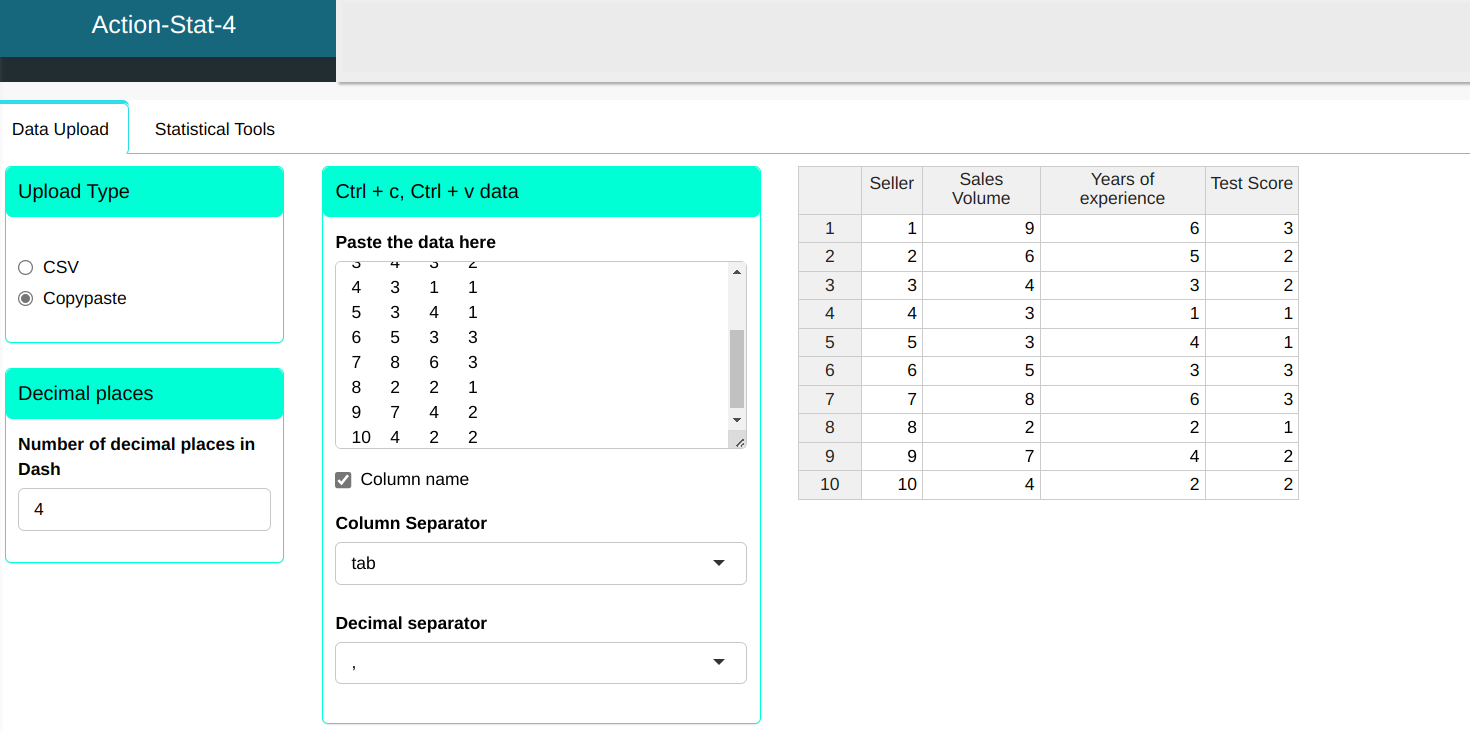
A company intends to study the relationship between sales volume made during a period of time determined by its sellers, considering your years of experience and your score on test intelligence. We will upload the data to the system.
| Seller | Sales volume | Years of experience | Test score |
|---|---|---|---|
| 1 | 9 | 6 | 3 |
| 2 | 6 | 5 | 2 |
| 3 | 4 | 3 | 2 |
| 4 | 3 | 1 | 1 |
| 5 | 3 | 4 | 1 |
| 6 | 5 | 3 | 3 |
| 7 | 8 | 6 | 3 |
| 8 | 2 | 2 | 1 |
| 9 | 7 | 4 | 2 |
| 10 | 4 | 2 | 2 |
Configuring according to the figure below for build the Correlation Matrix
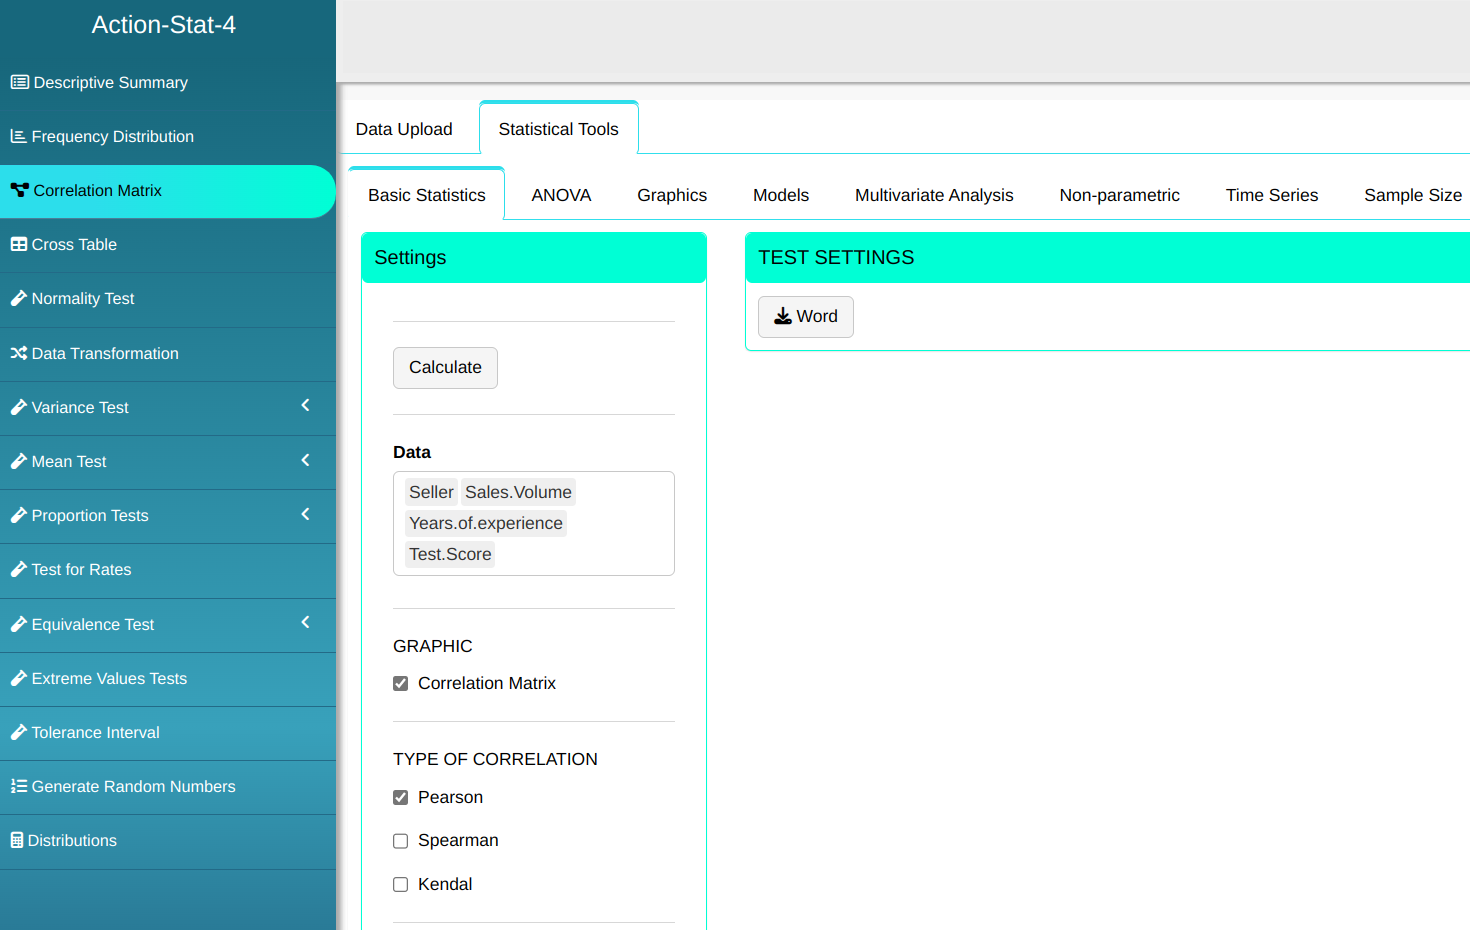

Then click Calculate to get the results. You can also generate the analyses and download them in Word format.

The results are as follows:
Correlation matrix
| Seller | Sales.Volume | Years of experience | Test score | |
|---|---|---|---|---|
| Seller | 1 | -0.244 | -0.364 | -0.135 |
| Sales volume | -0.244 | 1 | 0.846 | 0.817 |
| Years of experience | -0.364 | 0.846 | 1 | 0.636 |
| Test score | -0.135 | 0.817 | 0.636 | 1 |
P-value matrix
| Seller | Sales volume | Years of experience | Score.no.test | |
|---|---|---|---|---|
| Seller | 1 | 0.497 | 0.301 | 0.710 |
| Sales Volume | 0.497 | 1 | 0.002 | 0.004 |
| Years of experience | 0.301 | 0.002 | 1 | 0.048 |
| Test Score | 0.710 | 0.004 | 0.048 | 1 |
We see, initially, that the positive correlation (0.846) between the volume of sales and years of experience are significant (proven by the p-value of 0.0020), lower than the adopted significance level of 5%. Same There is a significant association between sales volume and score in the intelligence test and between the years of experience and the score.
The p value is less than or equal to the predetermined $\alpha$ significance level, this means that there is a significant correlation between the variables. Otherwise, there is no association between them.
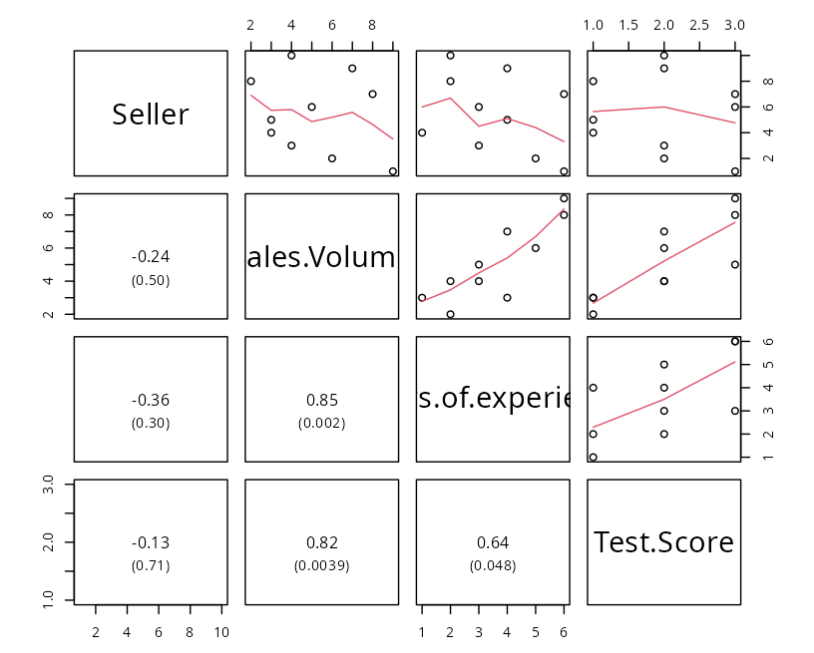
Complementing the previous table, through the matrix we see that the three The variables under study have a linear association with each other, which is remains positive. Thus, as an example, according to years of experience of the seller increases, his sales volume also tends to be greater. Regarding other associations, the interpretation will be similar.
Complementing the table above, we can see from the matrix that the three variables under study have a linear association with each other. positive. For example, as a salesperson’s years of experience increase, their sales volume also tends to increase. The interpretation of the other associations is similar.
We also have the dendrogram: