4. The Cross Table
The Cross Table is a basic and simple way to analyze data. Many cross-tabulations are often equivalent to a three-dimensional bar chart, which shows total sums and occurrences.
Details:
The Cross Table tool has options for testing independence test (chi-square, measures of association) and homogeneity test (Fisher Mcnemar chi-square)..
Example 1:
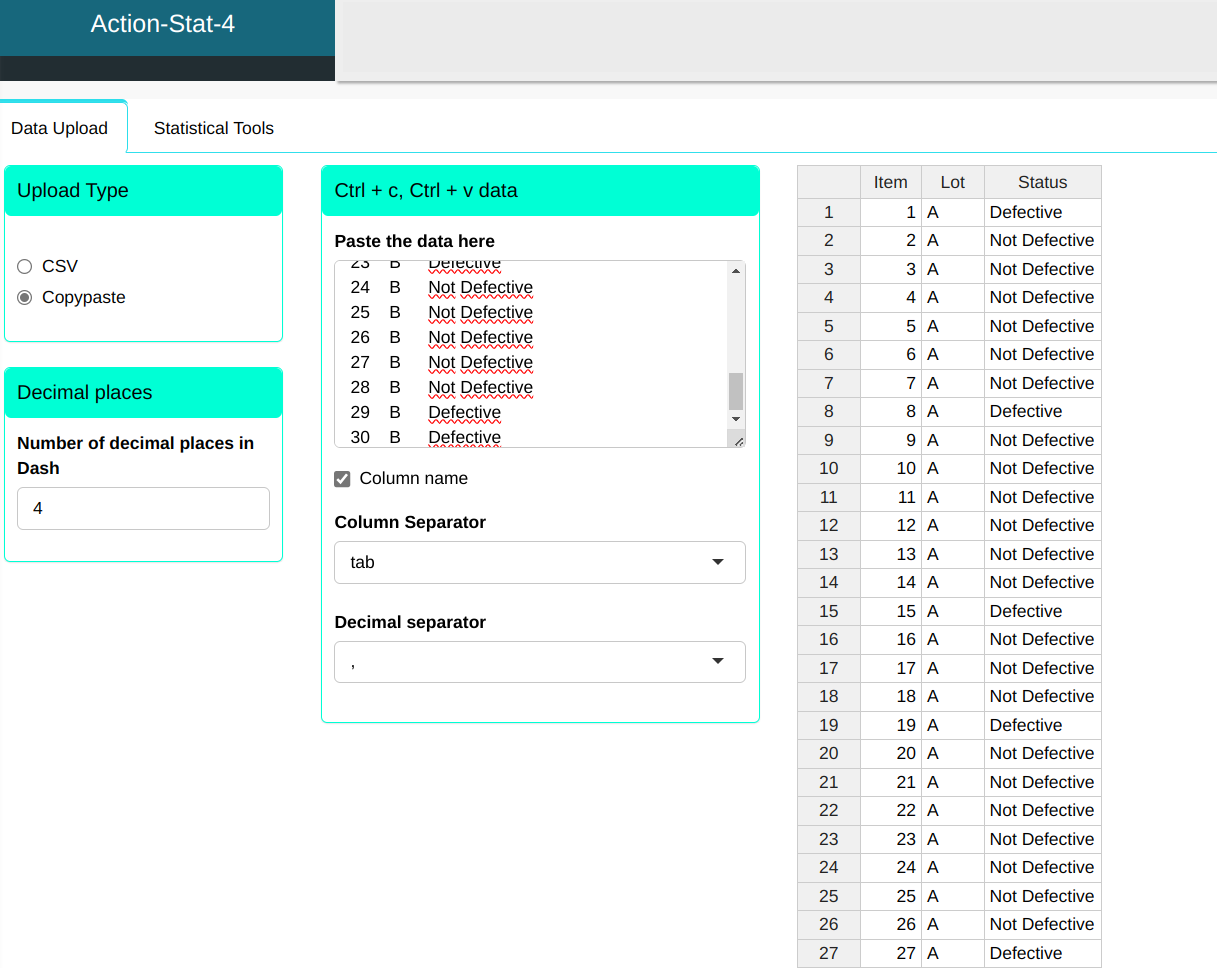
Two batches (A and B) of manufactured items were randomly sampled to determine whether the proportion of defective items is different for the two batches. The data is described below
| Item | Lot | Status |
|---|---|---|
| 1 | A | Defective |
| 2 | A | Not Defective |
| 3 | A | Not Defective |
| 4 | A | Not Defective |
| 5 | A | Not Defective |
| 6 | A | Not Defective |
| 7 | A | Not Defective |
| 8 | A | Defective |
| 9 | A | Not Defective |
| 10 | A | Not Defective |
| 11 | A | Not Defective |
| 12 | A | Not Defective |
| 13 | A | Not Defective |
| 14 | A | Not Defective |
| 15 | A | Defective |
| 16 | A | Not Defective |
| 17 | A | Not Defective |
| 18 | A | Not Defective |
| 19 | A | Defective |
| 20 | A | Not Defective |
| 21 | A | Not Defective |
| 22 | A | Not Defective |
| 23 | A | Not Defective |
| 24 | A | Not Defective |
| 25 | A | Not Defective |
| 26 | A | Not Defective |
| 27 | A | Defective |
| 28 | A | Not Defective |
| 29 | A | Not Defective |
| 30 | A | Not Defective |
| 1 | B | Not Defective |
| 2 | B | Defective |
| 3 | B | Not Defective |
| 4 | B | Not Defective |
| 5 | B | Not Defective |
| 6 | B | Not Defective |
| 7 | B | Not Defective |
| 8 | B | Not Defective |
| 9 | B | Defective |
| 10 | B | Not Defective |
| 11 | B | Not Defective |
| 12 | B | Not Defective |
| 13 | B | Not Defective |
| 14 | B | Defective |
| 15 | B | Defective |
| 16 | B | Not Defective |
| 17 | B | Not Defective |
| 18 | B | Not Defective |
| 19 | B | Not Defective |
| 20 | B | Not Defective |
| 21 | B | Not Defective |
| 22 | B | Not Defective |
| 23 | B | Defective |
| 24 | B | Not Defective |
| 25 | B | Not Defective |
| 26 | B | Not Defective |
| 27 | B | Not Defective |
| 28 | B | Not Defective |
| 29 | B | Defective |
| 30 | B | Defective |
We will then upload the data into the system.
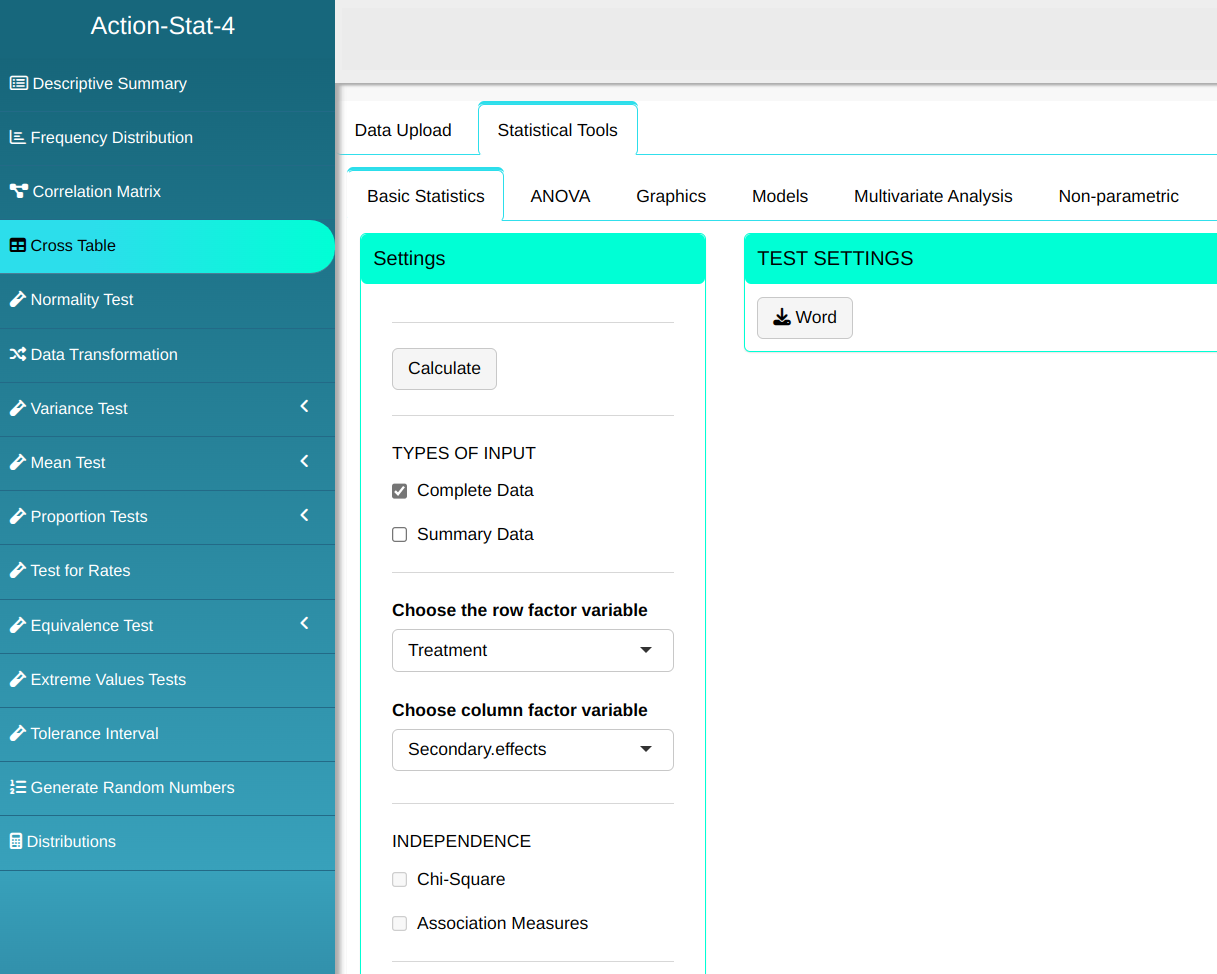
Setting up as shown in the figure below to make the Cross Table.
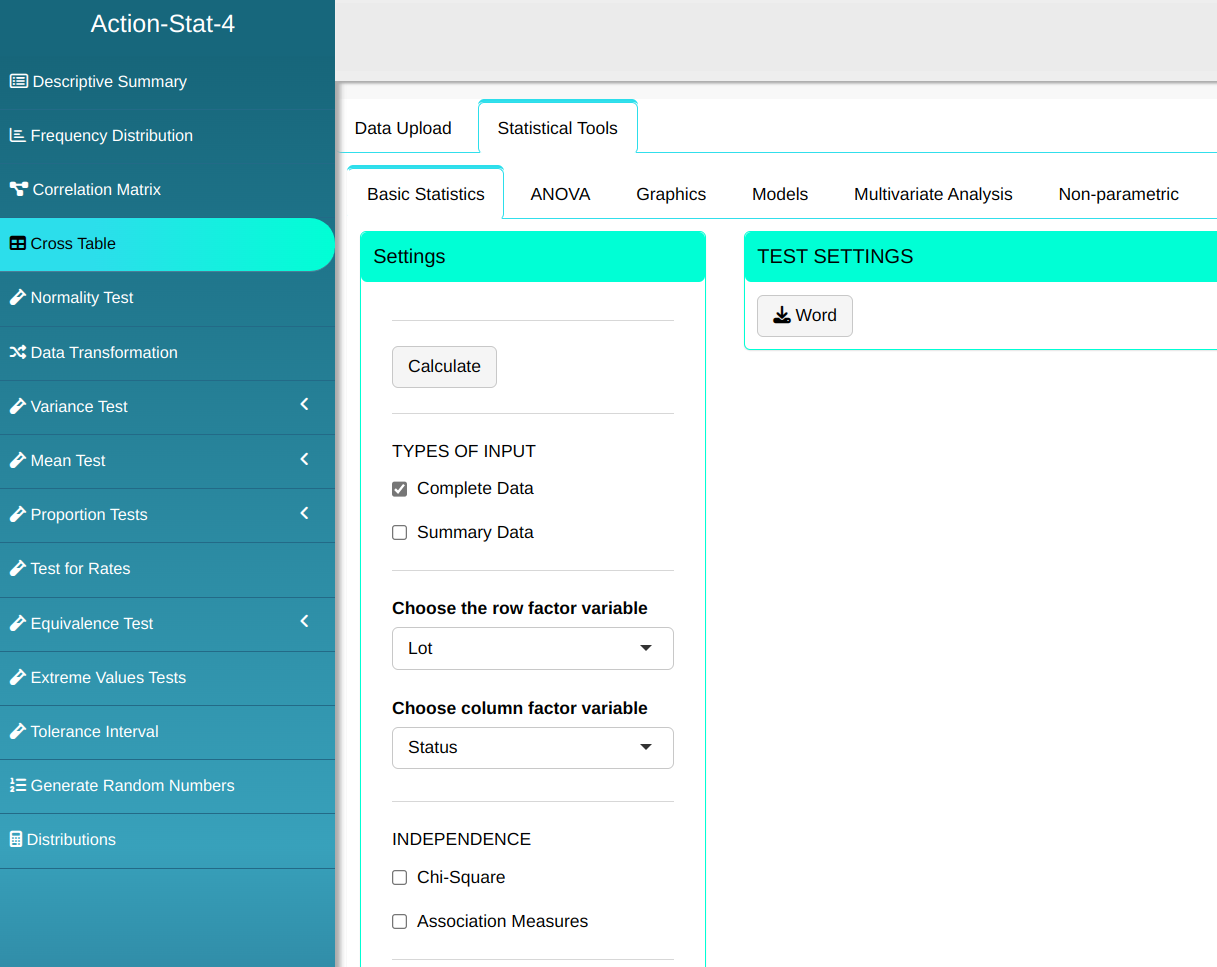
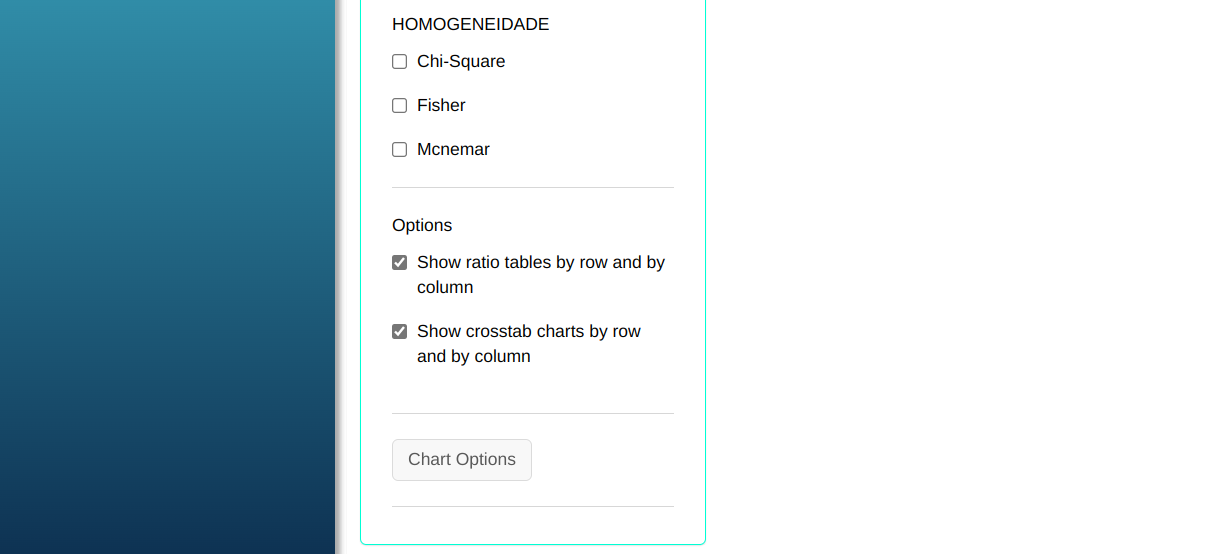
Then click Calculate to get the results. You can also generate the analyses and download them in Word format.
The results are as follows:
Cross Table
| Defective | Not.Defective | Total | |
|---|---|---|---|
| A | 5 | 25 | 30 |
| B | 7 | 23 | 30 |
| Total | 12 | 48 | 60 |
Table Proportion
| Defective | Not Defective | |
|---|---|---|
| A | 0.083 | 0.417 |
| B | 0.117 | 0.383 |
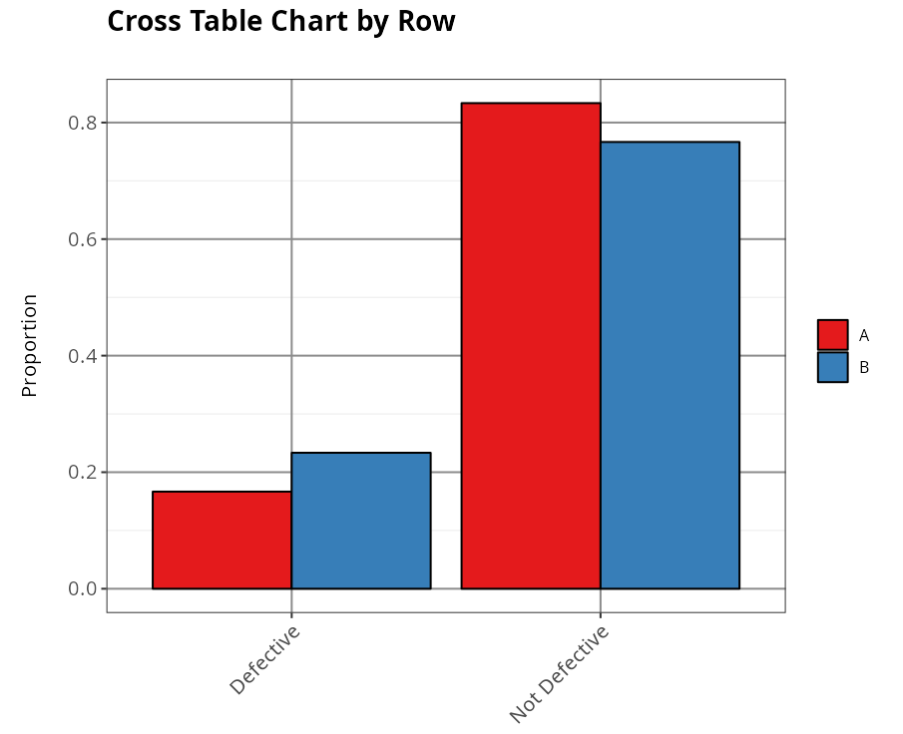
Proportion per Line
| Defective | Not Defective | |
|---|---|---|
| A | 0.167 | 0.833 |
| B | 0.233 | 0.767 |
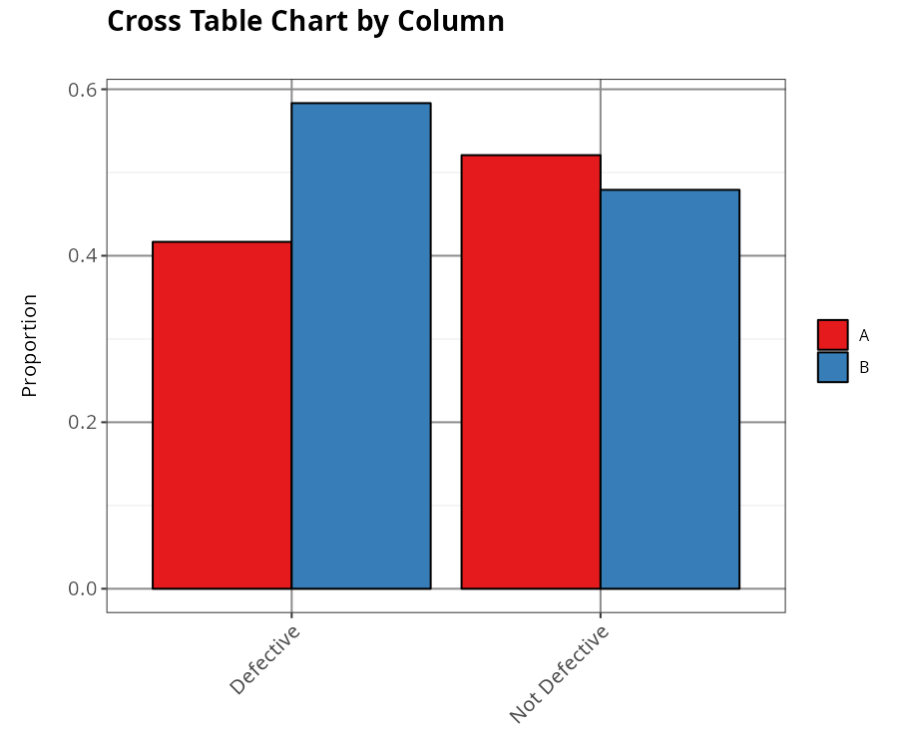
Proportion by Column
| Defective | Not Defective | |
|---|---|---|
| A | 0.417 | 0.521 |
| B | 0.583 | 0.479 |
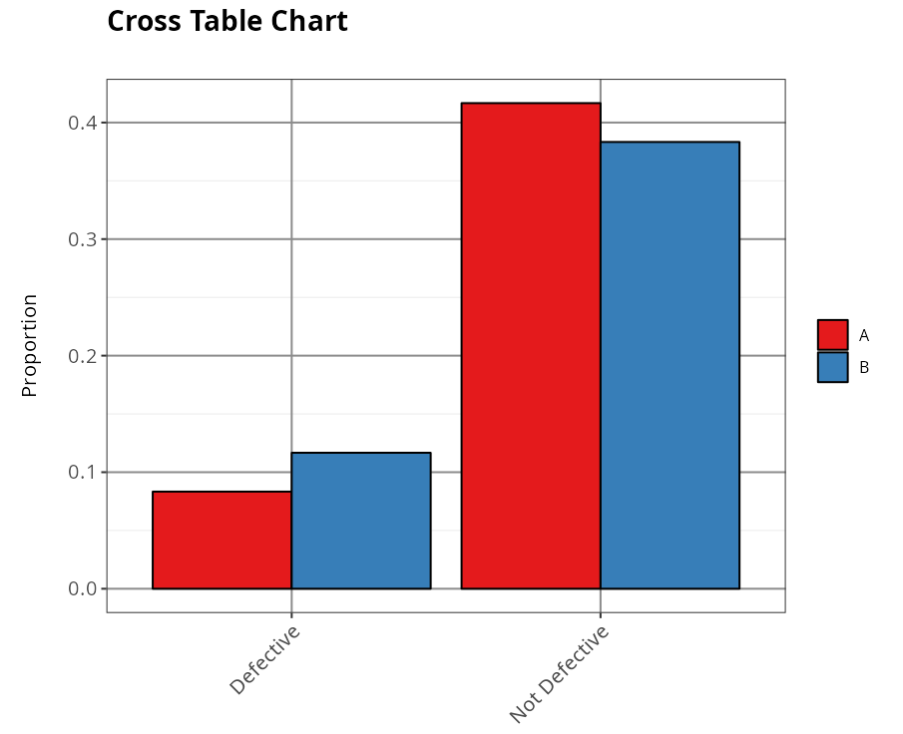
The tables below show the absolute and percentage occurrences of the cases studied. They show that 58.33% of all defective items (12 overall) are in the first batch (B), with A accounting for 41.67%. This difference does not appear to be significant, since the two percentages are relatively close.
Example 2:
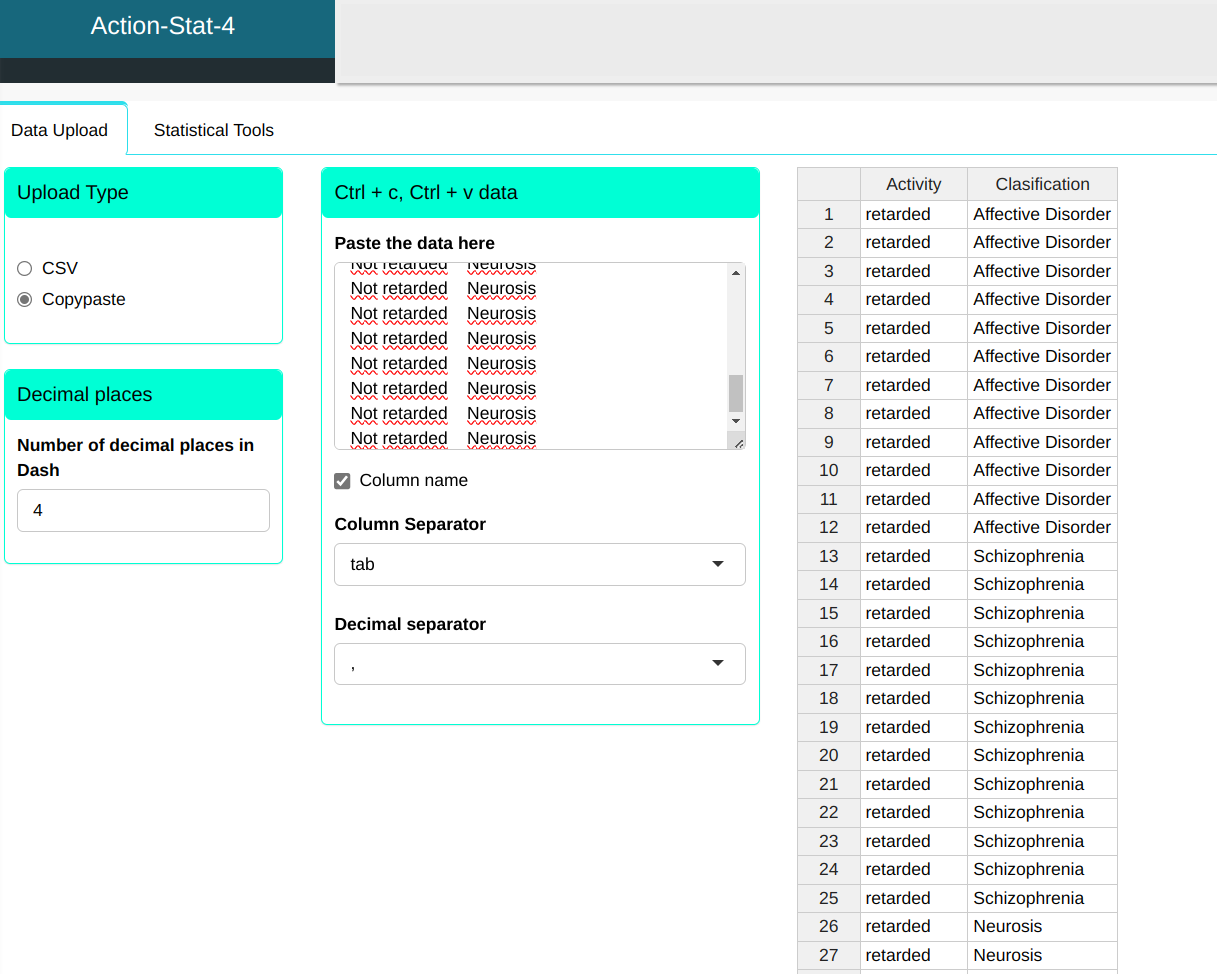
Let’s consider the following classification of the activity (in "retarded" and "non-retarded") of 90 psychiatric patients (classified as "with affective disorders", "schizophrenics" and "neurotics").
| Activity | Clasification |
|---|---|
| retarded | Affective Disorder |
| retarded | Affective Disorder |
| retarded | Affective Disorder |
| retarded | Affective Disorder |
| retarded | Affective Disorder |
| retarded | Affective Disorder |
| retarded | Affective Disorder |
| retarded | Affective Disorder |
| retarded | Affective Disorder |
| retarded | Affective Disorder |
| retarded | Affective Disorder |
| retarded | Affective Disorder |
| retarded | Schizophrenia |
| retarded | Schizophrenia |
| retarded | Schizophrenia |
| retarded | Schizophrenia |
| retarded | Schizophrenia |
| retarded | Schizophrenia |
| retarded | Schizophrenia |
| retarded | Schizophrenia |
| retarded | Schizophrenia |
| retarded | Schizophrenia |
| retarded | Schizophrenia |
| retarded | Schizophrenia |
| retarded | Schizophrenia |
| retarded | Neurosis |
| retarded | Neurosis |
| retarded | Neurosis |
| retarded | Neurosis |
| retarded | Neurosis |
| Not retarded | Affective Disorder |
| Not retarded | Affective Disorder |
| Not retarded | Affective Disorder |
| Not retarded | Affective Disorder |
| Not retarded | Affective Disorder |
| Not retarded | Affective Disorder |
| Not retarded | Affective Disorder |
| Not retarded | Affective Disorder |
| Not retarded | Affective Disorder |
| Not retarded | Affective Disorder |
| Not retarded | Affective Disorder |
| Not retarded | Affective Disorder |
| Not retarded | Affective Disorder |
| Not retarded | Affective Disorder |
| Not retarded | Affective Disorder |
| Not retarded | Affective Disorder |
| Not retarded | Affective Disorder |
| Not retarded | Affective Disorder |
| Not retarded | Schizophrenia |
| Not retarded | Schizophrenia |
| Not retarded | Schizophrenia |
| Not retarded | Schizophrenia |
| Not retarded | Schizophrenia |
| Not retarded | Schizophrenia |
| Not retarded | Schizophrenia |
| Not retarded | Schizophrenia |
| Not retarded | Schizophrenia |
| Not retarded | Schizophrenia |
| Not retarded | Schizophrenia |
| Not retarded | Schizophrenia |
| Not retarded | Schizophrenia |
| Not retarded | Schizophrenia |
| Not retarded | Schizophrenia |
| Not retarded | Schizophrenia |
| Not retarded | Schizophrenia |
| Not retarded | Neurosis |
| Not retarded | Neurosis |
| Not retarded | Neurosis |
| Not retarded | Neurosis |
| Not retarded | Neurosis |
| Not retarded | Neurosis |
| Not retarded | Neurosis |
| Not retarded | Neurosis |
| Not retarded | Neurosis |
| Not retarded | Neurosis |
| Not retarded | Neurosis |
| Not retarded | Neurosis |
| Not retarded | Neurosis |
| Not retarded | Neurosis |
| Not retarded | Neurosis |
| Not retarded | Neurosis |
| Not retarded | Neurosis |
| Not retarded | Neurosis |
| Not retarded | Neurosis |
| Not retarded | Neurosis |
| Not retarded | Neurosis |
| Not retarded | Neurosis |
| Not retarded | Neurosis |
| Not retarded | Neurosis |
| Not retarded | Neurosis |
Faremos então, o upload dos dados no sistema.
Ultilizaremos então a ferramenta Tabela Cruzada
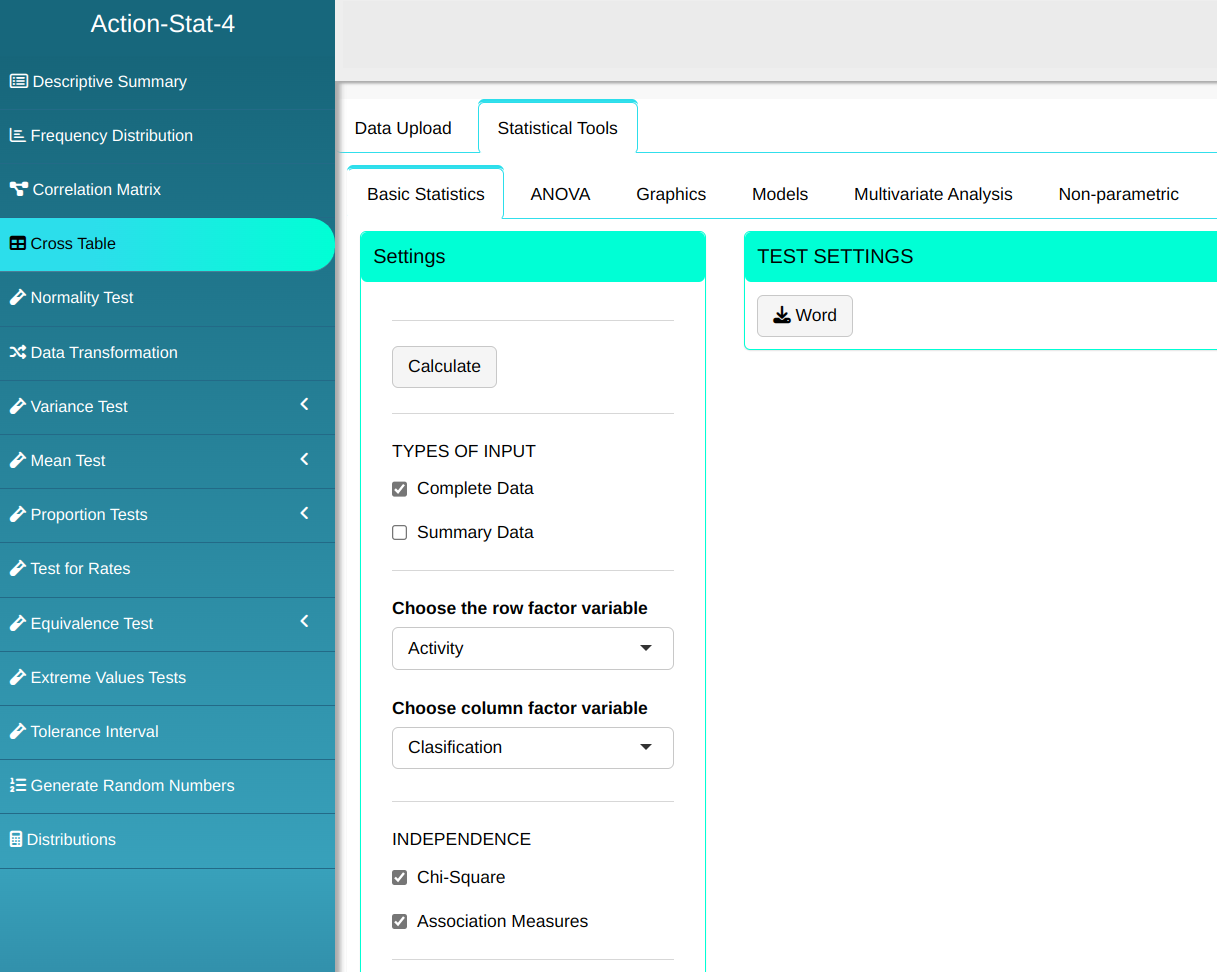
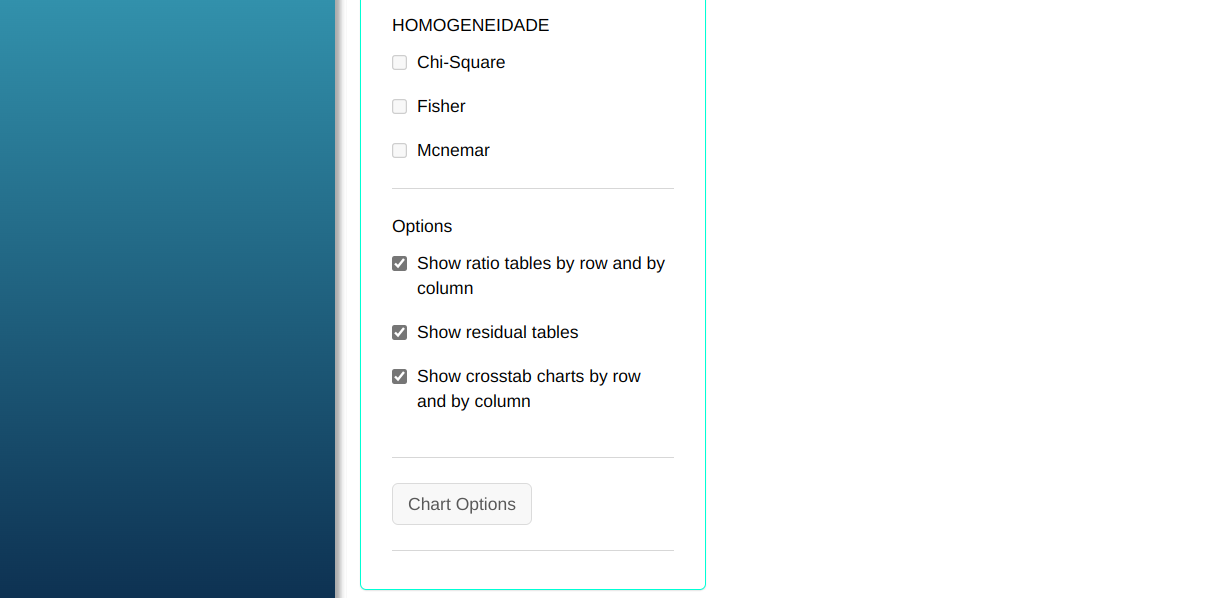
Clicando em Calcular, obtemos os resultados.
The results are as follows:
Cross Table
| Affective.Disorder | Neurosis | Schizophenia | Total | |
|---|---|---|---|---|
| Not Retarded | 18 | 25 | 17 | 60 |
| Retarded | 12 | 5 | 13 | 30 |
| Total | 30 | 30 | 30 | 90 |
Table Proportion
| Afective.Dosorder | Neurosis | Schizophrenia | |
|---|---|---|---|
| Not Retarded | 0.200 | 0.278 | 0.189 |
| Retarded | 0.133 | 0.056 | 0.144 |
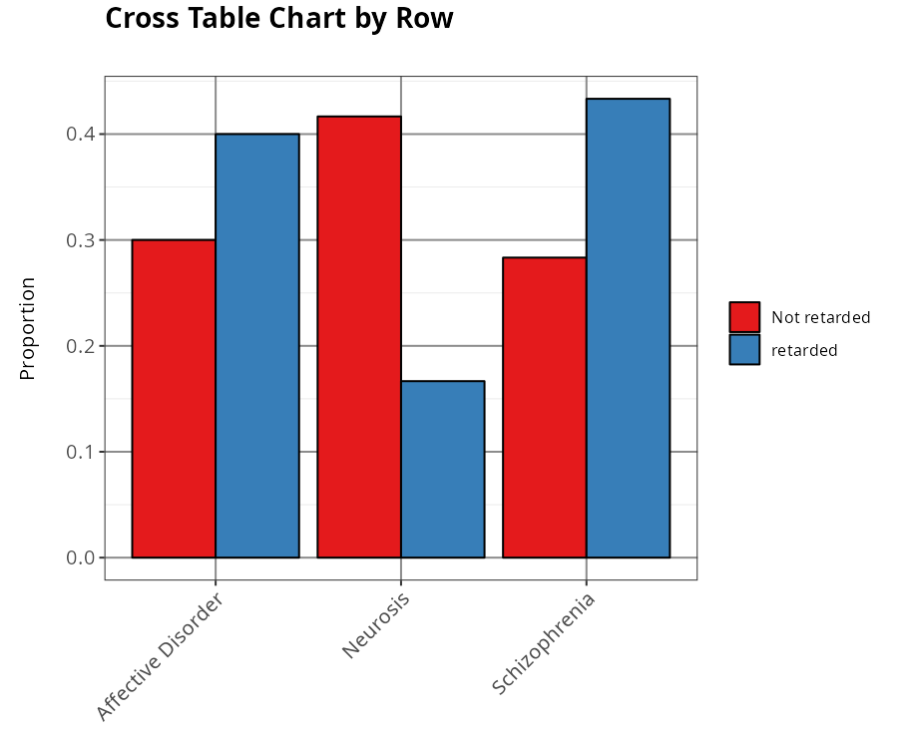
Proportion per Line
| Affective Disorder | Neurosis | Schizophenia | |
|---|---|---|---|
| Not Retarded | 0.3 | 0.417 | 0.283 |
| Retarded | 0.4 | 0.167 | 0.433 |
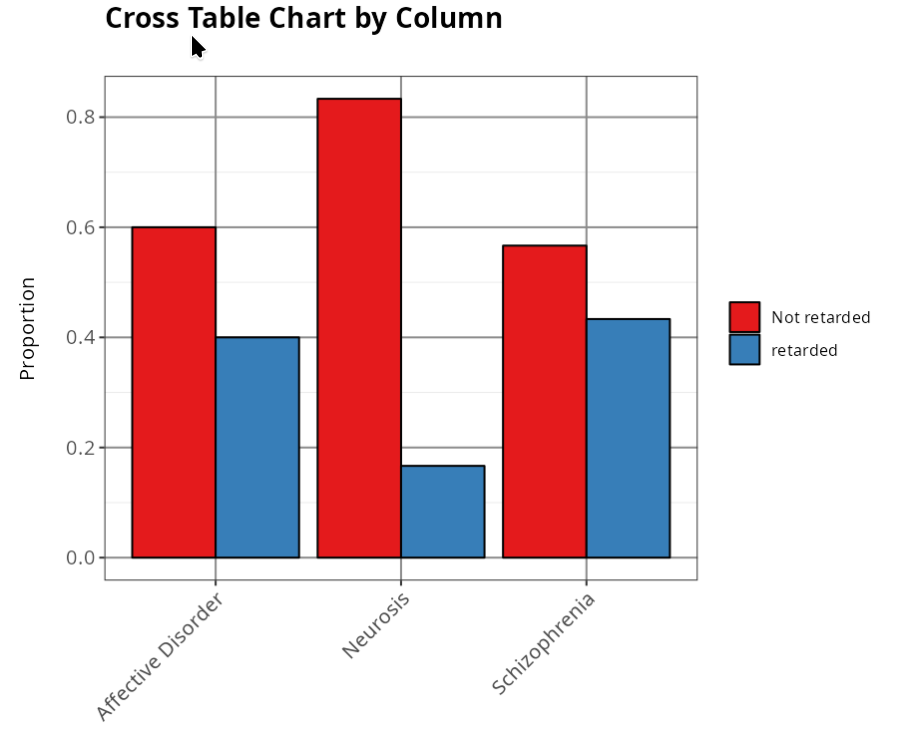
Proportion by Column
| Affective Disorder | Neurosis | Schizophenia | |
|---|---|---|---|
| Not Retarded | 0.6 | 0.833 | 0.567 |
| Retarded | 0.4 | 0.167 | 0.433 |
Chi-Squared Test
| Values | |
|---|---|
| X² statistic | 5.700 |
| Degrees of Freedom | 2.000 |
| P-Valor | 0.058 |
Chi-Square Expected Values
| Affective Disorder | Neurosis | Schizophenia | |
|---|---|---|---|
| Not Retarded | 20 | 20 | 20 |
| Retarded | 10 | 10 | 10 |
Chi-Square Standardizes values
| Affective Disorder | Neurosis | Schizophenia | |
|---|---|---|---|
| Not Retarded | 0.2 | 1.25 | 0.45 |
| Retarded | 0.4 | 2.50 | 0.90 |
Measures of Association
| Valores | |
|---|---|
| Mean Squared Contingency coefficient | 0.063 |
| Contingency coefficient | 0.244 |
| Tschuprov`s coefficient | 0.212 |
| Cramer’s Coefficient de ramer | 0.063 |
Chi-Squared Residuals
| Affective Disorder | Neurosis | Schizophenia | |
|---|---|---|---|
| Not Retarded | -0.447 | 1.118 | -0.671 |
| Retarded | 0.632 | -1.581 | 0.949 |
Standardized Chi-Squared Residuals
| Affective Disorder | Neurosis | Schizophenia | |
|---|---|---|---|
| Not Retarded | -0.949 | 2.372 | -1.423 |
| Retarded | 10.949 | -2.372 | 1.423 |
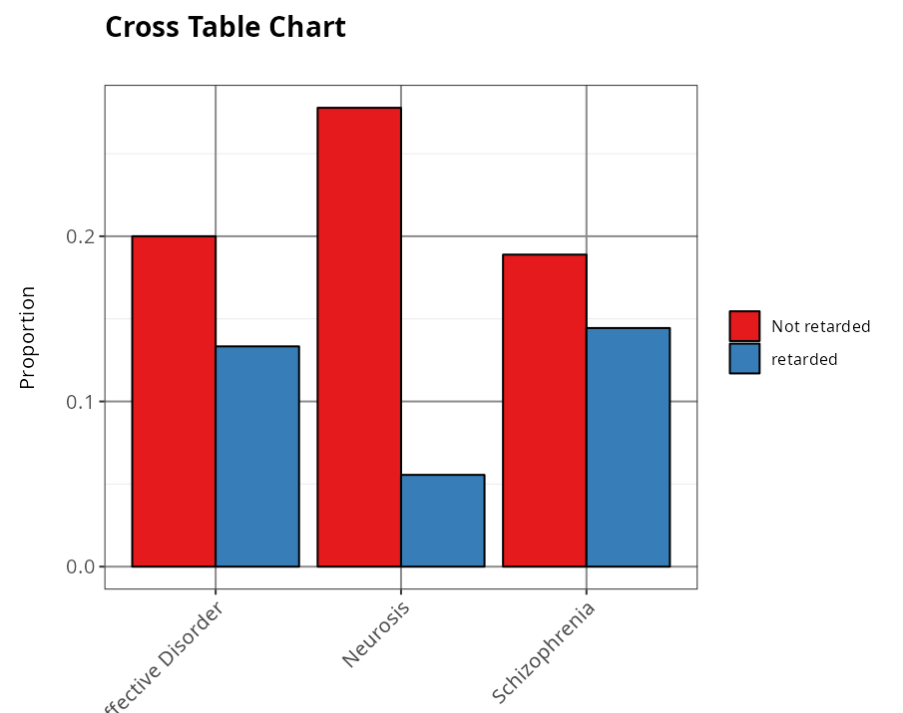
If we want to test whether the type of activity is not influenced by the type of psychiatric disorder, then we should estimate the expected frequencies and after calculating the test statistic, we get Chi-Square=5.7 and p-value=0.058, so we don’t reject the null hypothesis. We therefore conclude that there is no dependence between the type of activity and the type of psychiatric disorder, with a significance level of 5%.
Example 3:
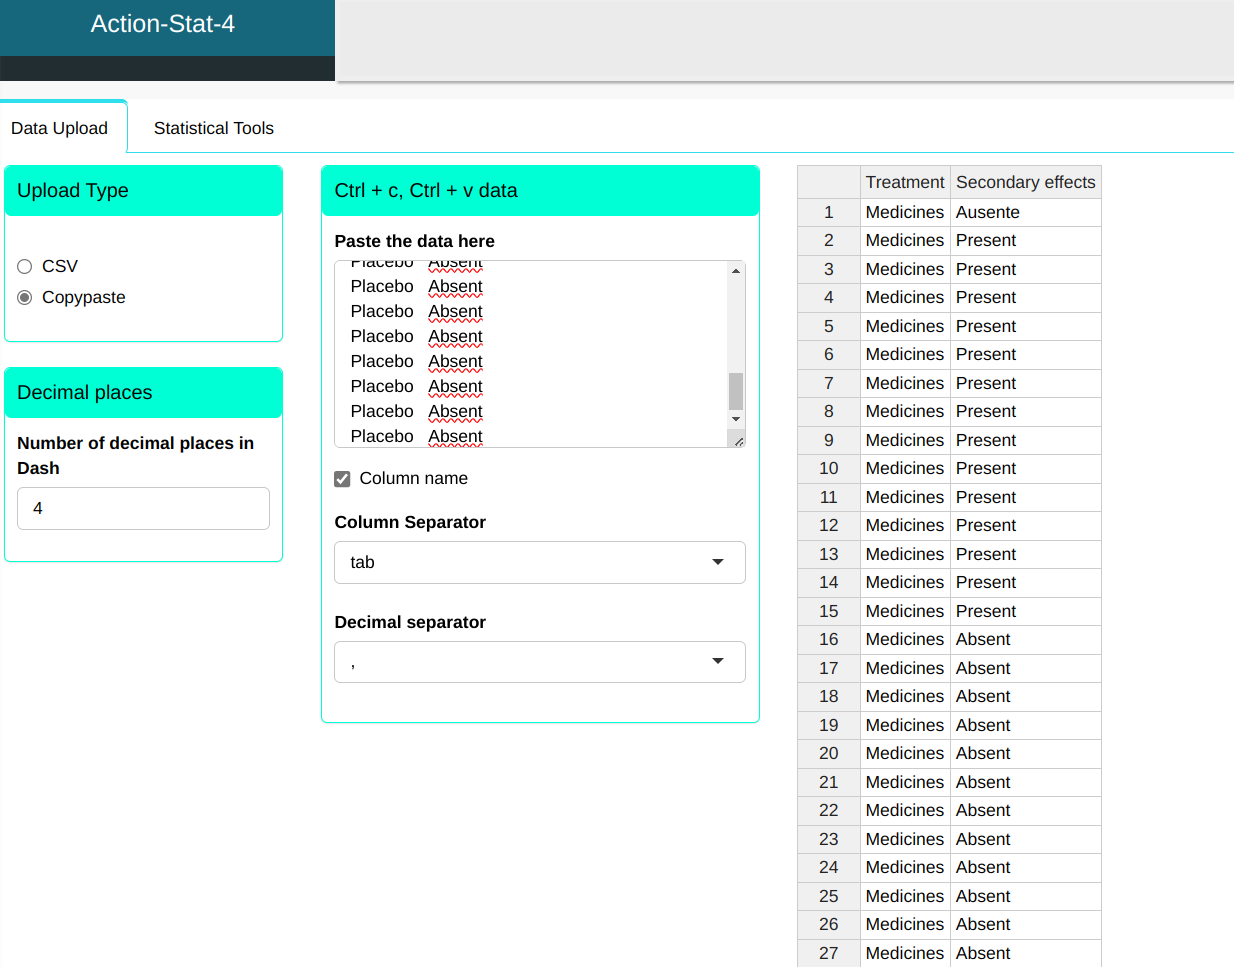
We looked at the data collected in a study on the side effects caused by a drug. To carry out this study, we used the drug on 50 patients, and used another 50 patients as a control group, administering a placebo.
| Treatment | Secundary effects |
|---|---|
| Medicines | Ausente |
| Medicines | Present |
| Medicines | Present |
| Medicines | Present |
| Medicines | Present |
| Medicines | Present |
| Medicines | Present |
| Medicines | Present |
| Medicines | Present |
| Medicines | Present |
| Medicines | Present |
| Medicines | Present |
| Medicines | Present |
| Medicines | Present |
| Medicines | Present |
| Medicines | Absent |
| Medicines | Absent |
| Medicines | Absent |
| Medicines | Absent |
| Medicines | Absent |
| Medicines | Absent |
| Medicines | Absent |
| Medicines | Absent |
| Medicines | Absent |
| Medicines | Absent |
| Medicines | Absent |
| Medicines | Absent |
| Medicines | Absent |
| Medicines | Absent |
| Medicines | Absent |
| Medicines | Absent |
| Medicines | Absent |
| Medicines | Absent |
| Medicines | Absent |
| Medicines | Absent |
| Medicines | Absent |
| Medicines | Absent |
| Medicines | Absent |
| Medicines | Absent |
| Medicines | Absent |
| Medicines | Absent |
| Medicines | Absent |
| Medicines | Absent |
| Medicines | Absent |
| Medicines | Absent |
| Medicines | Absent |
| Medicines | Absent |
| Medicines | Absent |
| Medicines | Absent |
| Medicines | Absent |
| Placebo | Present |
| Placebo | Present |
| Placebo | Present |
| Placebo | Present |
| Placebo | Absent |
| Placebo | Absent |
| Placebo | Absent |
| Placebo | Absent |
| Placebo | Absent |
| Placebo | Absent |
| Placebo | Absent |
| Placebo | Absent |
| Placebo | Absent |
| Placebo | Absent |
| Placebo | Absent |
| Placebo | Absent |
| Placebo | Absent |
| Placebo | Absent |
| Placebo | Absent |
| Placebo | Absent |
| Placebo | Absent |
| Placebo | Absent |
| Placebo | Absent |
| Placebo | Absent |
| Placebo | Absent |
| Placebo | Absent |
| Placebo | Absent |
| Placebo | Absent |
| Placebo | Absent |
| Placebo | Absent |
| Placebo | Absent |
| Placebo | Absent |
| Placebo | Absent |
| Placebo | Absent |
| Placebo | Absent |
| Placebo | Absent |
| Placebo | Absent |
| Placebo | Absent |
| Placebo | Absent |
| Placebo | Absent |
| Placebo | Absent |
| Placebo | Absent |
| Placebo | Absent |
| Placebo | Absent |
| Placebo | Absent |
| Placebo | Absent |
| Placebo | Absent |
| Placebo | Absent |
| Placebo | Absent |
| Placebo | Absent |
We will then upload the data into the system.
Configuring the cross table as shown below
Then click Calculate to get the results. You can also generate the analyses and download them in Word format.
The results are as follows:
Cross Table
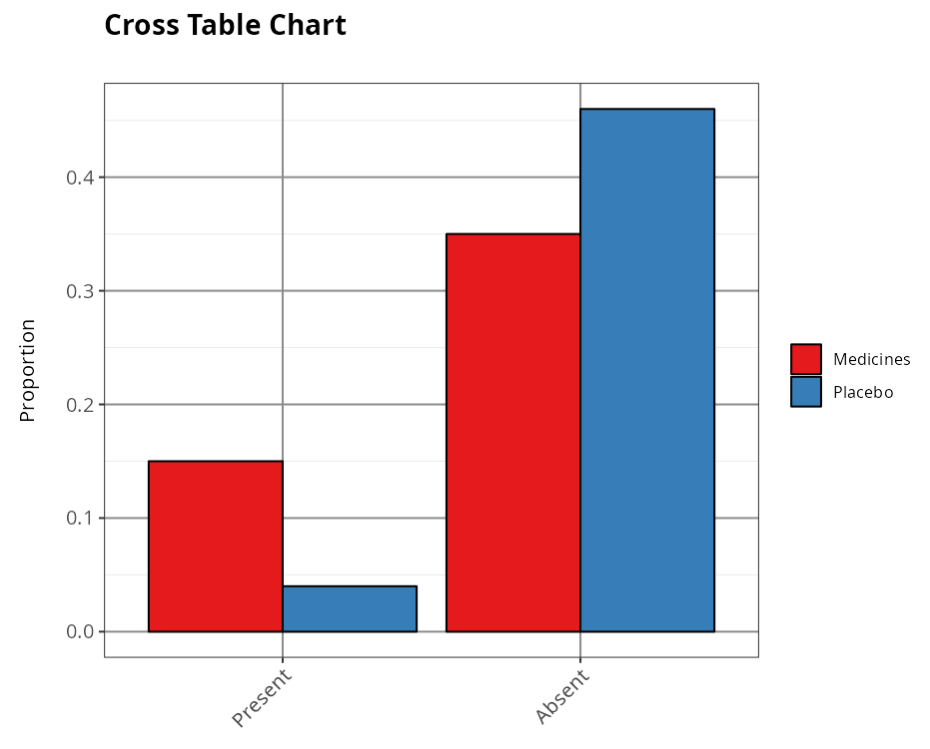
| Absent | Present | Total | |
|---|---|---|---|
| Medicines | 35 | 15 | 50 |
| Placebo | 46 | 4 | 50 |
| Total | 81 | 19 | 100 |
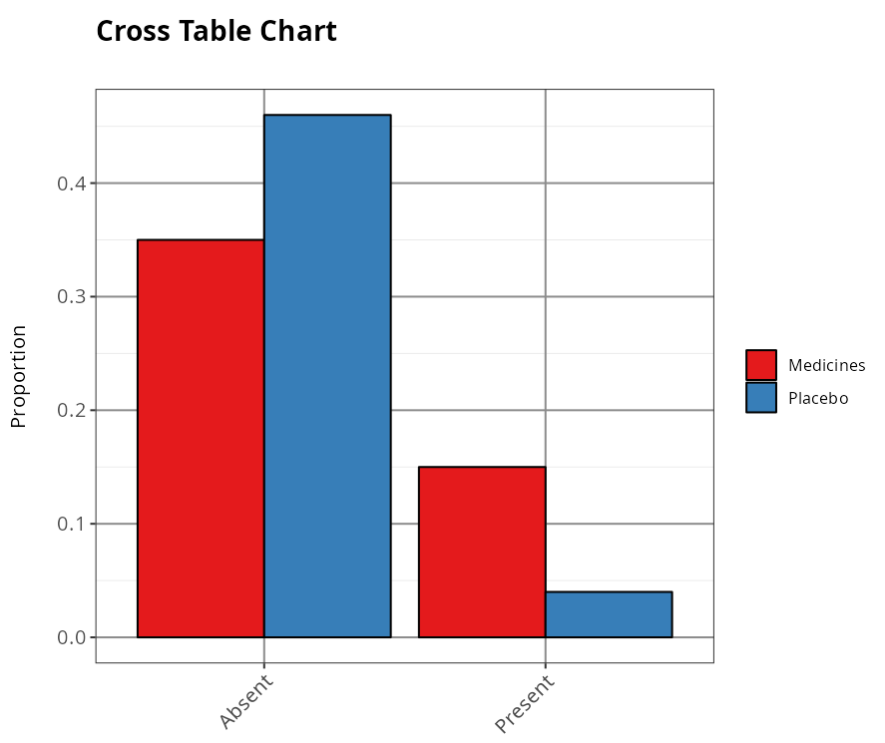
Table Proportion
| Absent | Present | |
|---|---|---|
| Medicines | 0.35 | 0.15 |
| Placebo | 0.46 | 0.04 |
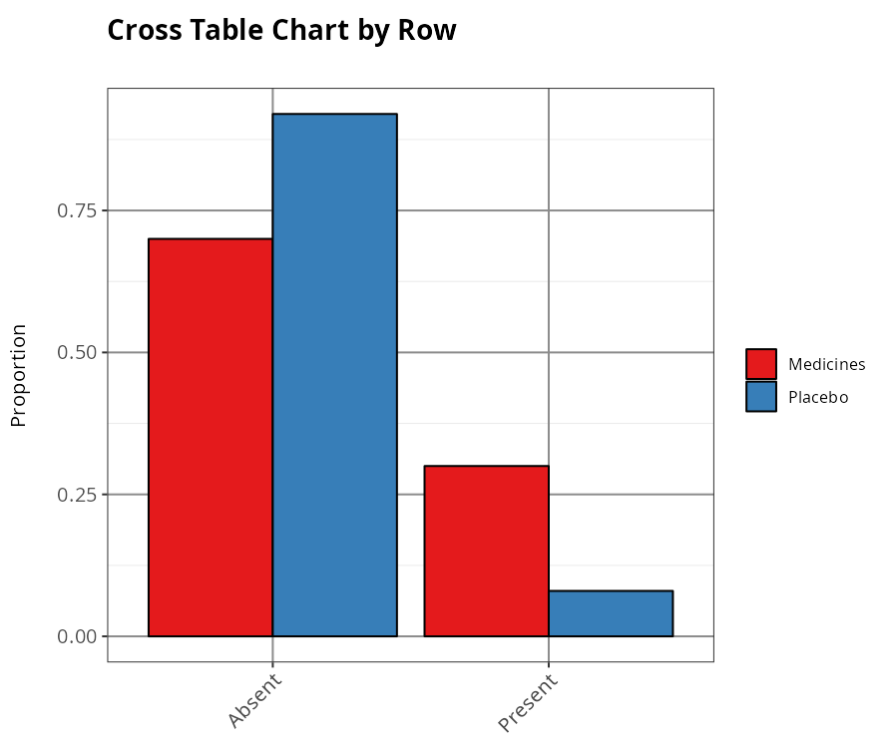
Proportion per Line
| Absent | Present | |
|---|---|---|
| Medicines | 0.70 | 0.30 |
| Placebo | 0.92 | 0.08 |
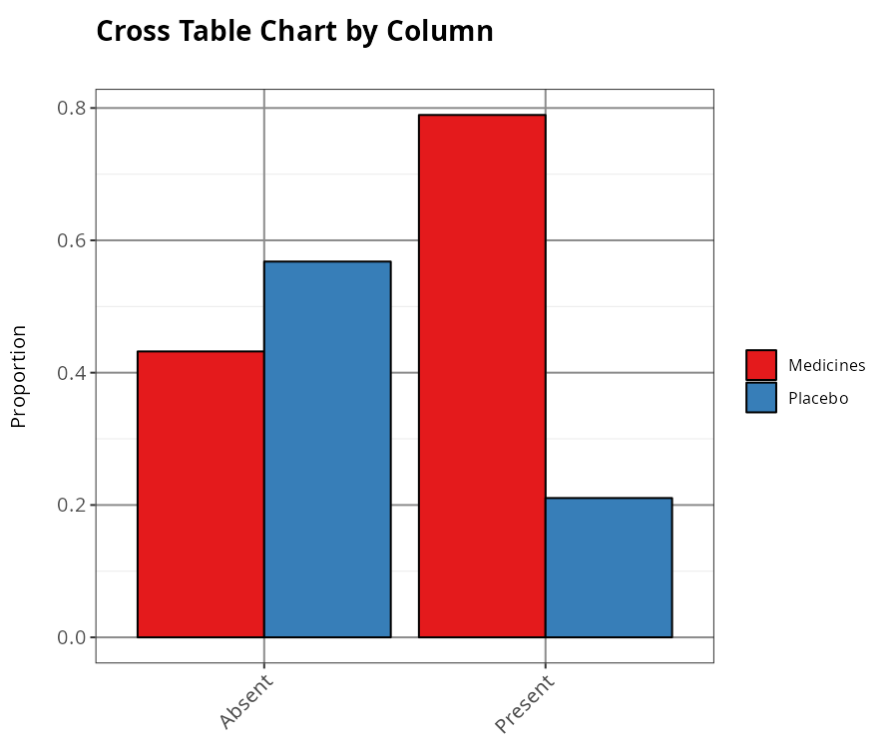
Proportion by Column
| Absent | Present | |
|---|---|---|
| Medicines | 0.4321 | 0.789 |
| Placebo | 0.5679 | 0.211 |
Chi-Squared Test (Yates correction)
| Values | |
|---|---|
| X² statistic | 6.498 |
| Degrees of Freedom | 1.000 |
| P-Value | 0.011 |
Chi-Square Expected Values
| Absent | Present | |
|---|---|---|
| Medicines | 40.5 | 9.5 |
| Placebo | 40.5 | 9.5 |
Chi-square Standardized Values
| Absent | Present | |
|---|---|---|
| Medicines | 0.747 | 3.184 |
| Placebo | 0.747 | 3.184 |
Chi-Square Residuals
| Absent | Present | ||
|---|---|---|---|
| Medicines | -0.864 | 1.784 | |
| Placebo | 0.864 | -1.784 |
Stadardized Chi-Square Residuals
| Absent | Present | |
|---|---|---|
| Medicines | -2.804 | 2.804 |
| Placebo | 2.804 | -2.804 |
Fisher’s Exact Test - Two-tailed
| Values | |
|---|---|
| Odds ratio estimate | 0.206 |
| P-Value | 0.009 |
Example 4:
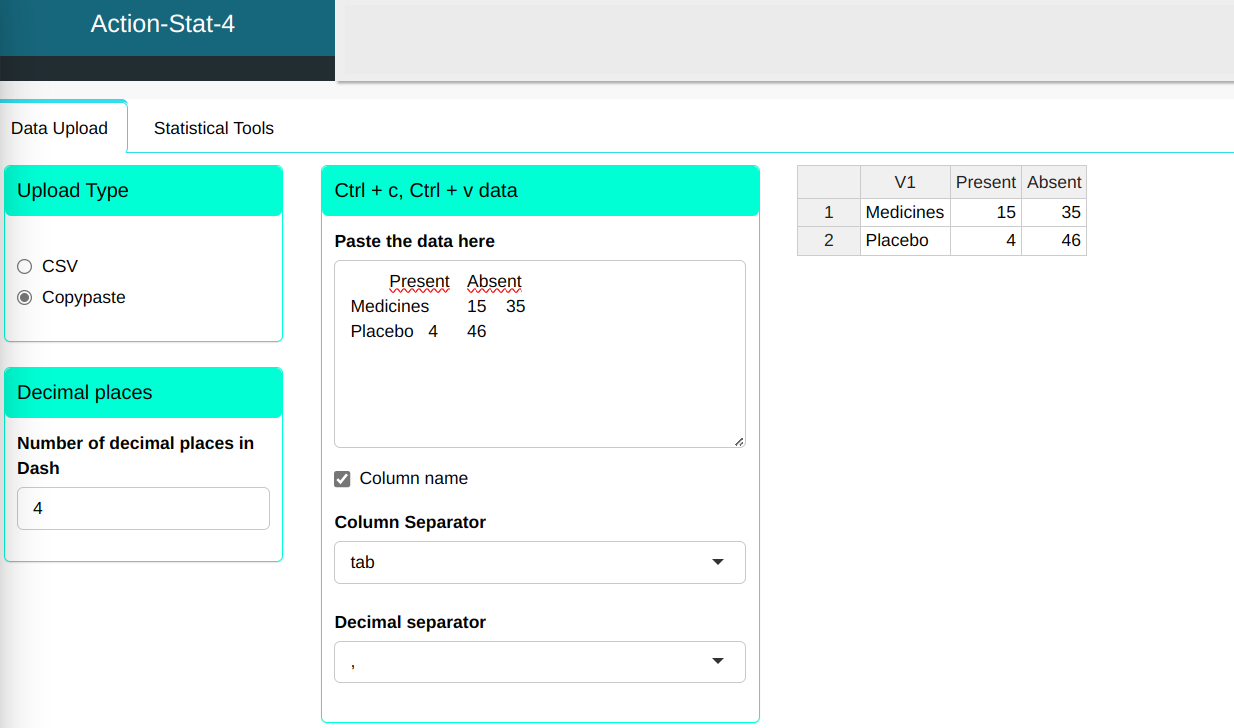
Analyze the data in summary form in a study on the side effects caused by a drug. To carry out this study, we used the drug in 50 patients and treated another 50 patients as a control group, administering a placebo.
| Present | Absent | |
|---|---|---|
| Medicines | 15 | 35 |
| Placebo | 4 | 46 |
Faremos então, o upload dos dados no sistema.
We will then use the Cross Table tool and configure it as shown in the figure below.
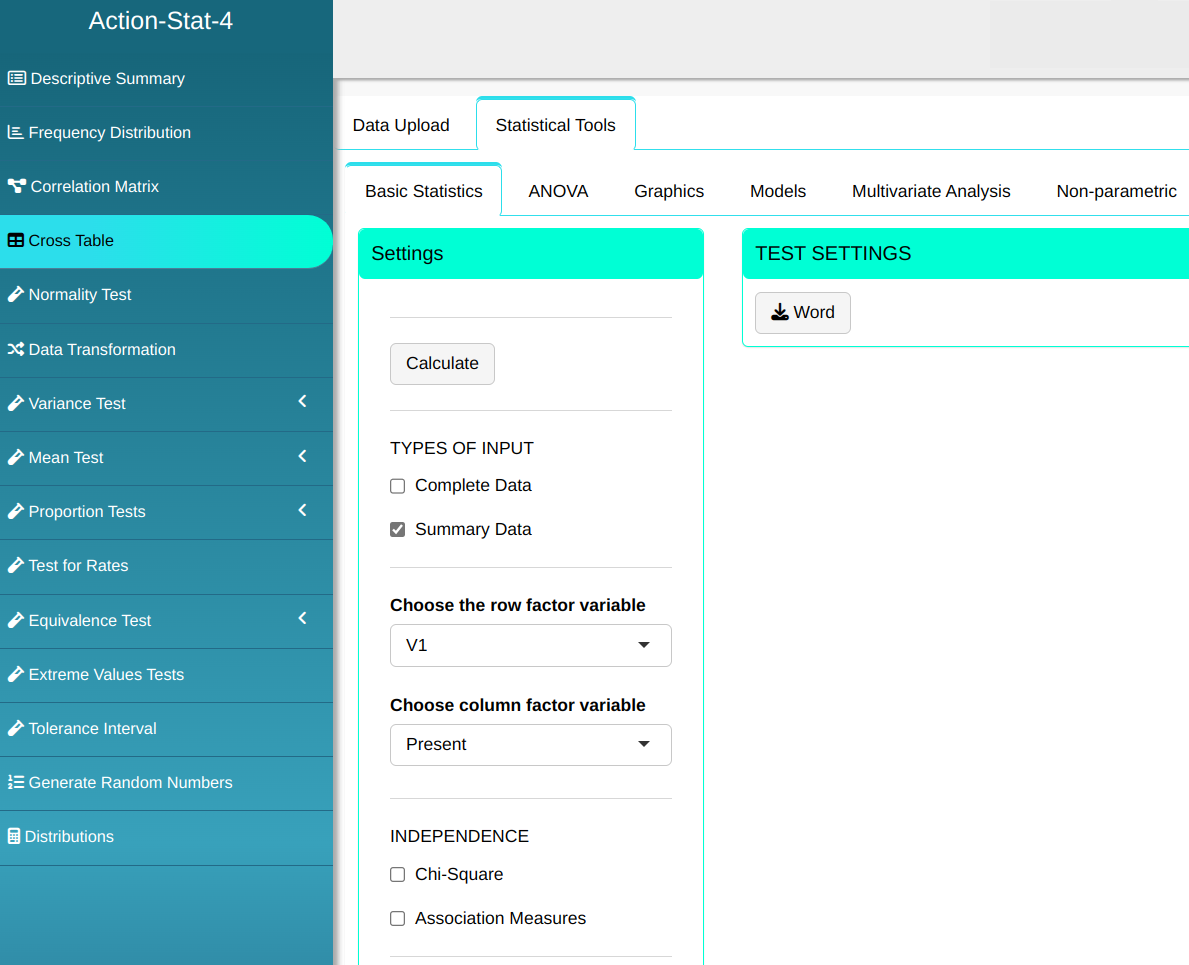
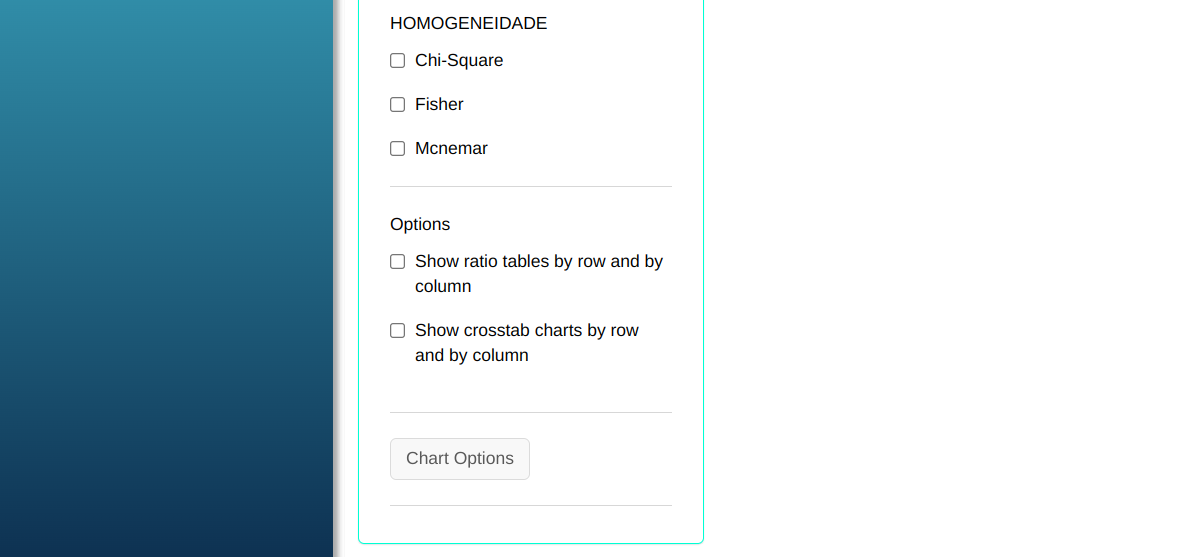
Then click Calculate to get the results. You can also generate the analyses and download them in Word format.
The results are as follows:
Cross Table
| Present | Absente | Total | |
|---|---|---|---|
| Medicines | 15 | 35 | 50 |
| Placebo | 4 | 46 | 50 |
| Total | 19 | 81 | 100 |
Table Proportion
| Present | Absent | |
|---|---|---|
| Medicines | 0.15 | 0.35 |
| Placebo | 0.04 | 0.46 |