5. Normality Test
Normality Tests are used to determine whether a numeric vector comes from a Normal Distribution.
Details:
The tool tests of normality allows you to determine whether a data set is well modeled by a distribution Normal, through testing Anderson-Darling,Kolmogorov-Smirnov, Shapiro-Wilk or Ryan-Joiner. In addition to testing, the tool generates paper probability, which allows you to visually analyze the normality of the data.
Example:
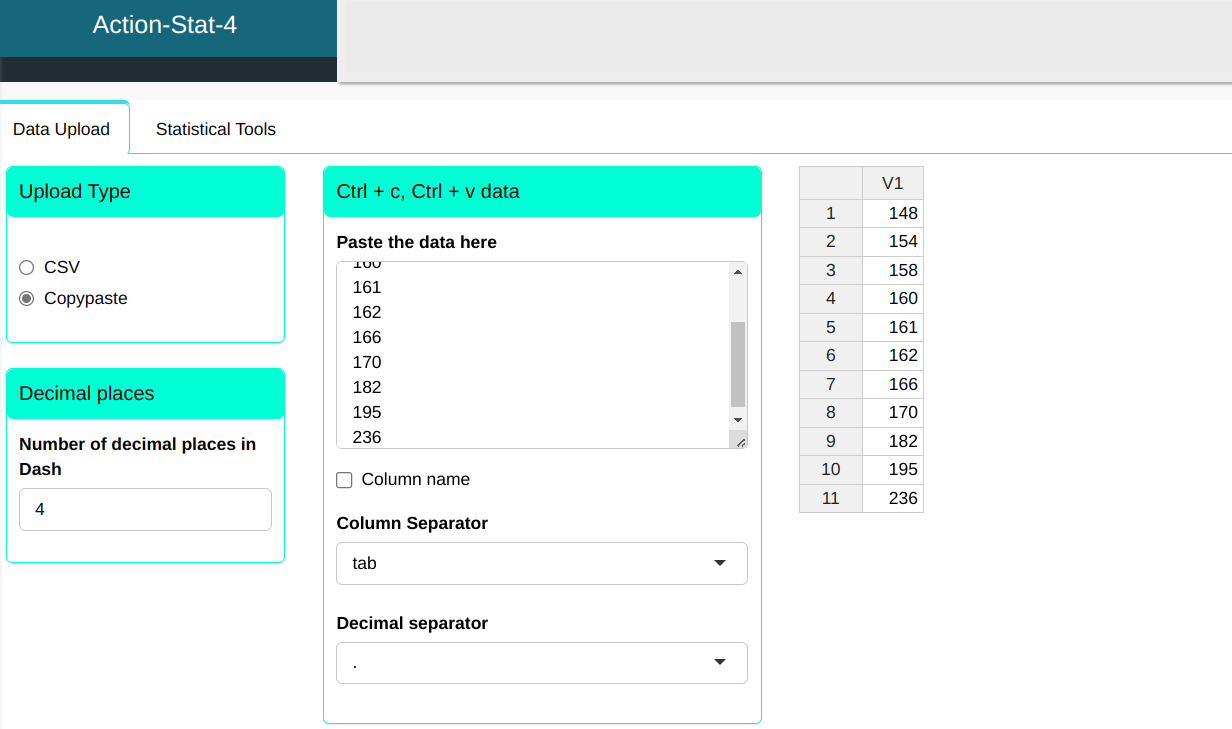
You want to know if the weight of certain parts follows a normal distribution. For this, a sample with 11 piece weight measurements (in pounds) was obtained. We will then upload the data to the system.
| 148 |
| 154 |
| 158 |
| 160 |
| 161 |
| 162 |
| 166 |
| 170 |
| 182 |
| 195 |
| 236 |
We will then perform the normality test.
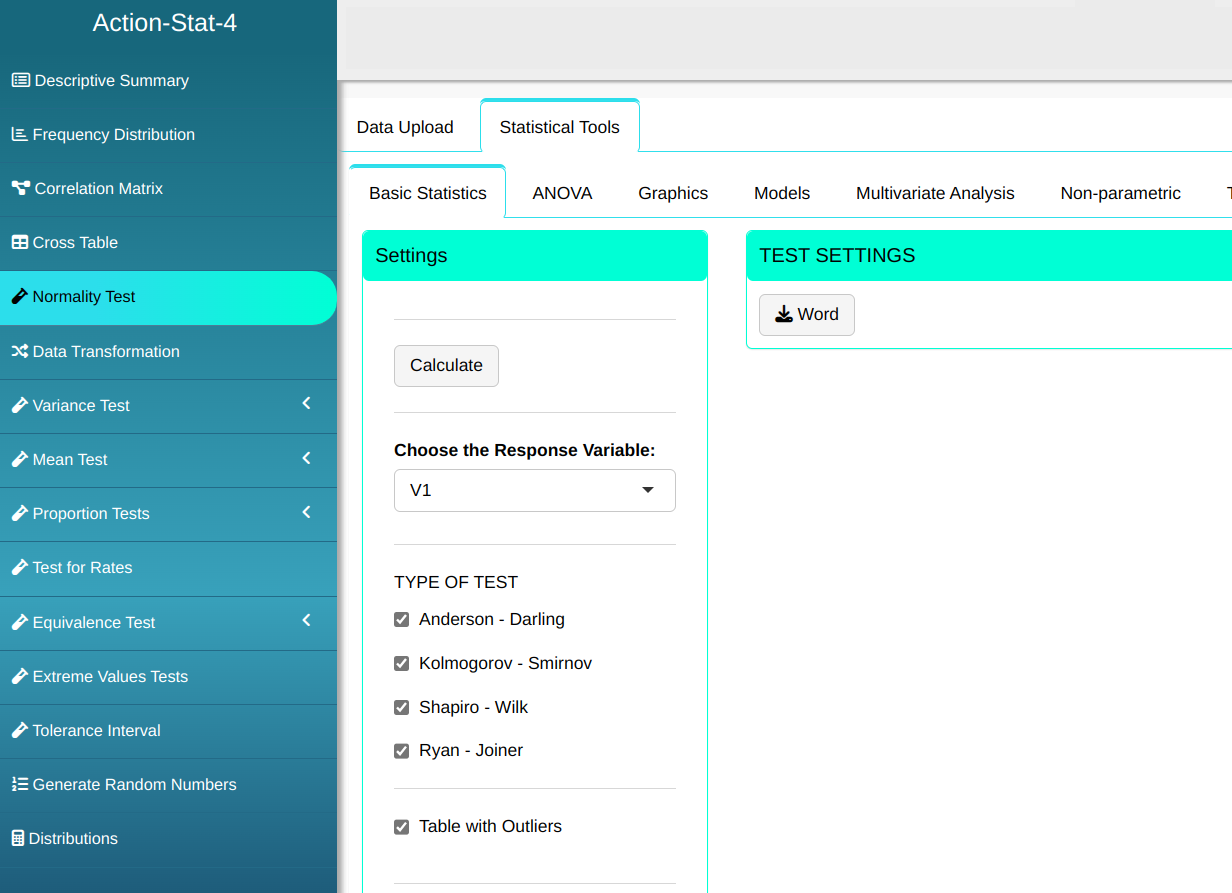

Then click Calculate to get the results. You can also generate the analyses and download them in Word format.
The results obtained are:
Normality Tests
| Statistics | P-values | |
|---|---|---|
| Anderson-Darling | 0.947 | 0.0105 |
| Kolmogorov-Smirnov | 0.259 | 0.0374 |
| Shapiro-Wilk | 0.789 | 0.0067 |
| Ryan-Joiner | 0.878 | 0.0089 |
Outliers (Quantiles)
| Obs. | Normal Quantiles | Data | Criterion |
|---|---|---|---|
| 10 | 1.10 | 195 | Envelope (Confidence Level=95%) |
| 11 | 1.69 | 236 | Envelope (Confidence Level=95%) |
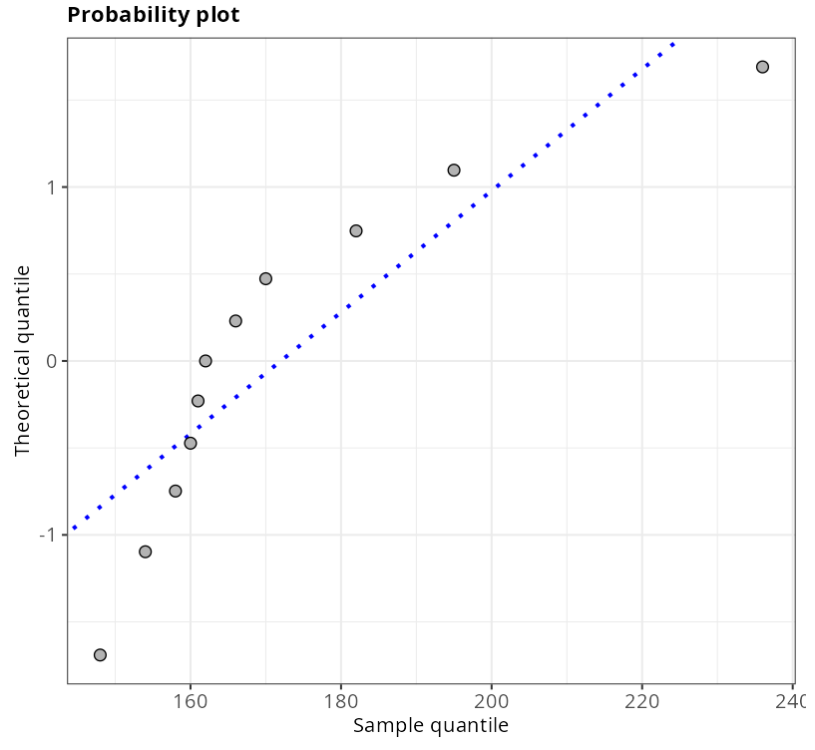
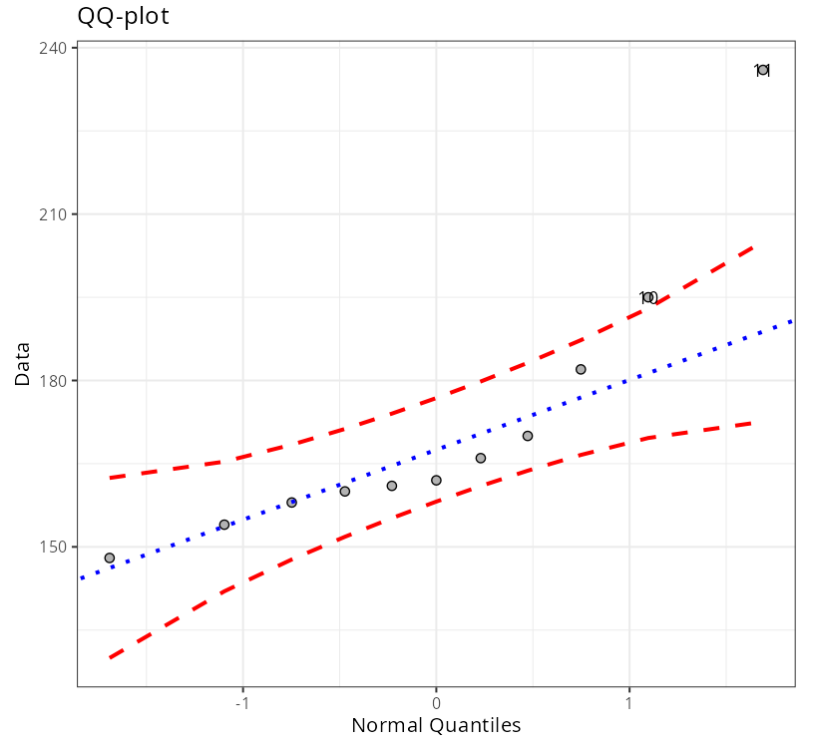
As the P-values are less than 5%, for all tests, we reject the normality hypothesis. Thus, with a 95% confidence level, we have evidence that the data does not follow a normal distribution.
The Probability Paper graph and the QQ-plot show that the data do not follow a normal distribution, as they are not aligned on a straight line. Therefore, it can be concluded that the data set does not have a normal distribution.