1. Mean test: single sample
The T test is used to test hypotheses about the population mean, assuming that the population variance is unknown.
Example 1:
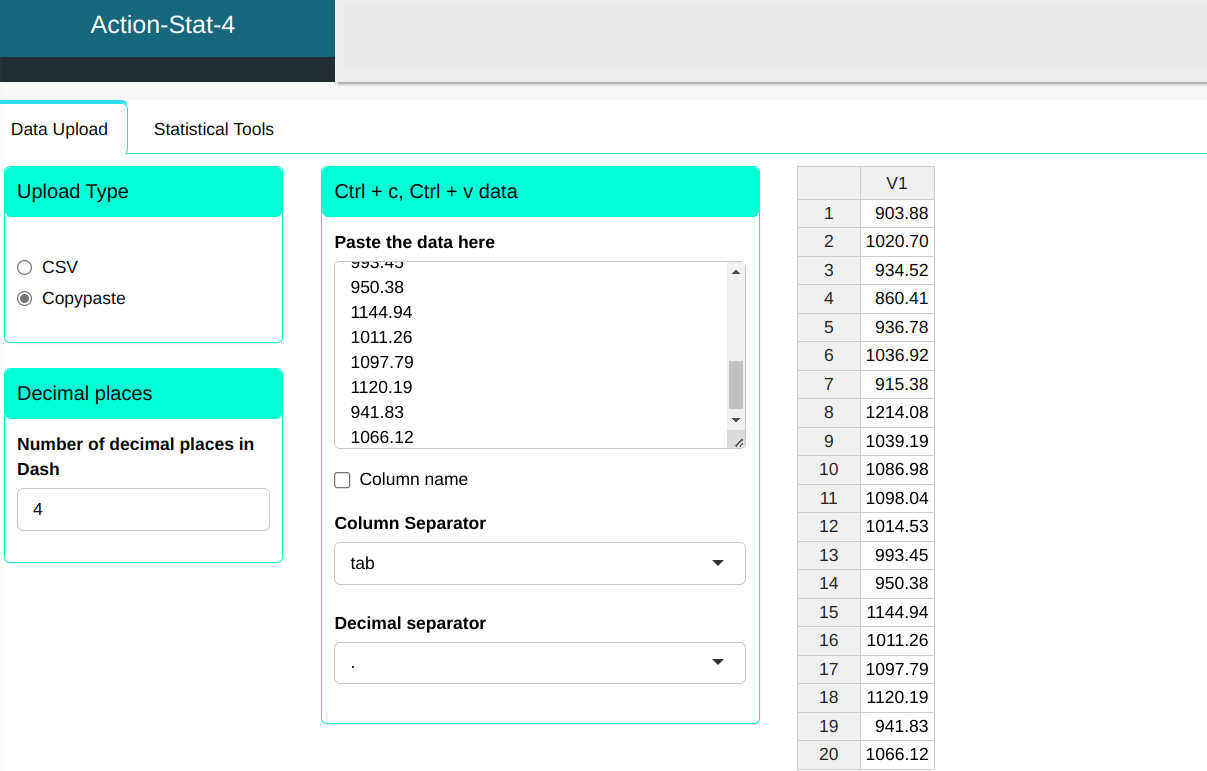
A production engineer wants to test, based on the data in Table a. follow, and for a significance level $\alpha$=0.05, if the average height of a stem is close to nominal value 1055 mm. A sample of 20 stems was analyzed and we will load the data into the system.
| 903.88 |
| 1020.7 |
| 934.52 |
| 860.41 |
| 936.78 |
| 1036.92 |
| 915.38 |
| 1214.08 |
| 1039.19 |
| 1086.98 |
| 1098.04 |
| 1014.53 |
| 993.45 |
| 950.38 |
| 1144.94 |
| 1011.26 |
| 1097.79 |
| 1120.19 |
| 941.83 |
| 1066.12 |
The data will be sent to the system.
To perform an average test, the procedure is executed according to the configuration shown in the figure below.
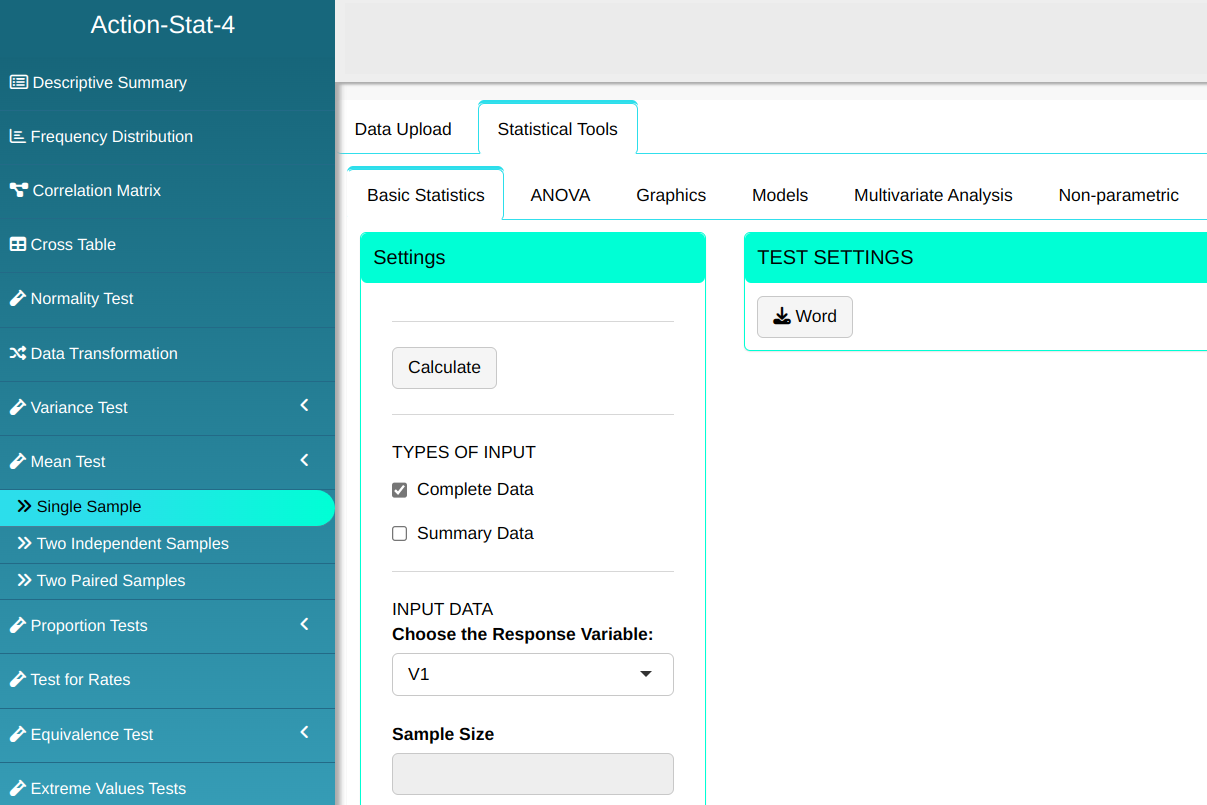
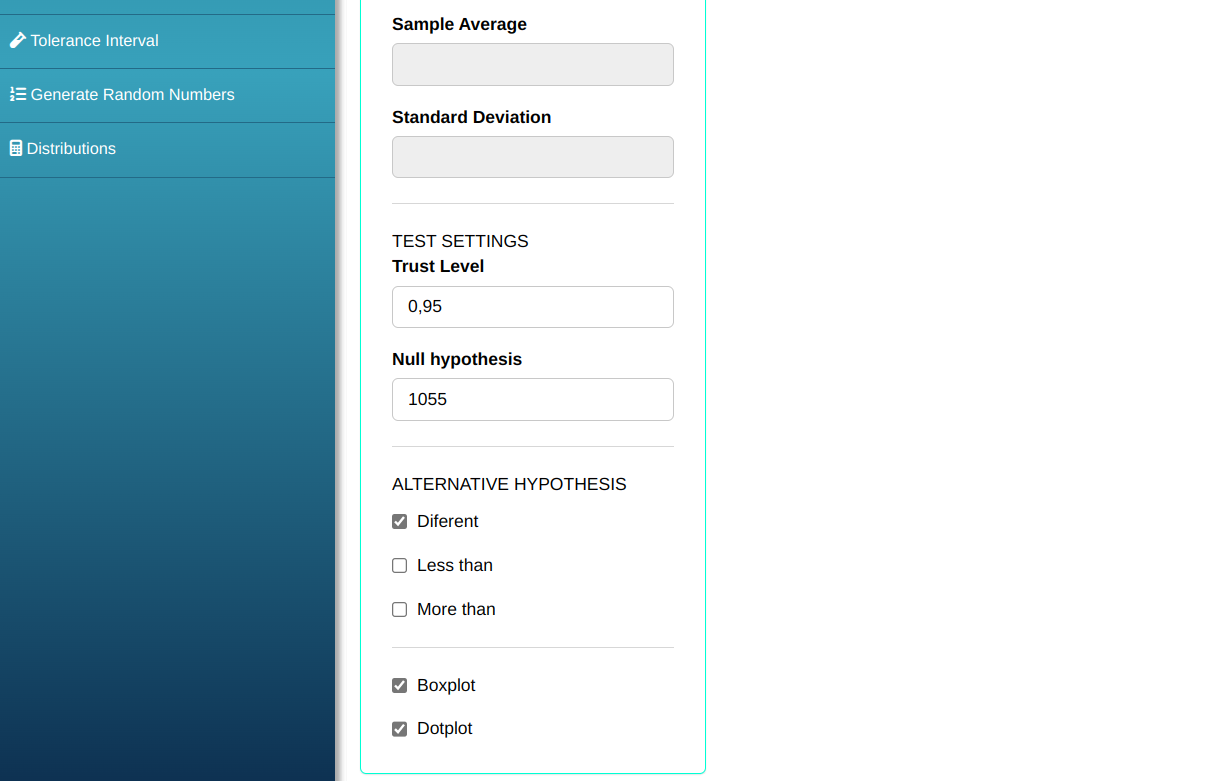
Then click Calculate to get the results. You can also generate the analyses and download them in Word format.

Test results
| Value | |
|---|---|
| T Statistics | -1,744 |
| Degrees of freedom | 19 |
| P-value | 0.097 |
| Sample Mean | 1019.369 |
| Sample standard deviation | 91,369 |
| Sample size | 20,000 |
| Alternative hypothesis different from | 1055 |
| Confidence level | 0.950 |
| Lower limit | 976.607 |
| Upper limit | 1062.130 |
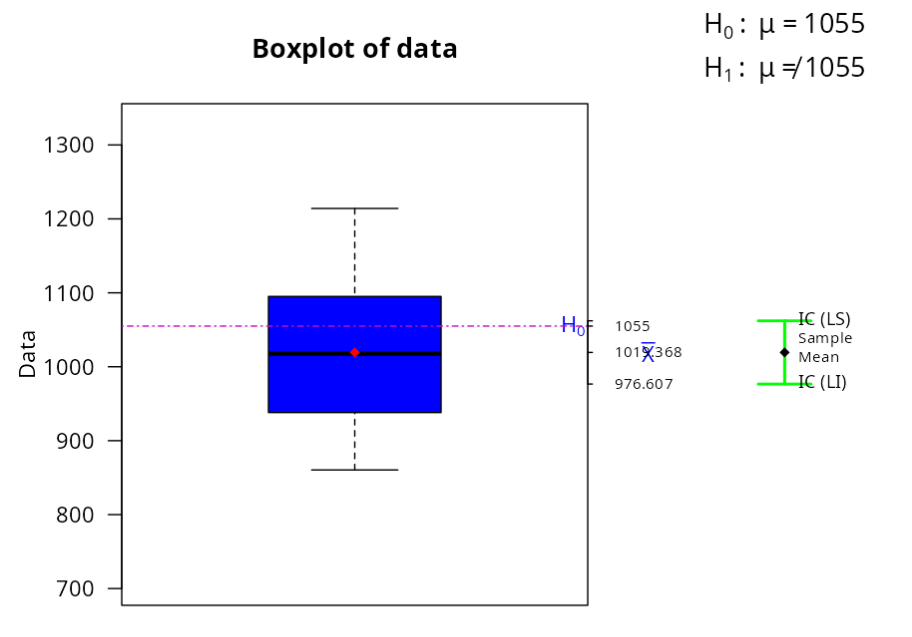
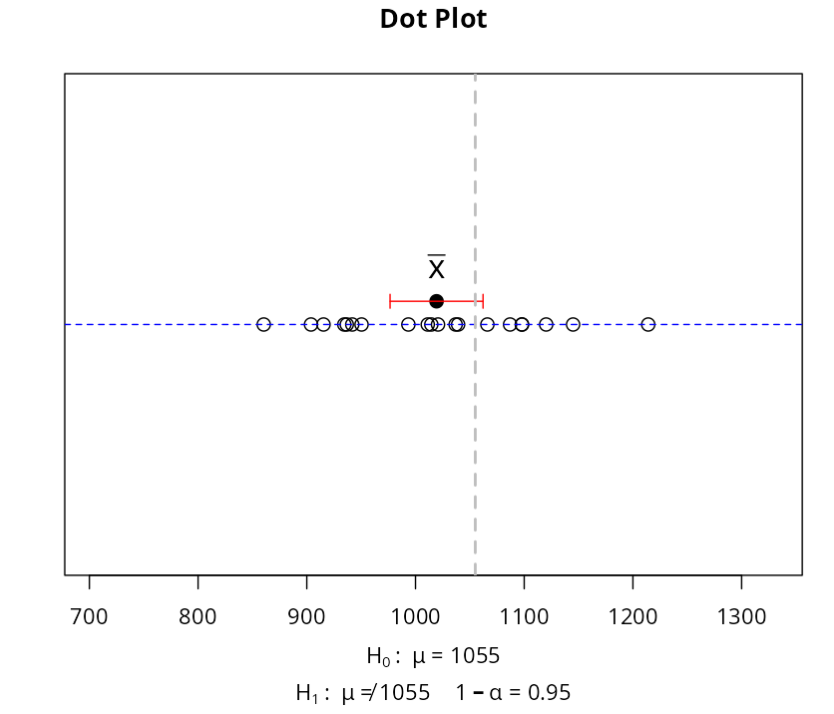
The test statistic is -1.744. Since the P-value is 0.0973, then at a 5% significance level, we do not reject the null hypothesis that the The mean height of the stem population is close to the nominal value. 1055mm.
Example 2:
A production engineer wants to test, at a significance level $\alpha$ = 0.05, if the mean height of a rod approaches the nominal value 1055 mm, from a sample size of 20 with an mean of 1019,369 and standard deviation 91.36863.
To perform an average test, the procedure is executed according to the configuration shown in the figure below.
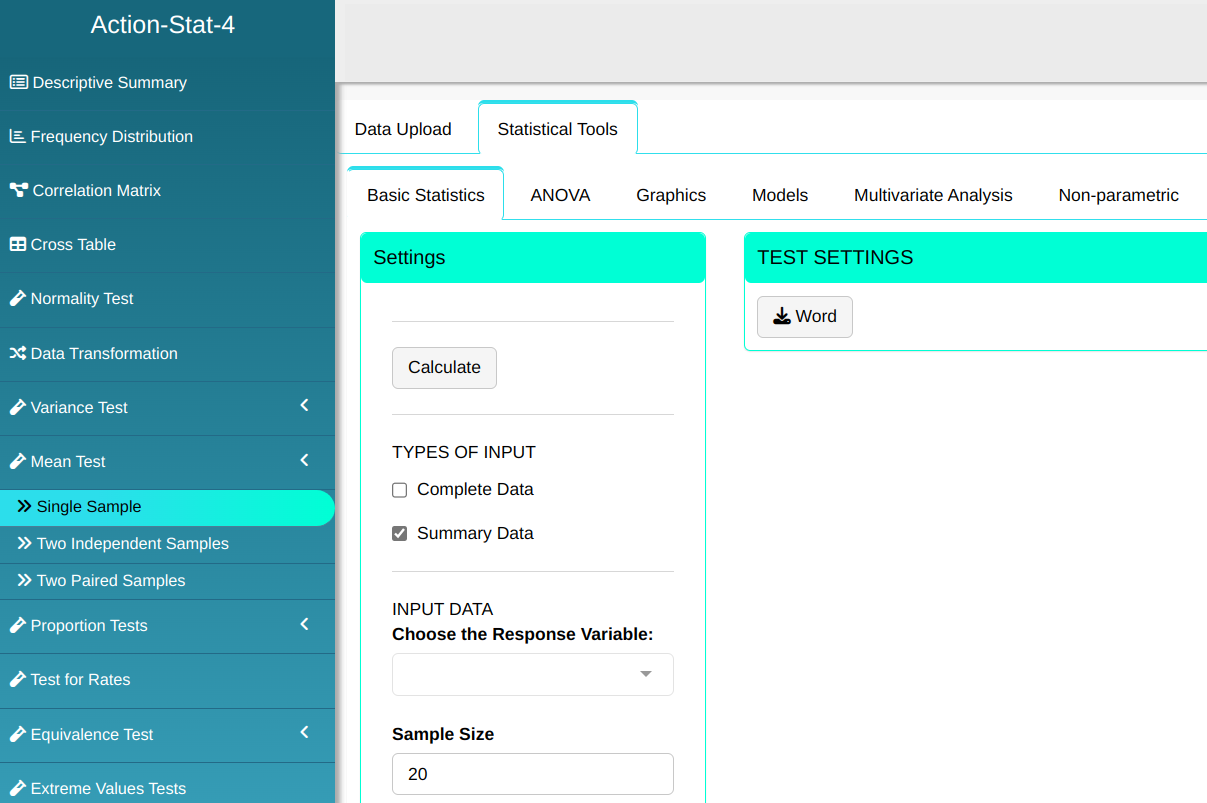
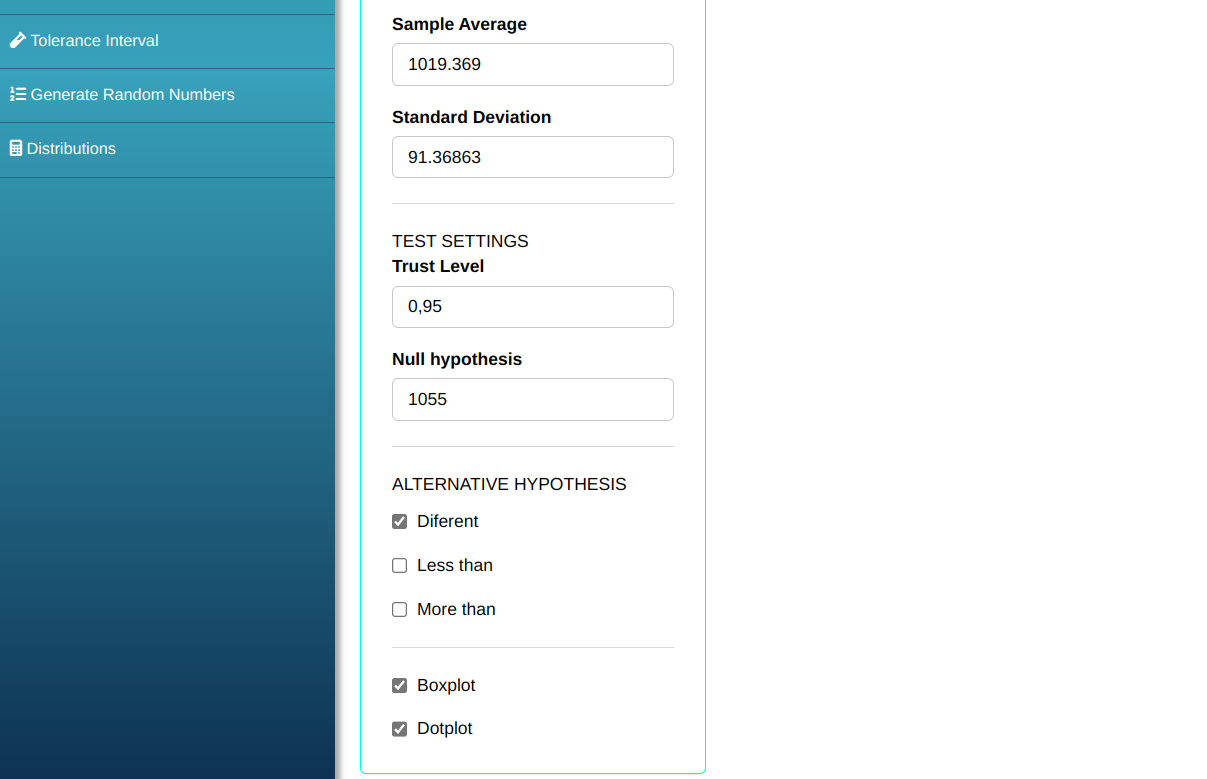
Then click Calculate to get the results. You can also generate the analyses and download them in Word format.
Results of Test
| Value | |
|---|---|
| T Statistics | -1,744 |
| Degrees of freedom | 19 |
| P-value | 0.097317 |
| Sample Mean | 1019.369 |
| Sample standard deviation | 91.36863 |
| Sample size | 20 |
| Alternative hypothesis different from | 1055 |
| Confidence level | 0.950 |
| Lower limit | 976.60716 |
| Upper limit | 1062.13084 |
The test statistic is -1.744. Since the P value is 0.0973, then at a 5% significance level, we do not reject the null hypothesis that the The mean height of the stem population is close to the nominal value. 1055mm.