2. Mean Test: Two Independent Samples
The t-test can be used to compare the means of two independent samples.
Example 1:
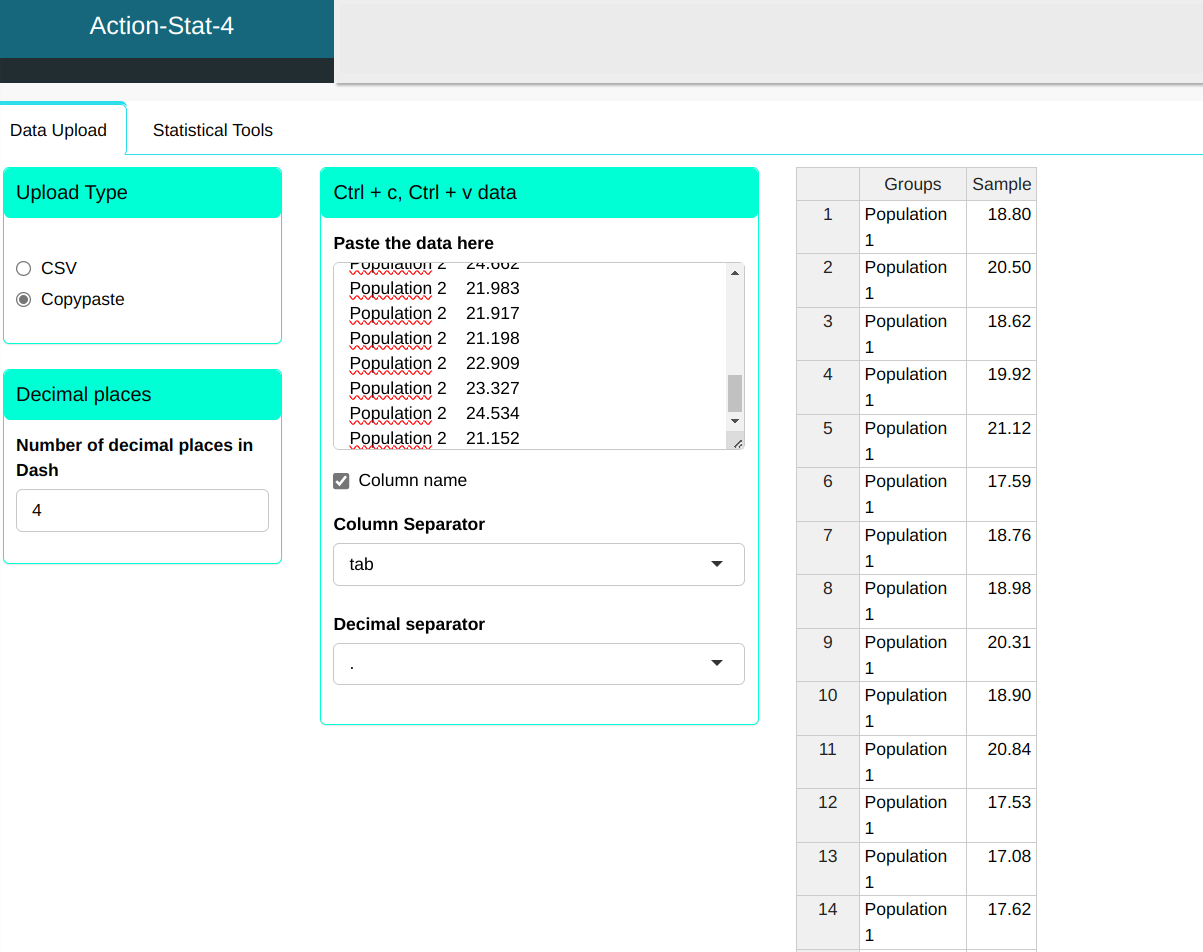
We want to test the equality of the means of two populations that have equal variances. A sample was taken from each population, as shown in the following Tables.
| Groups | Sample |
|---|---|
| Population 1 | 18.8 |
| Population 1 | 20.504 |
| Population 1 | 18.621 |
| Population 1 | 19.919 |
| Population 1 | 21.117 |
| Population 1 | 17.591 |
| Population 1 | 18.756 |
| Population 1 | 18.977 |
| Population 1 | 20.308 |
| Population 1 | 18.899 |
| Population 1 | 20.835 |
| Population 1 | 17.527 |
| Population 1 | 17.078 |
| Population 1 | 17.62 |
| Population 1 | 21.426 |
| Population 1 | 19.169 |
| Population 1 | 19.29 |
| Population 1 | 22.059 |
| Population 1 | 18.585 |
| Population 1 | 17.89 |
| Population 1 | 18.755 |
| Population 1 | 19.203 |
| Population 1 | 18.419 |
| Population 1 | 20.764 |
| Population 1 | 21.055 |
| Population 2 | 22.284 |
| Population 2 | 21.901 |
| Population 2 | 25.302 |
| Population 2 | 22.447 |
| Population 2 | 22.771 |
| Population 2 | 22.057 |
| Population 2 | 22.881 |
| Population 2 | 17.968 |
| Population 2 | 23.382 |
| Population 2 | 21.043 |
| Population 2 | 22.629 |
| Population 2 | 22.86 |
| Population 2 | 24.515 |
| Population 2 | 22.426 |
| Population 2 | 21.203 |
| Population 2 | 24.62 |
| Population 2 | 22.058 |
| Population 2 | 23.15 |
| Population 2 | 22.787 |
| Population 2 | 24.009 |
| Population 2 | 21.491 |
| Population 2 | 22.699 |
| Population 2 | 24.662 |
| Population 2 | 21.983 |
| Population 2 | 21.917 |
| Population 2 | 21.198 |
| Population 2 | 22.909 |
| Population 2 | 23.327 |
| Population 2 | 24.534 |
| Population 2 | 21.152 |
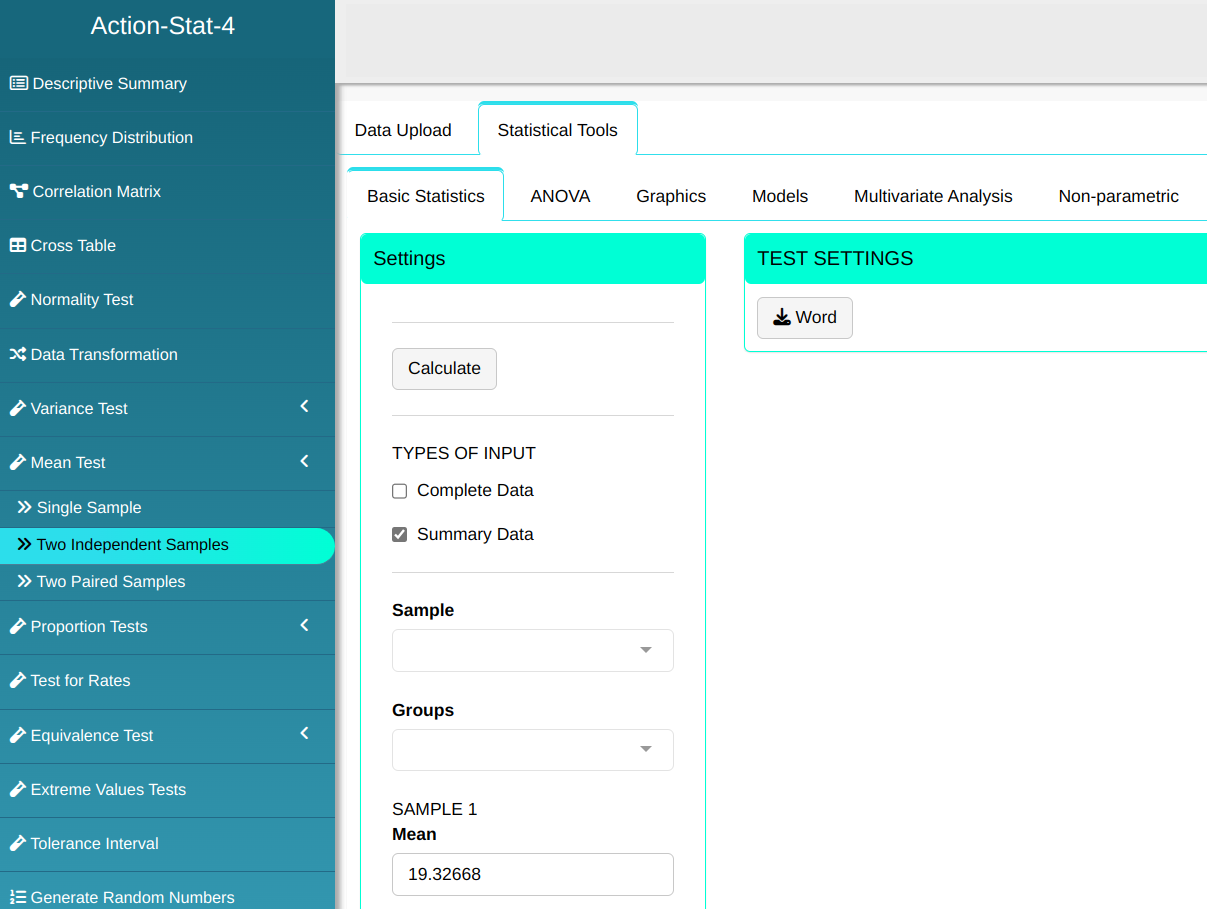
We will upload the data to the system.
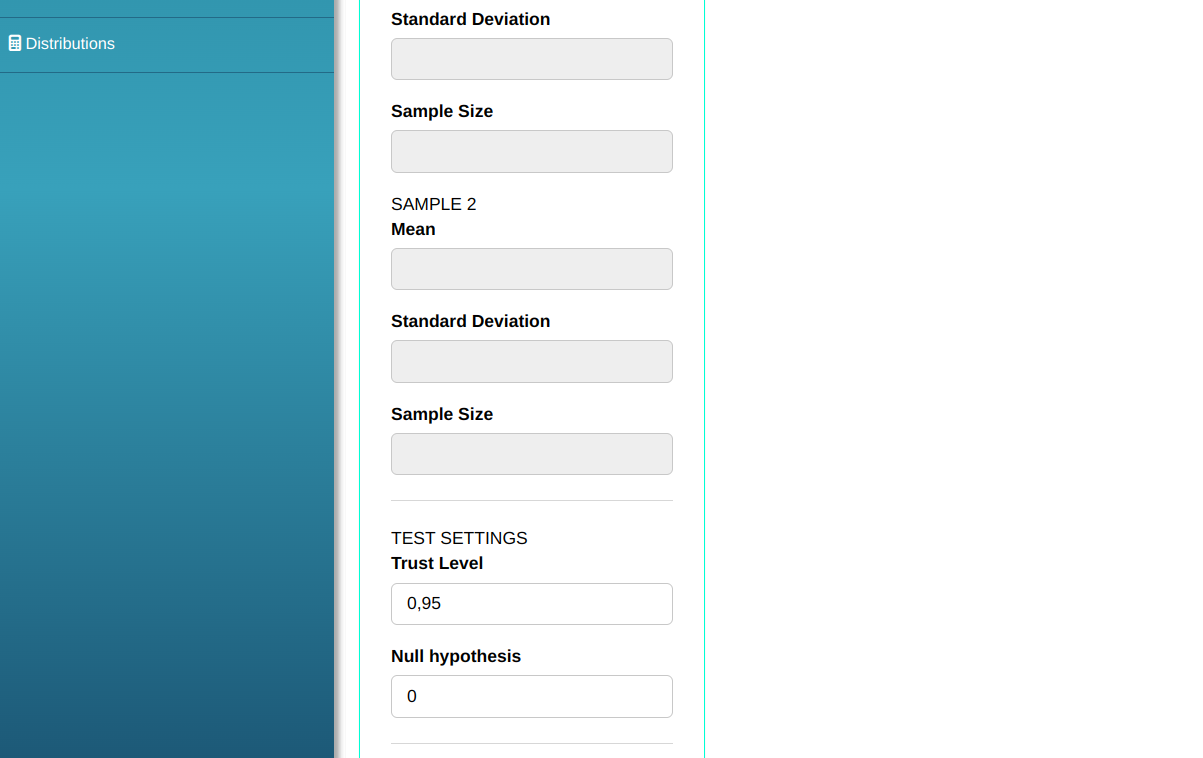
Configuring according to the figure below to make the test.


Then click Calculate to get the results. You can also generate the analyses and download them in Word format.

The results are:
Results
| Values | |
|---|---|
| T Statistics | -8.621733 |
| Degrees of Freedom | 53 |
| P-value | 1.151931e-11 |
| Mean of Population 1 | 19.32668 |
| Mean of Population 2 | 22.6055 |
| Standard Deviation of Population 1 | 1.362278 |
| Standard Deviation of Population 2 | 1.43822 |
| Grouped Standard Deviation | 1.40434 |
| Sample size for Population 1 | 25 |
| Sample size for Population 2 | 30 |
| Alternative Hypothesis different from | 0 |
| Confidence Leve | 95% |
| Lower Limit | -4.041599 |
| Upper Limit | -2.516041 |
The test statistic is -8.62. As the P-value is 1.15193E-11, then at a significance level of 5%, we reject the null hypothesis of equality of the means of the two populations.
Example 2:
We want to test the equality of the means of two populations that have equal variances. A sample was taken from each population, as shown in the following Tables.
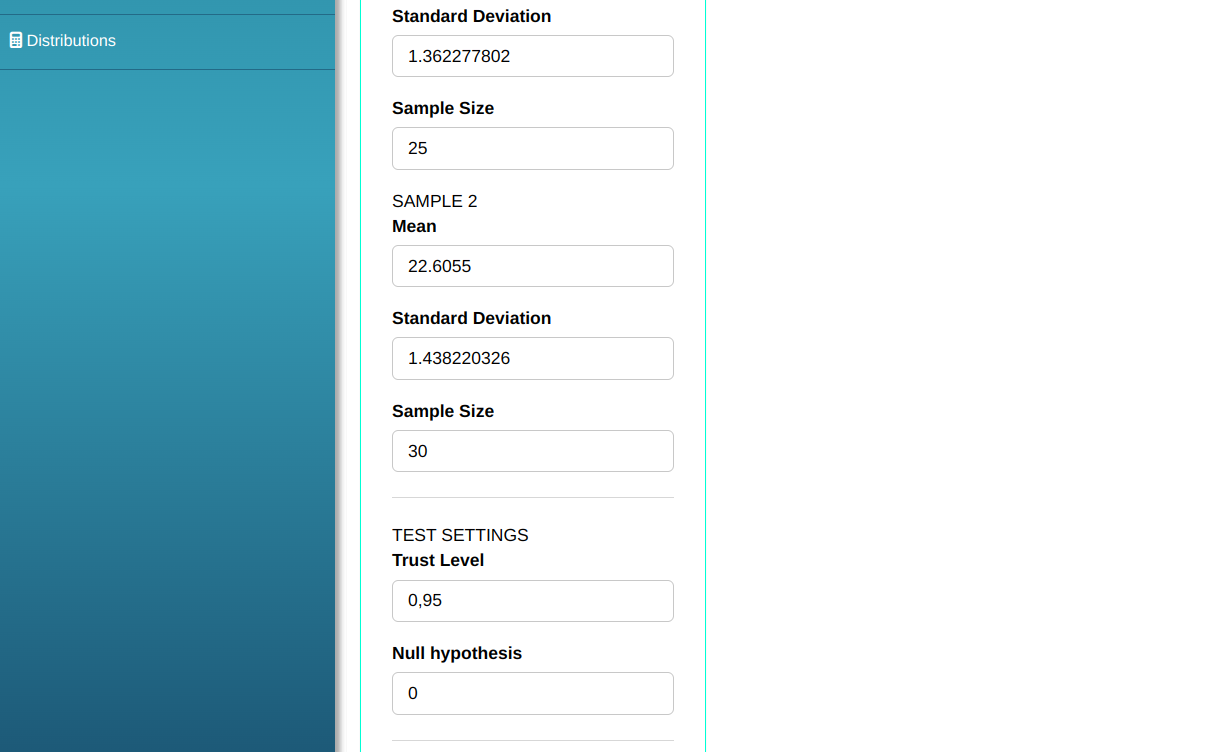
| Mean | Standard Deviation | Sample size | |
|---|---|---|---|
| Sample 1 | 19,32668 | 1,362277802 | 25 |
| Sample 2 | 22,6055 | 1,438220326 | 30 |
Configuring according to the figure below to make the test.

Then click Calculate to get the results. You can also generate the analyses and download them in Word format.
The results are:
Results
| Value | |
|---|---|
| T Statistics | -8.621733 |
| Degrees of Freedom | 53 |
| P-value | 1.151931e-11 |
| Sample Mean 1 | 19.32668 |
| Sample Mean 2 | 22.6055 |
| Standard deviation of Sample 1 | 1.362278 |
| Standard deviation of Sample 2 | 1.43822 |
| Grouped Standard deviation | 1.40434 |
| Sample Size 1 | 25 |
| Sample Size 2 | 30 |
| Alternative Hypothesis Different from | 0 |
| Confidence Level | 95% |
| Lower Limit | -4.041599 |
| Upper Limit | -2.516041 |
The test statistic is -8.62. As the p-value is 1.15E-11, at a significance level of 5%, we reject the null hypothesis that the means of the two populations are equal.