3. Mean test: Two paired samples
Paired T-test will test the mean difference between two samples independent.
Example:
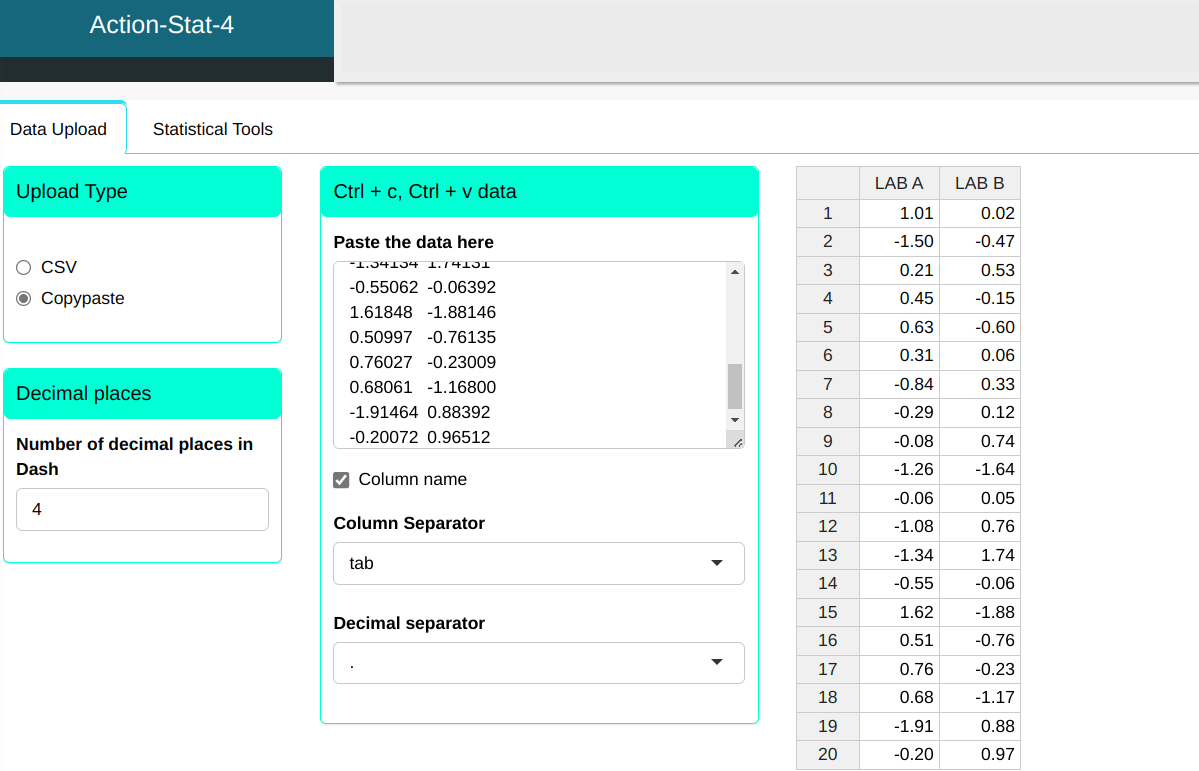
Let us consider a sample of measurements from Company A’s laboratory and a sample of measurements from Company B’s laboratory, values that can be found in the following Table. The tests from both laboratories are carried out in the same pattern, therefore, there is a correlation between them, that is, the samples are dependent. Assess the compatibility of measurements between company A’s laboratory and company B’s laboratory.
| LAB A | LAB B |
|---|---|
| 1.00552 | 0.01942 |
| -1.49928 | -0.46512 |
| 0.21367 | 0.53218 |
| 0.44658 | -0.14844 |
| 0.62766 | -0.60021 |
| 0.31091 | 0.06495 |
| -0.83878 | 0.33013 |
| -0.29054 | 0.12116 |
| -0.08487 | 0.74269 |
| -1.26465 | -1.64232 |
| -0.06353 | 0.05497 |
| -1.07632 | 0.76342 |
| -1.34134 | 1.74131 |
| -0.55062 | -0.06392 |
| 1.61848 | -1.88146 |
| 0.50997 | -0.76135 |
| 0.76027 | -0.23009 |
| 0.68061 | -1.16800 |
| -1.91464 | 0.88392 |
| -0.20072 | 0.96512 |
We will upload the data to the system.
Configuring according to the figure below, we will then carry out the test.
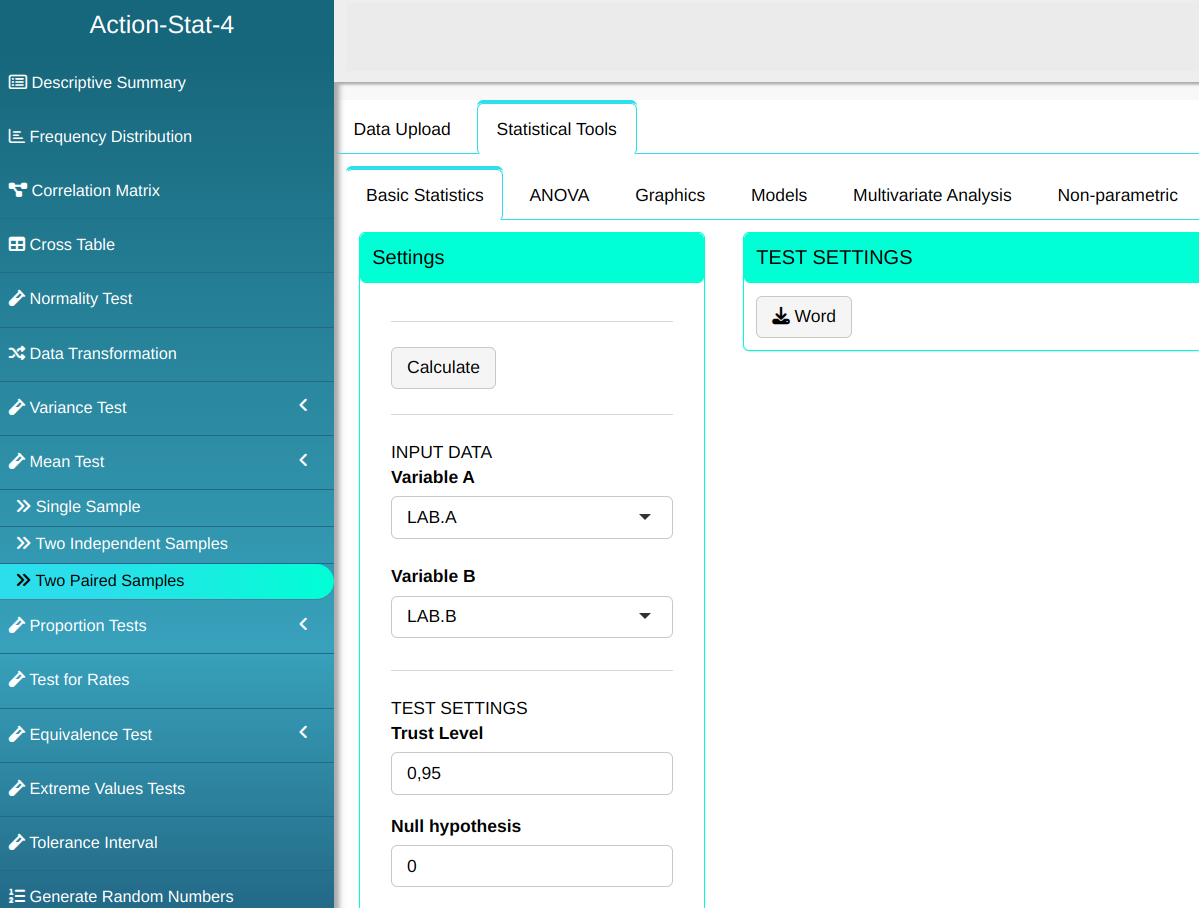

Then click Calculate to get the results. You can also generate the analyses and download them in Word format.
The results are as follows:
Results
| Values | |
|---|---|
| T Statistic | -0.3149009 |
| Degrees of Freedom | 19 |
| P-value | 0.756269 |
| Mean of LAB.A | -0.14757 |
| Mean of LAB.B | -0.037085 |
| Standard deviation of differences | 1.569077 |
| Sample Size | 20 |
| Alternative Hypothesis Different from | 0 |
| Confidence Level | 95% |
| Lower Limit | -0.8448358 |
| Upper Limit | 0.6238658 |
The test statistic is -0.3149887. As the p-value is 0.7562 then, at a significance level of 5%, we do not reject the null hypothesis of compatibility of measurements between company A’s laboratory and the company B laboratory.