10. Rate test
The rate test is used to analyze whether any rate in the experiment is satisfactory.
Example:
| 3 |
| 2 |
| 5 |
| 4 |
| 2 |
| 9 |
| 4 |
| 2 |
| 7 |
| 3 |
| 3 |
| 3 |
| 3 |
| 5 |
| 8 |
| 4 |
| 4 |
| 3 |
| 4 |
| 8 |
| 8 |
| 7 |
| 5 |
| 4 |
| 5 |
| 3 |
| 2 |
| 5 |
| 5 |
| 2 |
| 6 |
| 2 |
| 2 |
| 5 |
| 6 |
| 4 |
| 6 |
| 5 |
| 4 |
| 3 |
| 6 |
| 5 |
| 2 |
| 6 |
| 3 |
| 2 |
| 3 |
| 2 |
| 1 |
| 6 |
| 3 |
| 2 |
| 3 |
| 5 |
| 2 |
| 4 |
| 6 |
| 3 |
| 2 |
| 6 |
| 2 |
| 0 |
| 3 |
| 6 |
| 4 |
| 6 |
| 5 |
| 6 |
| 3 |
| 4 |
| 3 |
| 4 |
| 1 |
| 7 |
| 4 |
| 5 |
| 3 |
| 3 |
| 3 |
| 2 |
| 5 |
| 5 |
| 6 |
| 7 |
| 7 |
| 2 |
| 4 |
| 3 |
| 5 |
| 6 |
| 4 |
| 5 |
| 3 |
| 5 |
| 0 |
| 5 |
| 5 |
| 5 |
| 7 |
| 9 |
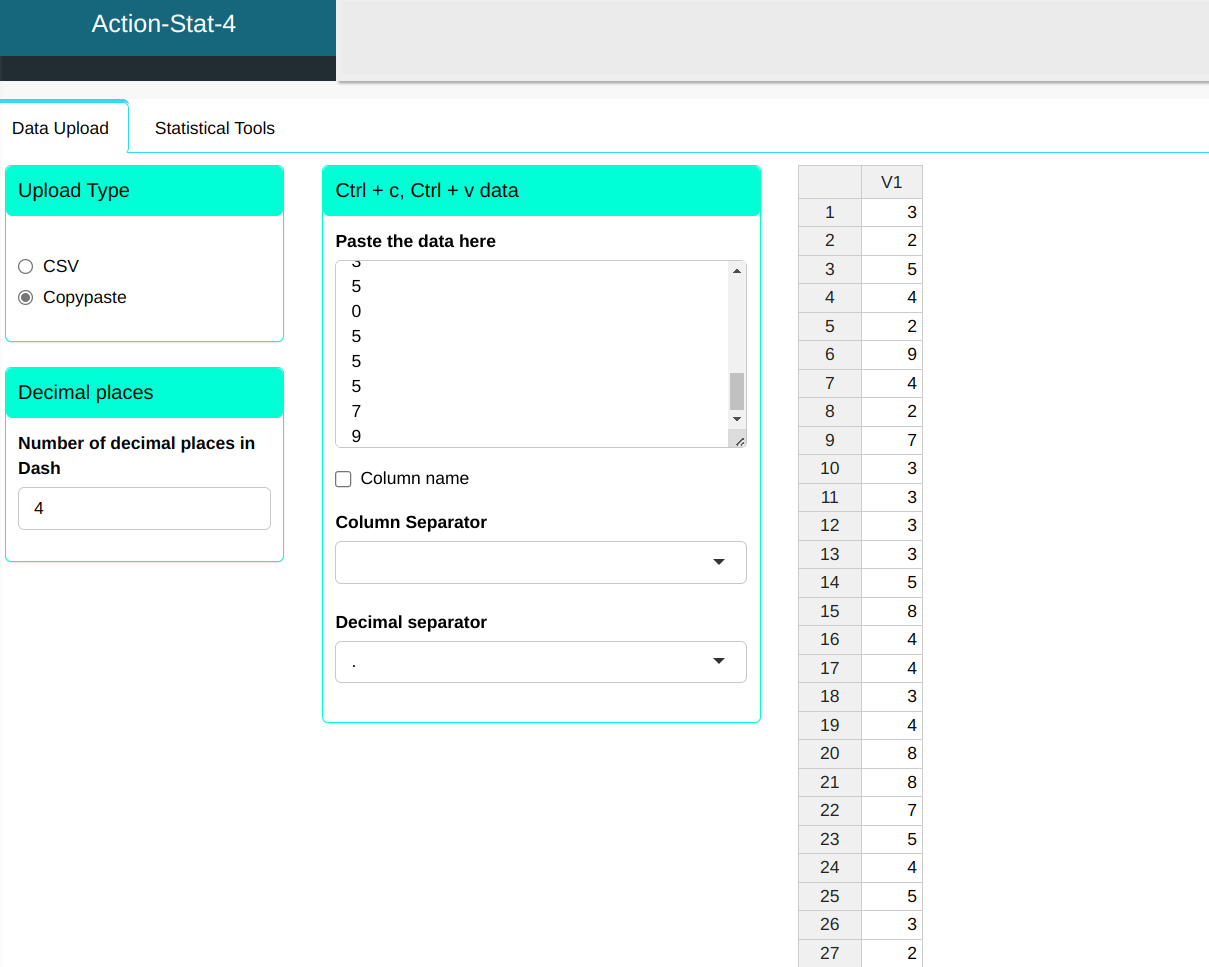
We will upload the data to the system.
Configuring according to the figure below for test the rate.
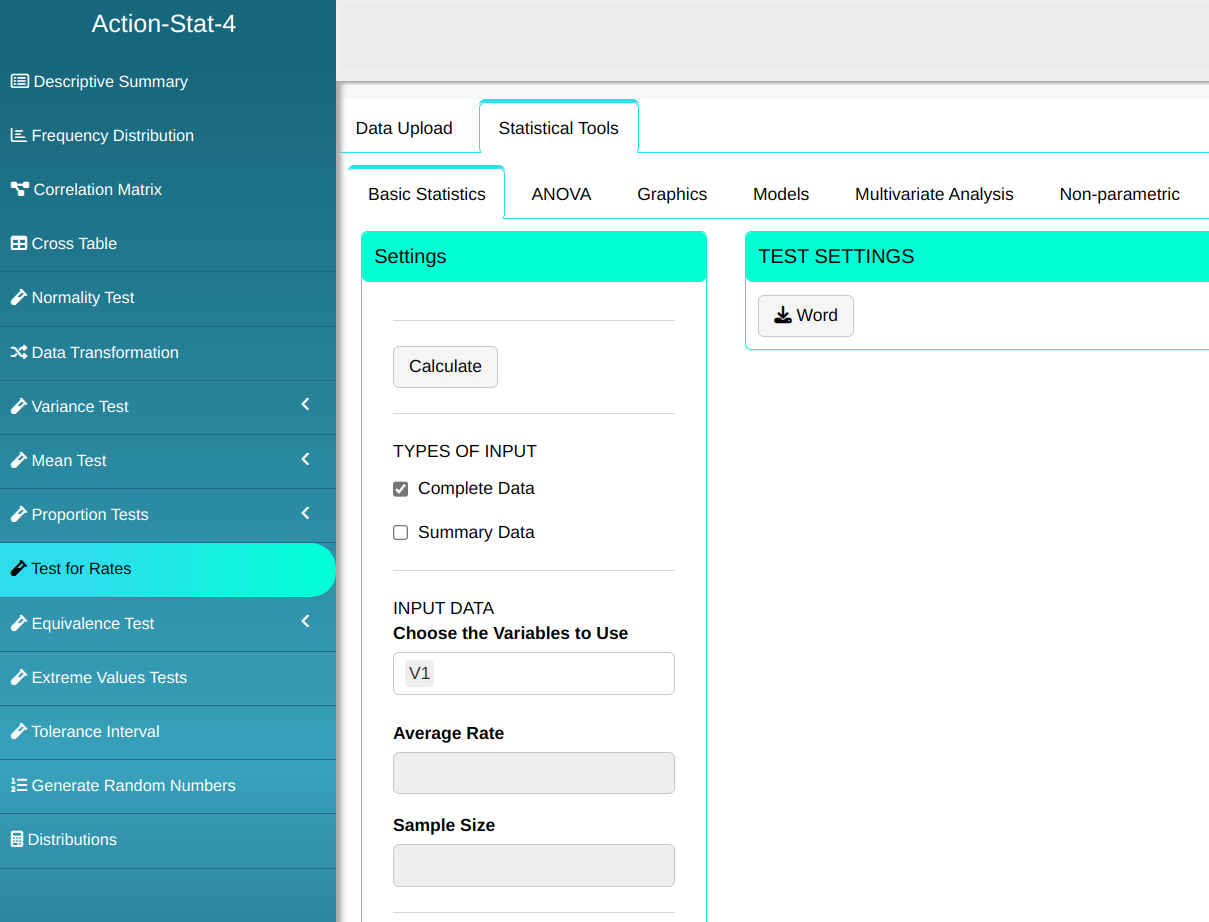

Then click Calculate to get the results. You can also generate the analyses and download them in Word format.

The results are as follows:
Results
| V1 | |
|---|---|
| Z statistic | 0.95 |
| P-value | 0.1710561 |
| Average sampling rate | 4.19 |
| Sample size | 100 |
| Alternative hypothesis greater than | 4 |
| Confidence level | 95% |
| Lower limit | 3.853307 |
| Upper limit | Inf |
As the p-value is equal to 0.1711 $>$ 0.05 we do not reject the null hypothesis that the average defect rate per piece is 4. Therefore, we don’t have enough evidence to reject the lot.
Last modified 19.11.2025: Atualizar Manual (288ad71)