1. Proportions: Single Sample
Proportion test is used to analyze whether the success rate of a experiment is satisfactory.
Example 1:
A manufacturer guarantees that 90% of the parts it supplies to the production line of a given factory is in accordance with the specifications required. A sample of 200 pieces was selected and each piece was evaluated as within specifications (value 1) or outside specifications specifications (value 0) according to the table below. At a 5% level, Can we say that the manufacturer’s claim is true?
| 1 |
| 1 |
| 1 |
| 1 |
| 1 |
| 0 |
| 1 |
| 1 |
| 1 |
| 1 |
| 1 |
| 0 |
| 1 |
| 1 |
| 1 |
| 1 |
| 1 |
| 1 |
| 1 |
| 1 |
| 1 |
| 1 |
| 0 |
| 1 |
| 1 |
| 1 |
| 1 |
| 1 |
| 1 |
| 1 |
| 0 |
| 1 |
| 1 |
| 1 |
| 1 |
| 1 |
| 1 |
| 1 |
| 1 |
| 1 |
| 1 |
| 1 |
| 1 |
| 1 |
| 1 |
| 1 |
| 1 |
| 1 |
| 1 |
| 1 |
| 1 |
| 1 |
| 1 |
| 1 |
| 1 |
| 1 |
| 1 |
| 1 |
| 1 |
| 0 |
| 1 |
| 1 |
| 1 |
| 1 |
| 1 |
| 0 |
| 1 |
| 0 |
| 1 |
| 1 |
| 1 |
| 1 |
| 1 |
| 1 |
| 1 |
| 1 |
| 1 |
| 1 |
| 1 |
| 1 |
| 0 |
| 1 |
| 1 |
| 1 |
| 1 |
| 1 |
| 1 |
| 0 |
| 1 |
| 1 |
| 1 |
| 1 |
| 1 |
| 1 |
| 1 |
| 1 |
| 1 |
| 1 |
| 0 |
| 1 |
| 1 |
| 1 |
| 1 |
| 1 |
| 1 |
| 1 |
| 1 |
| 1 |
| 1 |
| 1 |
| 1 |
| 1 |
| 1 |
| 1 |
| 1 |
| 1 |
| 1 |
| 1 |
| 1 |
| 1 |
| 1 |
| 1 |
| 1 |
| 1 |
| 1 |
| 1 |
| 1 |
| 1 |
| 1 |
| 0 |
| 1 |
| 1 |
| 0 |
| 1 |
| 1 |
| 1 |
| 1 |
| 1 |
| 1 |
| 0 |
| 1 |
| 0 |
| 1 |
| 1 |
| 1 |
| 1 |
| 1 |
| 0 |
| 1 |
| 1 |
| 1 |
| 1 |
| 0 |
| 1 |
| 1 |
| 1 |
| 1 |
| 1 |
| 1 |
| 0 |
| 1 |
| 1 |
| 1 |
| 1 |
| 1 |
| 0 |
| 0 |
| 1 |
| 1 |
| 1 |
| 1 |
| 1 |
| 1 |
| 1 |
| 0 |
| 1 |
| 1 |
| 1 |
| 1 |
| 0 |
| 1 |
| 1 |
| 1 |
| 1 |
| 1 |
| 1 |
| 0 |
| 1 |
| 1 |
| 1 |
| 0 |
| 1 |
| 1 |
| 1 |
| 1 |
| 1 |
| 1 |
| 0 |
| 0 |
| 1 |
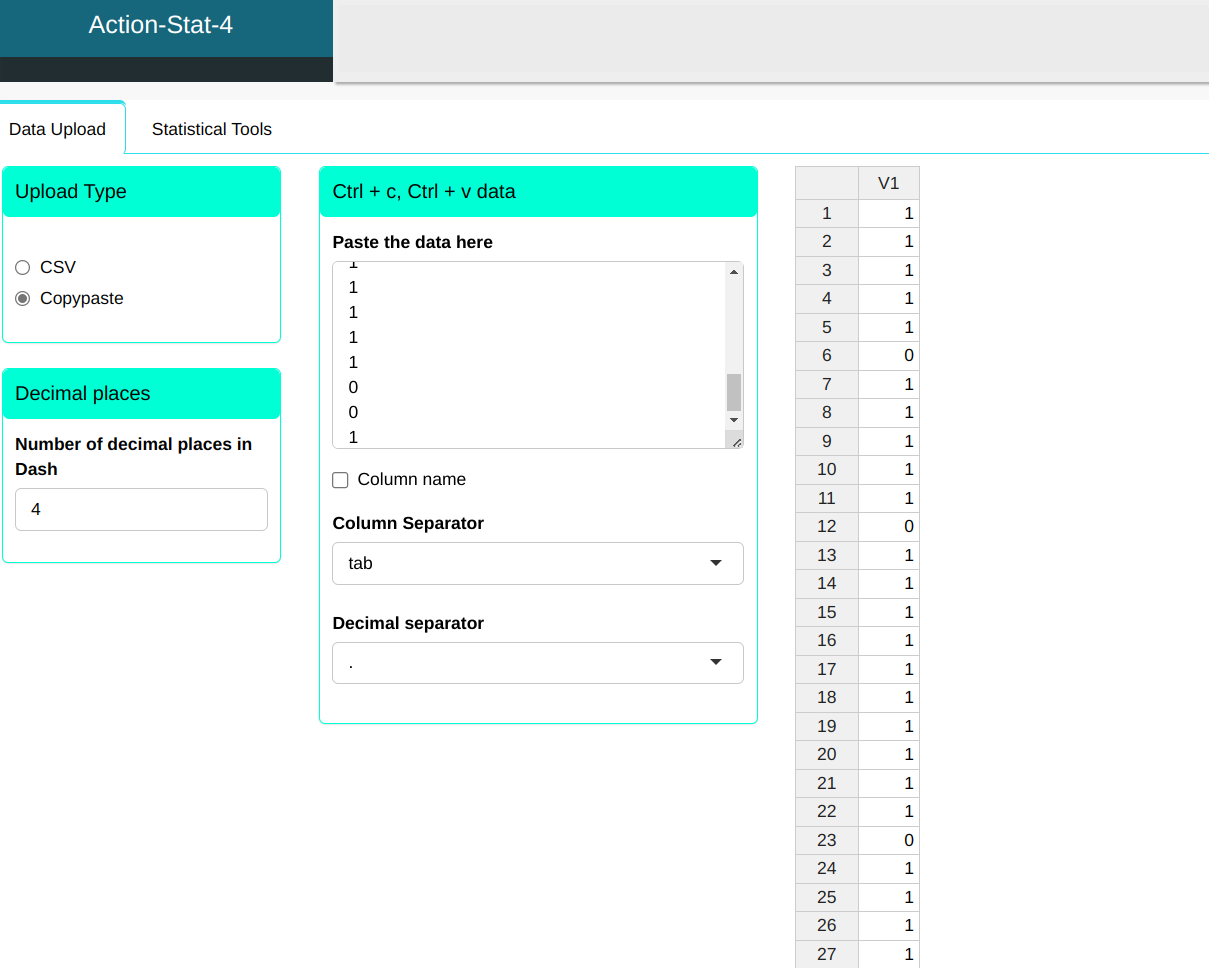
We will then upload the data to the system.
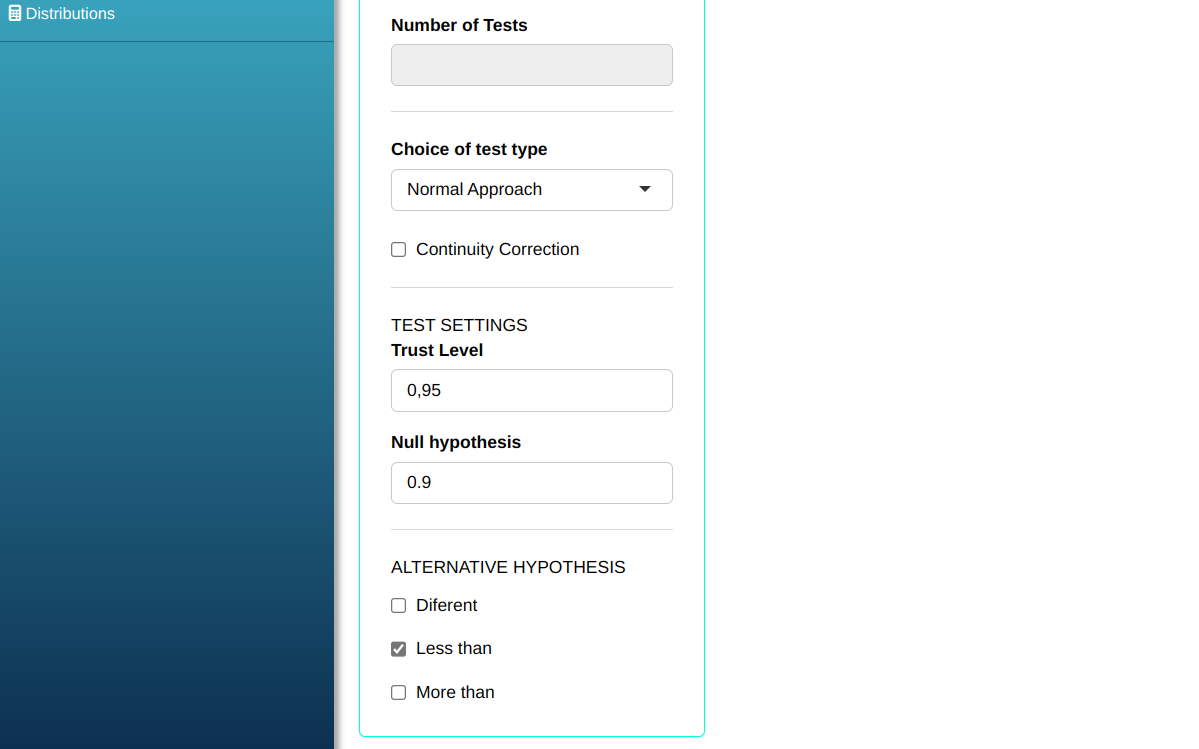
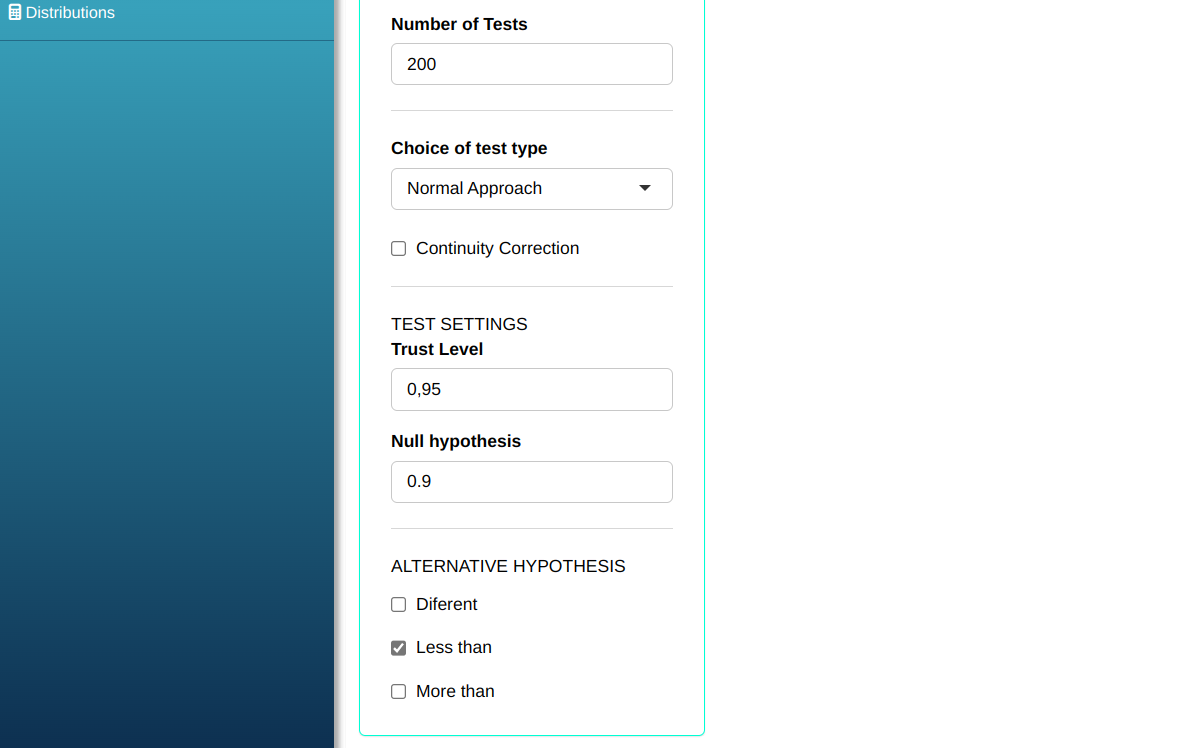
Configuring as shown below and We will do the Proportion Test.
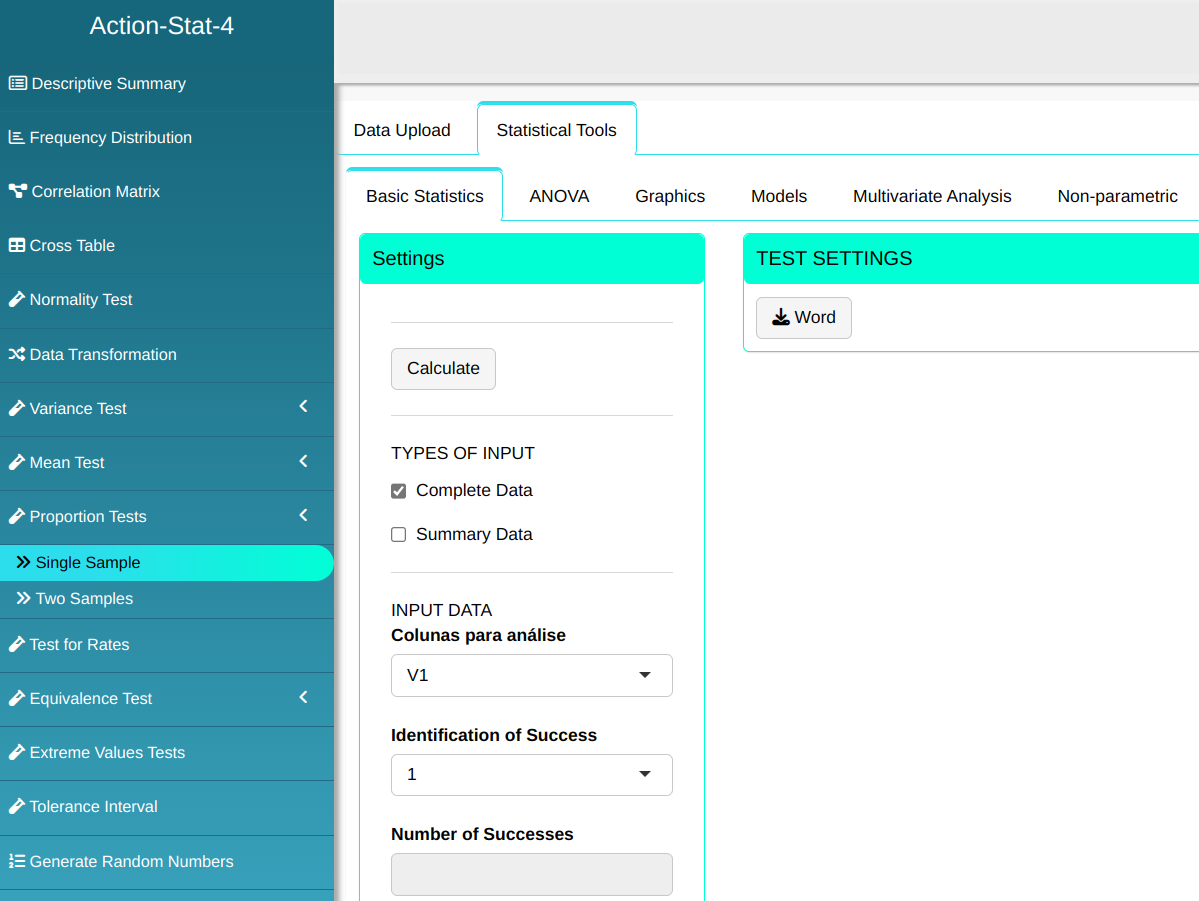
Then click Calculate to get the results. You can also generate the analyses and download them in Word format.

The results are as follows:
Results
| Quantity | Proportions | |
|---|---|---|
| Success | 175 | 0.875 |
| Failure | 25 | 0.125 |
Results
| Values | |
|---|---|
| Z Statistic | -1.178511 |
| P-value | 0.1192964 |
| Proportion of success in the sample | 0.875 |
| Alternative Hypothesis Lower than | 0.9 |
| Confidence Level | 95% |
| Lower Limit | 0 |
| Upper Limit | 0.9134655 |
The test statistic is -1.178511. As the P-value is 0.1192964 > 0.05 So, at a significance level of 5%, we have evidence that the proportion is equal to 0.9.
Example 2:
A manufacturer guarantees that 90% of the parts it supplies to the production line of a given factory is in accordance with the specifications required. Analysis of a sample of 200 parts revealed 25 to be defective. At a level of 5%, we can say that the statement of the manufacturer?
Configuring as shown below and We will do the Proportion Test.

Then click Calculate to get the results. You can also generate the analyses and download them in Word format.
The results are as follows:
Results
| Quantity | Proportions | |
|---|---|---|
| Success | 175 | 0.875 |
| Failure | 25 | 0.125 |
Results
| Values | |
|---|---|
| Z Statistic | -1.178511 |
| P-value | 0.1192964 |
| Proportion of success in the sample | 0.875 |
| Alternative Hypothesis Lower than | 0.9 |
| Confidence Level | 95% |
| Lower Limit | 0 |
| Upper Limit | 0.9134655 |
The test statistic is -1.178511. As the P-value is 0.1192964 > 0.05 So, at a significance level of 5%, we have evidence that the proportion is equal to 0.9.