1. Variance test: a variance
The Chi-square test is used to analyze whether the variance of the set of data is different from the expected value.
Details:
The One Variance test assumes that the data set has distribution normal. The Null and Alternative Hypothesis are stated in terms of the variance population or standard deviation population.
Example 1:
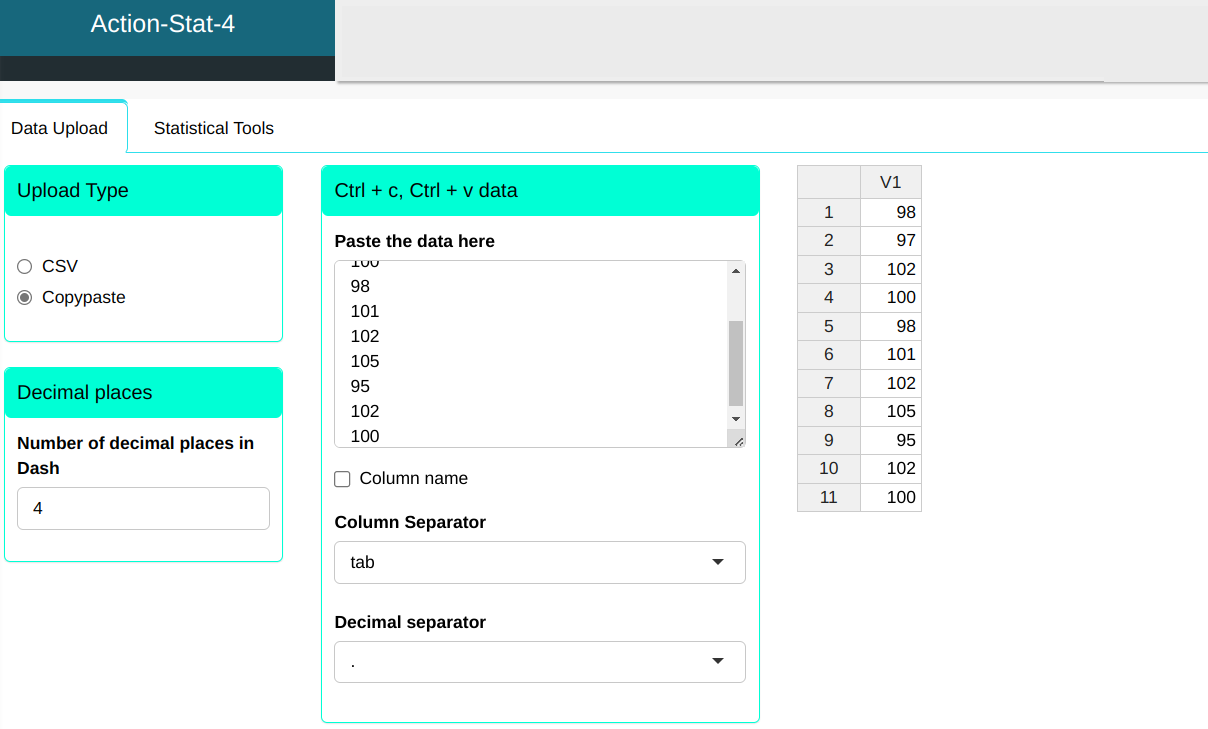
The weight of mechanical components produced by a given company is a random variable that is assumed to have a Normal distribution. It is intended study the variability in the weight of the aforementioned components. For that, a sample size 11 has been obtained.
| 98 |
| 97 |
| 102 |
| 100 |
| 98 |
| 101 |
| 102 |
| 105 |
| 95 |
| 102 |
| 100 |
we will then upload the data.
To perform one variance test. is prepared according to the configuration shown in the figure below.
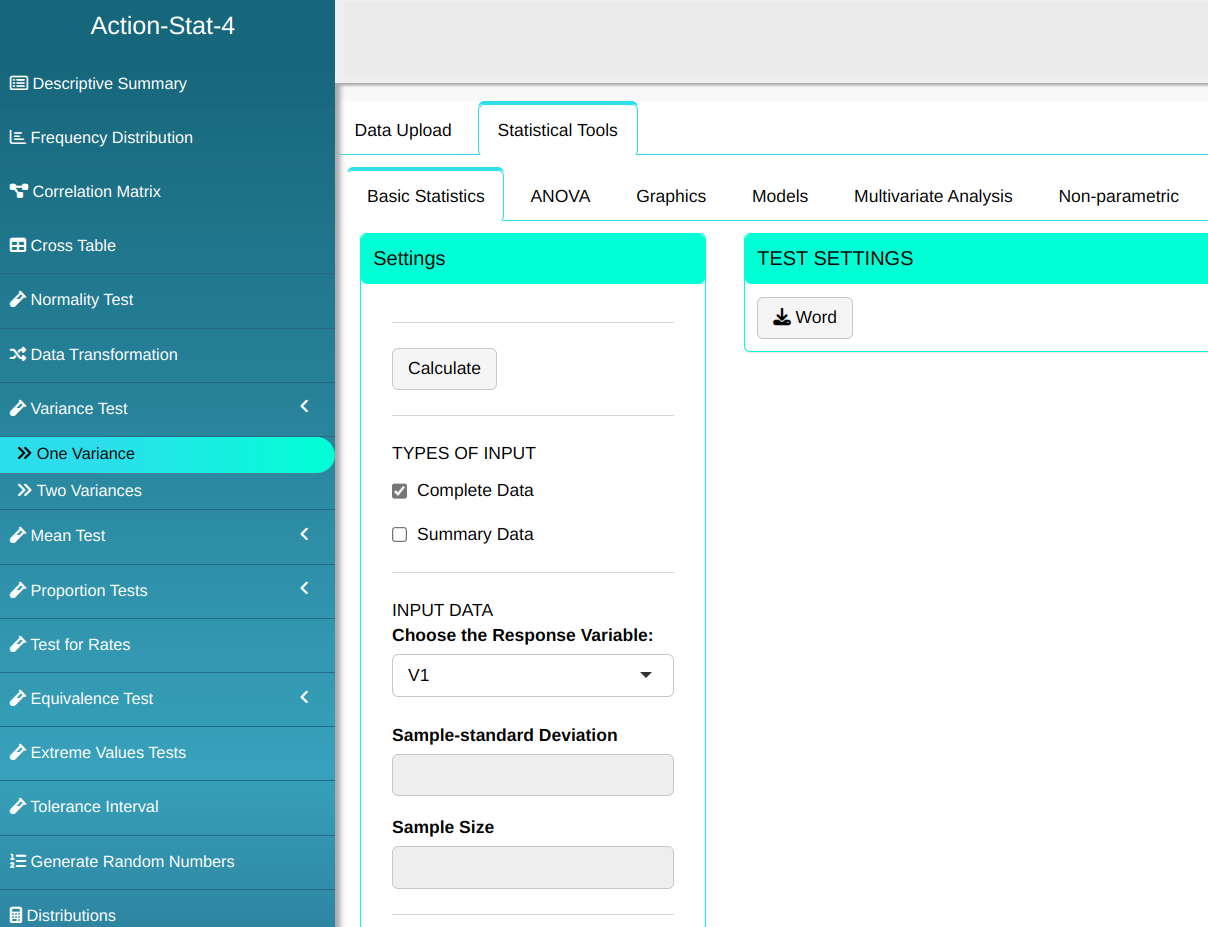

Then click Calculate to get the results. You can also generate the analyses and download them in Word format.

The results are as follows:
One-Variance Test
| Value | |
|---|---|
| Degrees of Freedom | 10 |
| Chi-Square Statistics | 11.4285 |
| P-value | 0.6502338 |
| Sample Variance | 8 |
| Sample Size | 11 |
| Alternative Hypothesis: Not equal | 7 |
| Confidence Level | 95% |
| Lower Limit | 3.905644 |
| Upper Limit | 24.63833 |
As the p-value is 0.65 > 0.05 then, at the 5% significance level, we do not reject the null hypothesis that the variance of the data is equal to 7. The 95% confidence interval for the variance is given by CI = (3.9056;24.6383).
Example 2:
An automatic filling machine is used to fill bottles with liquid detergent. In a random sample of 20 bottles, the sample variance of the fill volume was $s^2$ = 0.0153 $(\text{fluid ounce})^2$. If the variance of the fill volume exceeds 0.01 $(\text{fluid ounce})^2$, there will be an unacceptable proportion of bottles that are underfilled or overfilled. Is there evidence in the sample data to suggest that the manufacturer has a problem with underfilled or overfilled bottles? Use $\alpha$ = 0.05, assuming that the fill volume follows a normal distribution. Also, assume that a hypothesis test is being performed for the variance with the null hypothesis $H_0 : \sigma^2$ = 0.01.
To perform one variance test. is prepared according to the configuration shown in the figure below.
To perform variance test it is prepared according to the configuration shown in the figure below.
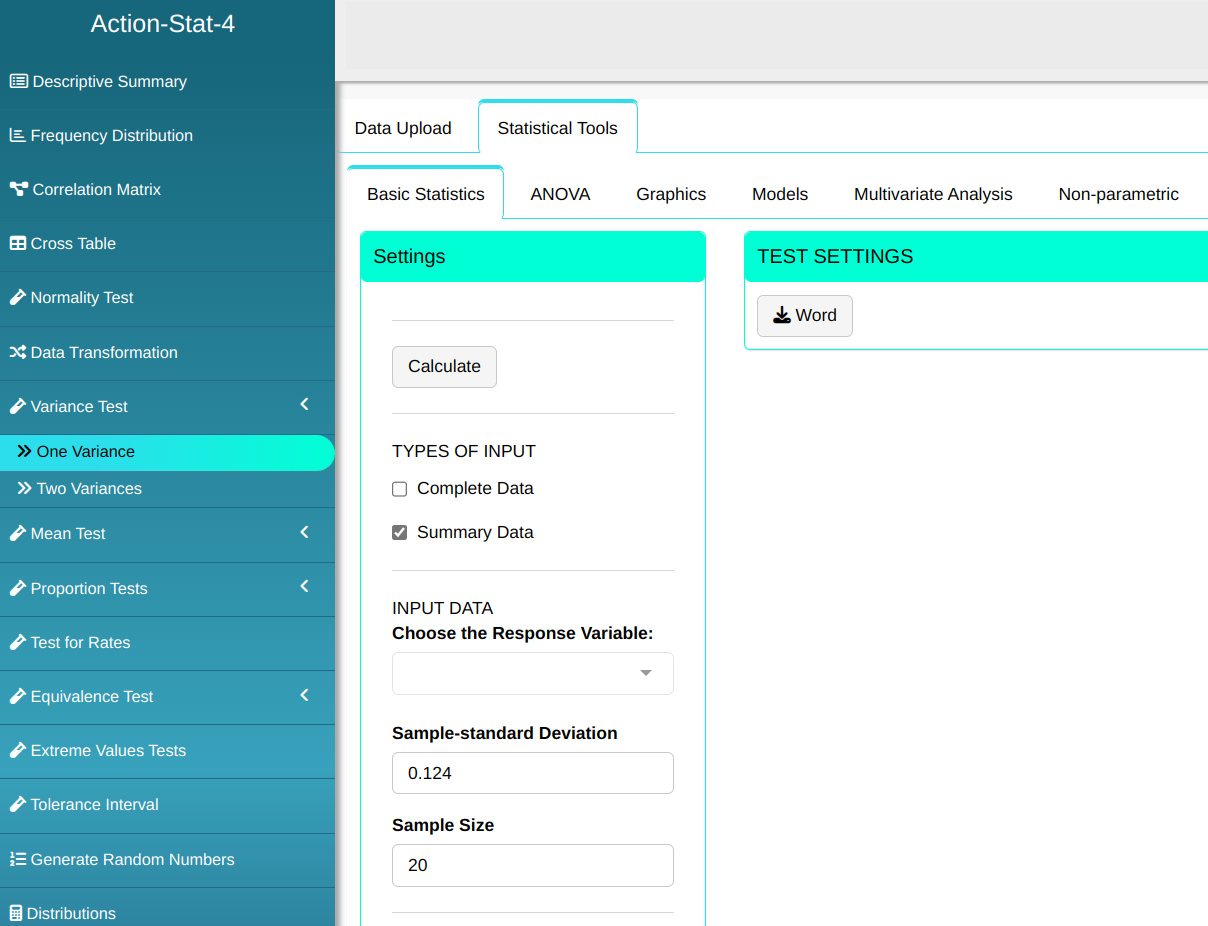

Then click Calculate to get the results. You can also generate the analyses and download them in Word format.
The results are as follows:
One-Variance Test
| Value | |
|---|---|
| Degrees of Freedom | 19 |
| Chi-Square Statistics | 29.2144 |
| P-value | 0.06268668 |
| Sample Variance | 0.015376 |
| Sample Size | 20 |
| Alternative Hypothesis: Greater than | 0.01 |
| Confidence Level | 95% |
| Lower Limit | 0.009691766 |
| Upper Limit | inf |
As the p-value is equal to 0.06268668 > 0.05 = 5%, we do not reject the null hypothesis. In other words, we have evidence that the variance does not exceed the value of 0.01.