2. Variance Test: Two Variances
The F-test is used to analyze the variance between two different sets of different sets of data and compare them using hypothesis testing.
Example 1:
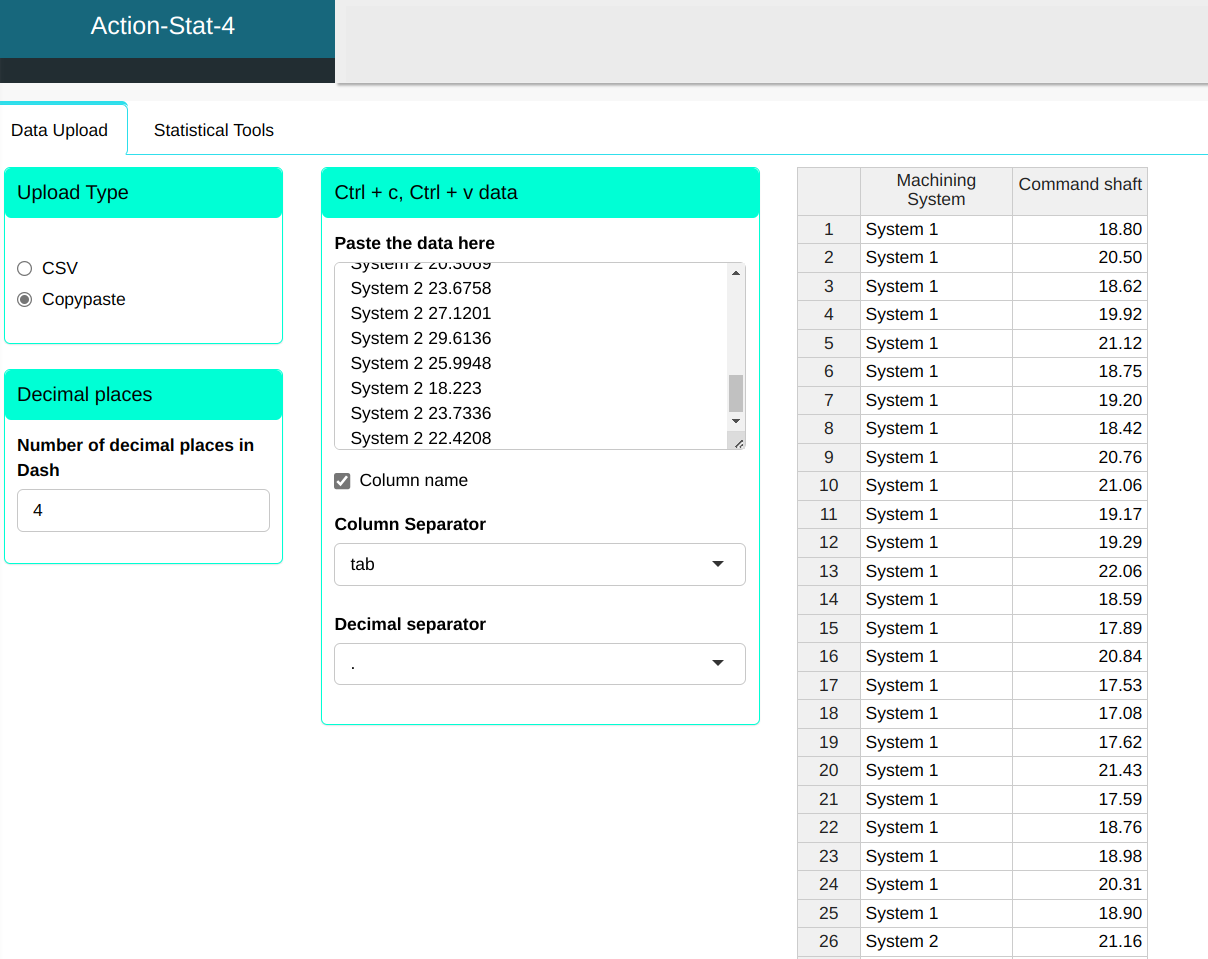
A quality analyst wants to evaluate whether there is a difference in the measurements of axes developed by two machining systems. The following table shows the measurements of two populations of the two systems which are independent and have a normal distribution. At a 95% level of confidence, is there a significant difference between the variabilities of the measurements of the command axes of the two machining systems?
| Machining System | Command shaft |
|---|---|
| System 1 | 18.7997 |
| System 1 | 20.5035 |
| System 1 | 18.6214 |
| System 1 | 19.9192 |
| System 1 | 21.117 |
| System 1 | 18.7545 |
| System 1 | 19.2026 |
| System 1 | 18.4187 |
| System 1 | 20.7641 |
| System 1 | 21.0553 |
| System 1 | 19.1688 |
| System 1 | 19.2898 |
| System 1 | 22.059 |
| System 1 | 18.5854 |
| System 1 | 17.8896 |
| System 1 | 20.8353 |
| System 1 | 17.527 |
| System 1 | 17.078 |
| System 1 | 17.6197 |
| System 1 | 21.4255 |
| System 1 | 17.5905 |
| System 1 | 18.7561 |
| System 1 | 18.9772 |
| System 1 | 20.3084 |
| System 1 | 18.8988 |
| System 2 | 21.1609 |
| System 2 | 26.1371 |
| System 2 | 21.4737 |
| System 2 | 30.9934 |
| System 2 | 22.8421 |
| System 2 | 24.4133 |
| System 2 | 20.4137 |
| System 2 | 25.5475 |
| System 2 | 21.8791 |
| System 2 | 22.6706 |
| System 2 | 24.7531 |
| System 2 | 25.7219 |
| System 2 | 22.6389 |
| System 2 | 26.2308 |
| System 2 | 26.7998 |
| System 2 | 28.4708 |
| System 2 | 26.9941 |
| System 2 | 25.1489 |
| System 2 | 24.6179 |
| System 2 | 27.0194 |
| System 2 | 25.0589 |
| System 2 | 22.1119 |
| System 2 | 20.3069 |
| System 2 | 23.6758 |
| System 2 | 27.1201 |
| System 2 | 29.6136 |
| System 2 | 25.9948 |
| System 2 | 18.223 |
| System 2 | 23.7336 |
| System 2 | 22.4208 |
We will then upload the data to the system.
Configuring according to the figure below for we will then test for two variances
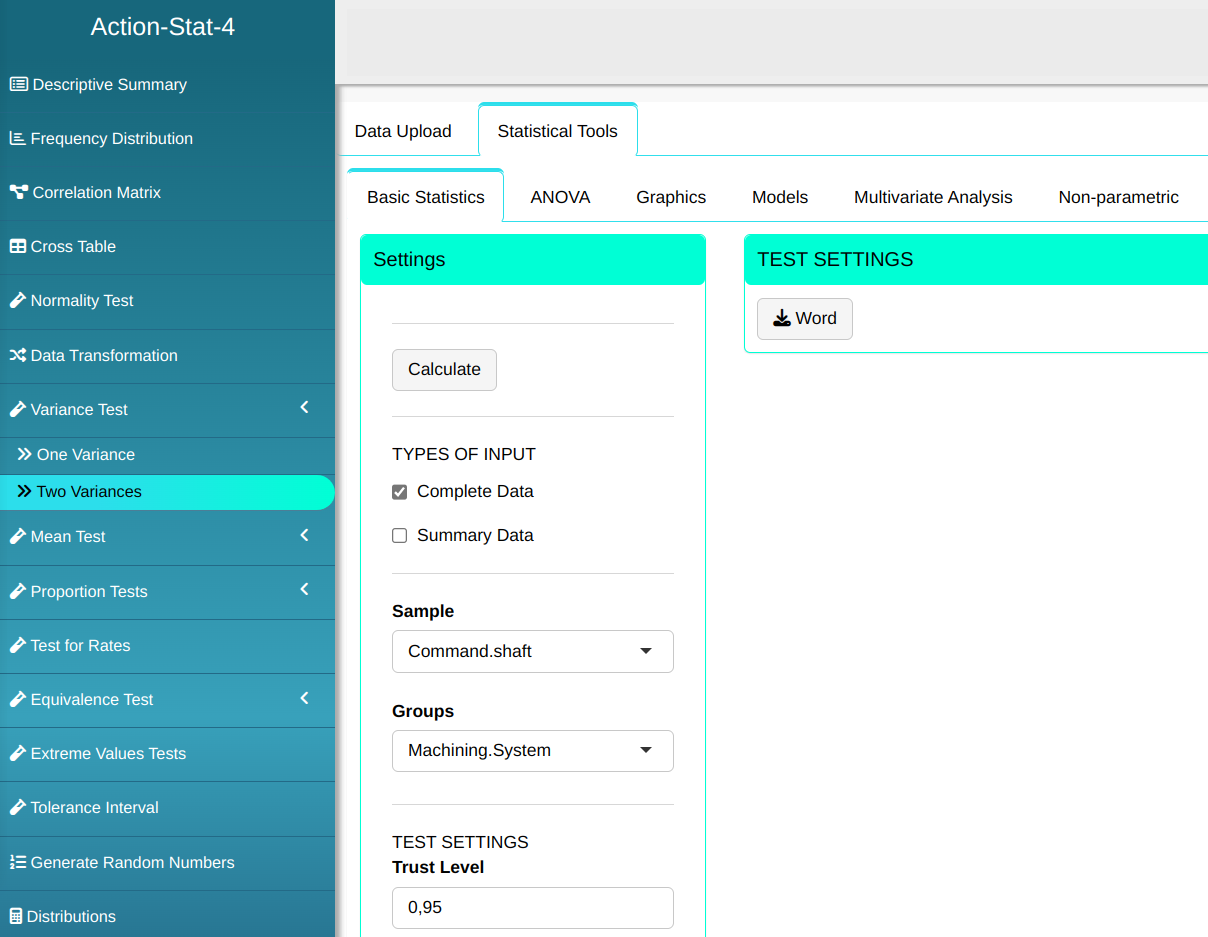

Then click Calculate to get the results. You can also generate the analyses and download them in Word format.

The results are as follows
Test for Two Variances
| Values | |
|---|---|
| F Estatistics | 0.222586 |
| Degrees of freedom (numerator) | 24 |
| Degrees of freedom (Denominator) | 29 |
| P-Value | 0.0003578537 |
| Standard Deviation - System 1 | 1.362343 |
| Standard Deviation - System 2 | 2.887603 |
| Sample size for System 1 | 25 |
| Sample size for System 2 | 30 |
| Alternative Hypothesis Different from | 1 |
| Confidence Intervals for the Variances ratio | 95% |
| Lower Limit | 0.1033358 |
| Upper Limit | 0.4935717 |
Confidence interval for the standard deviation
| Lower Limit | Standard Deviation | Upper Limit | |
|---|---|---|---|
| System 1 | 1.064 | 1.362 | 1.895 |
| System 2 | 2.300 | 2.888 | 3.882 |
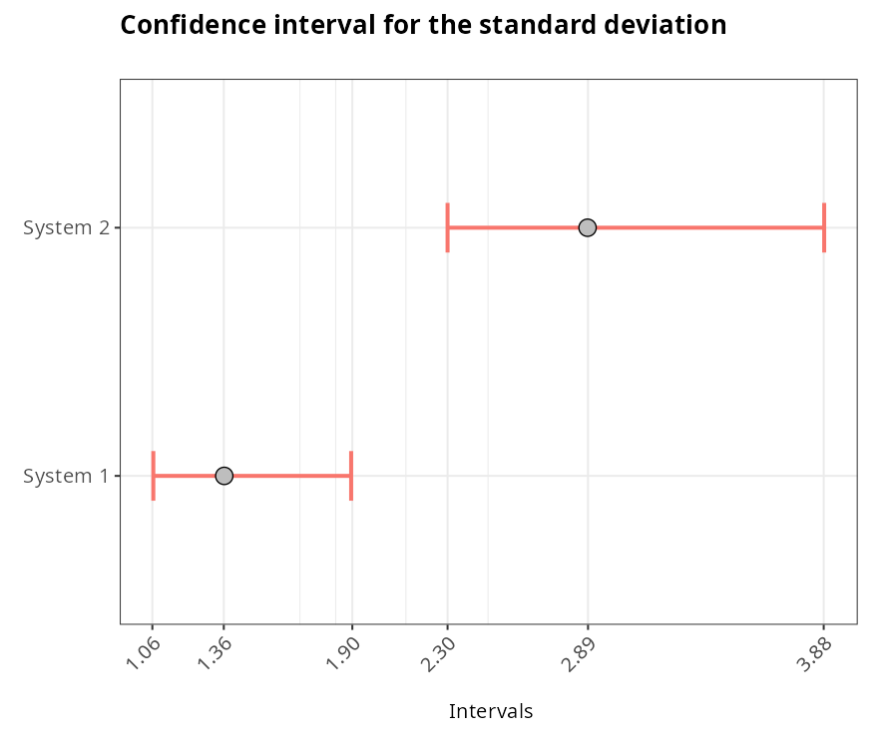
Performing the Two-Variance F-Test, we see that the p-value is 0.0003578, that is, less than 5%. Thus, we reject the hypothesis that the variances are equal.
Example 2:
A quality analyst wants to assess whether there is a difference in the measurements of command axes developed by two machining systems. The standard deviation values are 1.362346 and 2.887603 and the sample sizes are 25 and 20. At a 95% confidence level, there is a significant difference between the variability of the command axis measurements of the two machining systems?
Configuring according to the figure below for we will then test for two variances
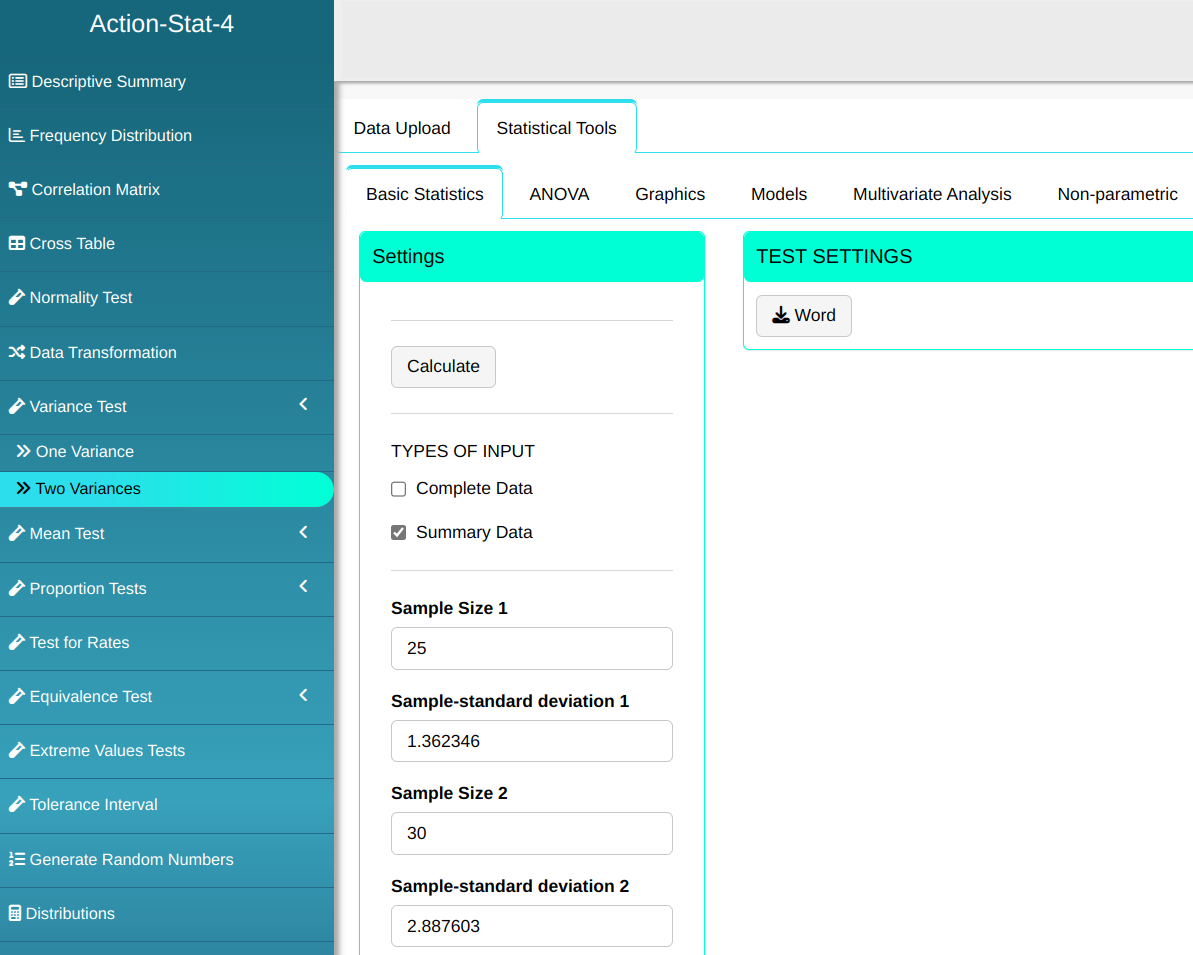

Then click Calculate to get the results. You can also generate the analyses and download them in Word format.
The results are as follows
Test for Two Variances
| Valores | |
|---|---|
| F Statistics | 0.222587 |
| Degrees of freedom (numerator) | 24 |
| Degrees of freedom (Denominator) | 19 |
| P-Value | 0.000716142 |
| Standard Deviation - Sample 1 | 1.362346 |
| Standard Deviation - Sample 2 | 2.887603 |
| Sample size 1 | 25 |
| Sample size 2 | 20 |
| Alternative Hypothesis Different from | 1 |
| Confidence Intervals for the Variances ratio | 95% |
| Lower Limit | 0.09076587 |
| Upper Limite | 0.5220008 |
Confidence Interval for the standard deviation
| Lower Limit | Standard deviation | Upper Limit | |
|---|---|---|---|
| Sample 1 | 1.0638 | 1.3623 | 1.8952 |
| Sample 2 | 2.196 | 2.8876 | 4.2176 |

Performing the F-Test - Two Variances, we see that the P-value is 0.000716142, i.e. less than 5%. Therefore, with a significance level of 5%, we reject the null hypothesis that the variances are equal.