12. Extreme Value Test - Grubbs
The Grubbs test is developed to check the presence of values extremes in sample observations.
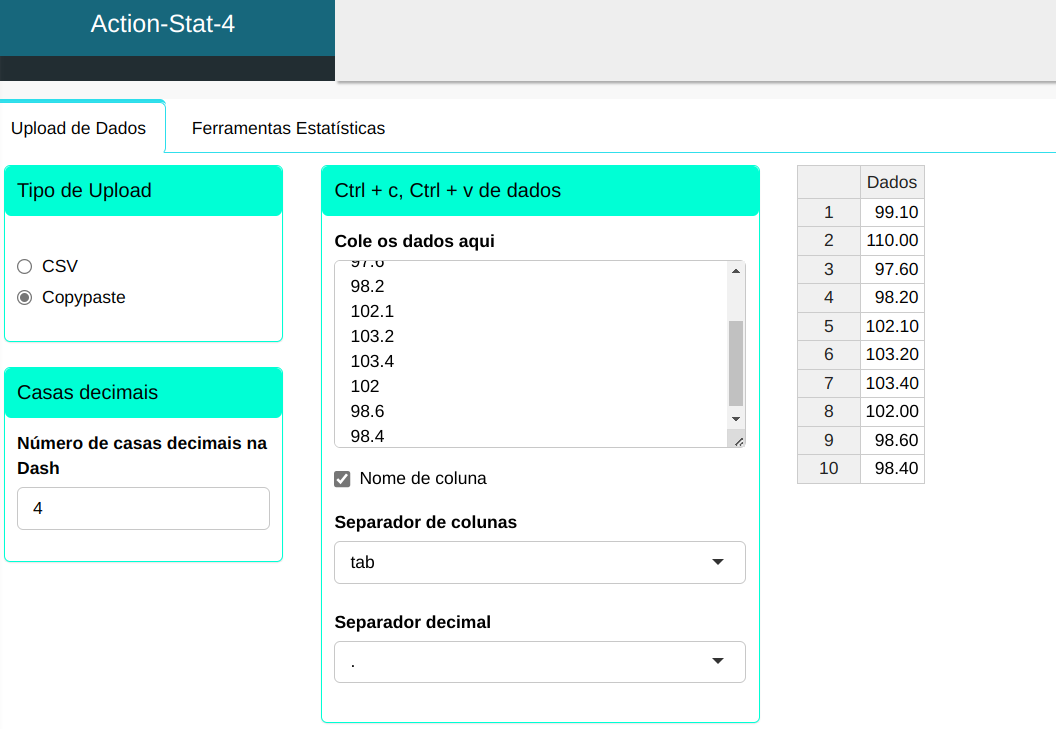
Example 1:
| Data |
|---|
| 99.1 |
| 110 |
| 97.6 |
| 98.2 |
| 102.1 |
| 103.2 |
| 103.4 |
| 102 |
| 98.6 |
| 98.4 |
We will upload the data to the system
To perform an extreme value test, the following setup is performed, as shown in the following figure.

Then click Calculate to get the results. You can also generate the analyses and download them in Word format.

The results are:
Summary of Outlier Test - Grubbs Test
| Value | |
|---|---|
| Mean | 101.260 |
| Standard Deviation | 3.781 |
| Significance level | 0.050 |
| Critical value | 2.290 |
Outlier Test Table
| Sample | Z | Status |
|---|---|---|
| 99.100 | 0.571 | ok |
| 110.000 | 2.312 | Outlier |
| 97.600 | 0.968 | ok |
| 98.200 | 0.809 | ok |
| 102.100 | 0.222 | ok |
| 103.200 | 0.513 | ok |
| 103.400 | 0.566 | ok |
| 102.00 | 0.196 | ok |
| 96.600 | 0.704 | ok |
| 98.400 | 0.756 | ok |
The result of batch 2 is considered an outlier, according to the analysis performed in the Action software. The statistic $Z$ obtained was 2.312, compared to the critical value $Z_c$ of 2.29 for n=10. Since $Z>Z_c$, it is concluded that the result of batch 2 is an outlier.
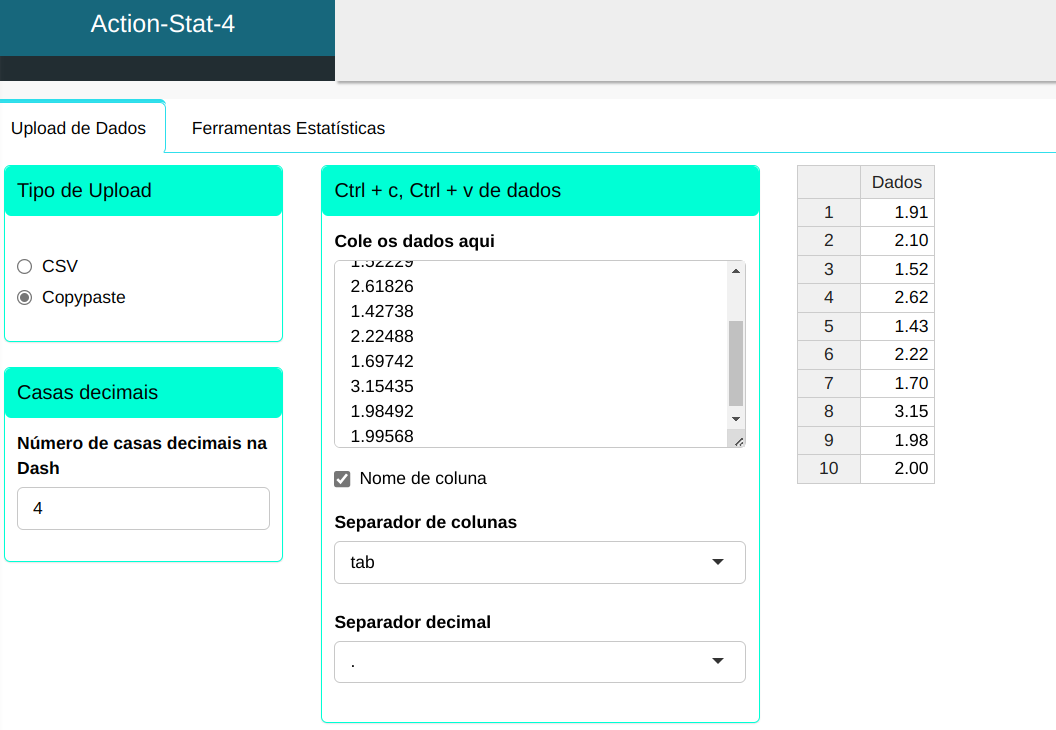
Example 2:
| Data |
|---|
| 1.90642 |
| 2.10288 |
| 1.52229 |
| 2.61826 |
| 1.42738 |
| 2.22488 |
| 1.69742 |
| 3.15435 |
| 1.98492 |
| 1.99568 |
We will upload the data to the system
To perform an extreme value test, the following setup is performed, as shown in the following figure.
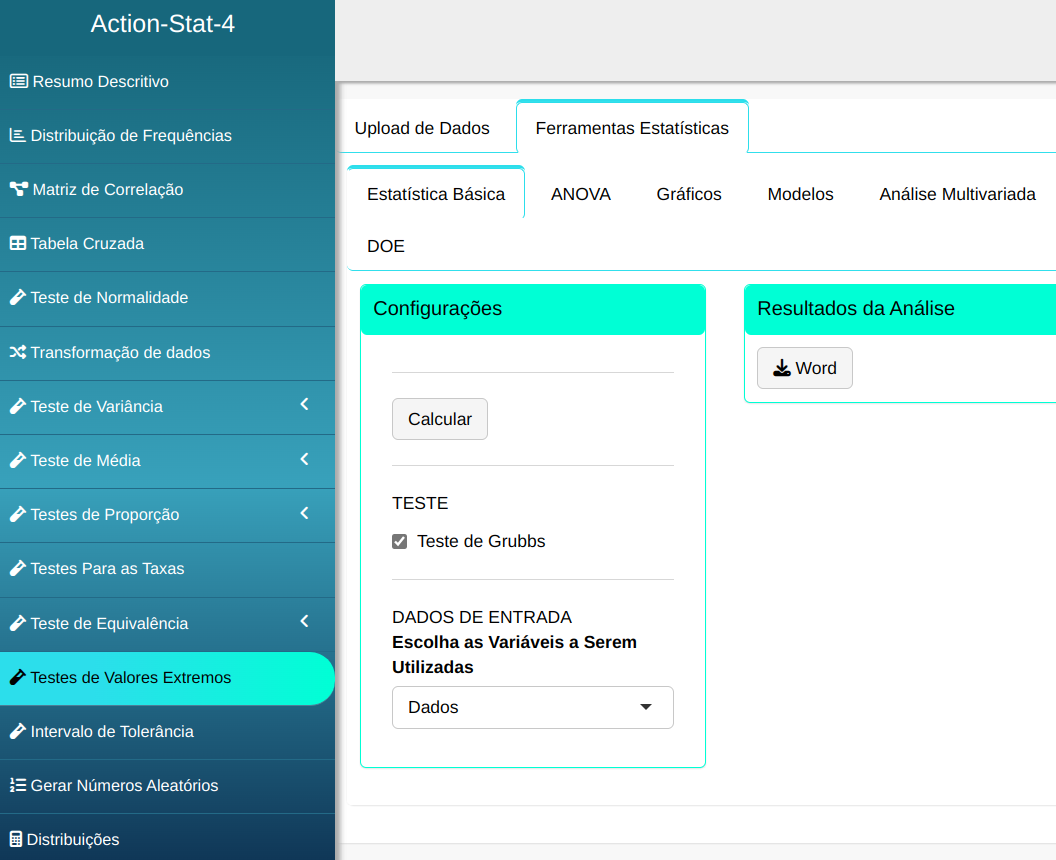
Then click Calculate to get the results. You can also generate the analyses and download them in Word format.
The results are:
Summary of Outlier Test - Grubbs Test
| Value | |
|---|---|
| Mean | 2,063 |
| Standard Deviation | 0.516 |
| Significance level | 0.050 |
| Critical value | 2.290 |
Outlier Test Table
| Sample | Z | Status |
|---|---|---|
| 1.906 | 0.305 | ok |
| 2.103 | 0.076 | ok |
| 1.522 | 1.050 | ok |
| 2.618 | 1.076 | ok |
| 1.427 | 1.234 | ok |
| 2.225 | 0.313 | ok |
| 1.697 | 0.710 | ok |
| 3.154 | 2.116 | ok |
| 1985 | 0.152 | ok |
| 1.996 | 0.131 | ok |
According to the analysis carried out with the Action software, it was concluded that there were no outliers.