2. Performance Indices - Pp/Cp (Normal Data)
This tool is used to evaluate the capacity of a process using the normal probability distribution.
Example 1:
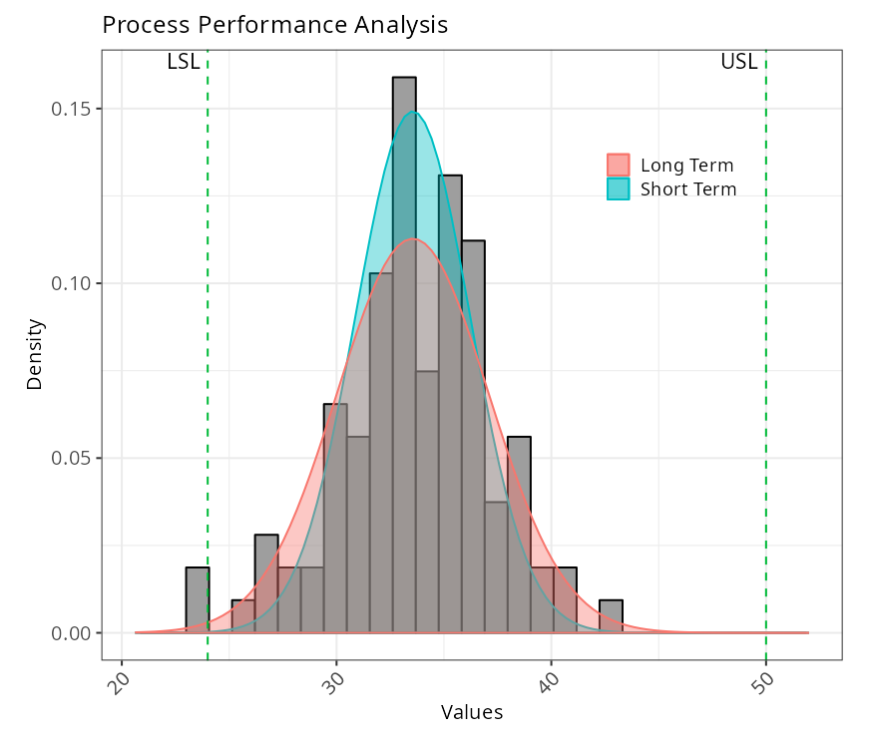
The data set used in this example was taken from a statistical process with the specifications 37±13. We have that LSL = 24; μ = 37; USL = 50.
| Sample | Reading1 | Reading2 | Reading3 | Reading4 | Reading5 |
|---|---|---|---|---|---|
| 1 | 36 | 35 | 34 | 33 | 32 |
| 2 | 31 | 31 | 34 | 32 | 30 |
| 3 | 30 | 30 | 32 | 30 | 32 |
| 4 | 32 | 33 | 33 | 32 | 35 |
| 5 | 32 | 34 | 37 | 37 | 35 |
| 6 | 32 | 32 | 31 | 33 | 33 |
| 7 | 33 | 33 | 36 | 32 | 31 |
| 8 | 23 | 33 | 36 | 35 | 36 |
| 9 | 43 | 36 | 35 | 24 | 31 |
| 10 | 36 | 35 | 36 | 41 | 41 |
| 11 | 34 | 38 | 35 | 34 | 38 |
| 12 | 36 | 38 | 39 | 39 | 40 |
| 13 | 36 | 40 | 35 | 26 | 33 |
| 14 | 36 | 35 | 37 | 34 | 33 |
| 15 | 30 | 37 | 33 | 34 | 35 |
| 16 | 28 | 31 | 33 | 33 | 33 |
| 17 | 33 | 30 | 34 | 33 | 35 |
| 18 | 27 | 28 | 29 | 27 | 30 |
| 19 | 35 | 36 | 29 | 27 | 32 |
| 20 | 33 | 35 | 35 | 39 | 36 |
We will upload the data to the system.
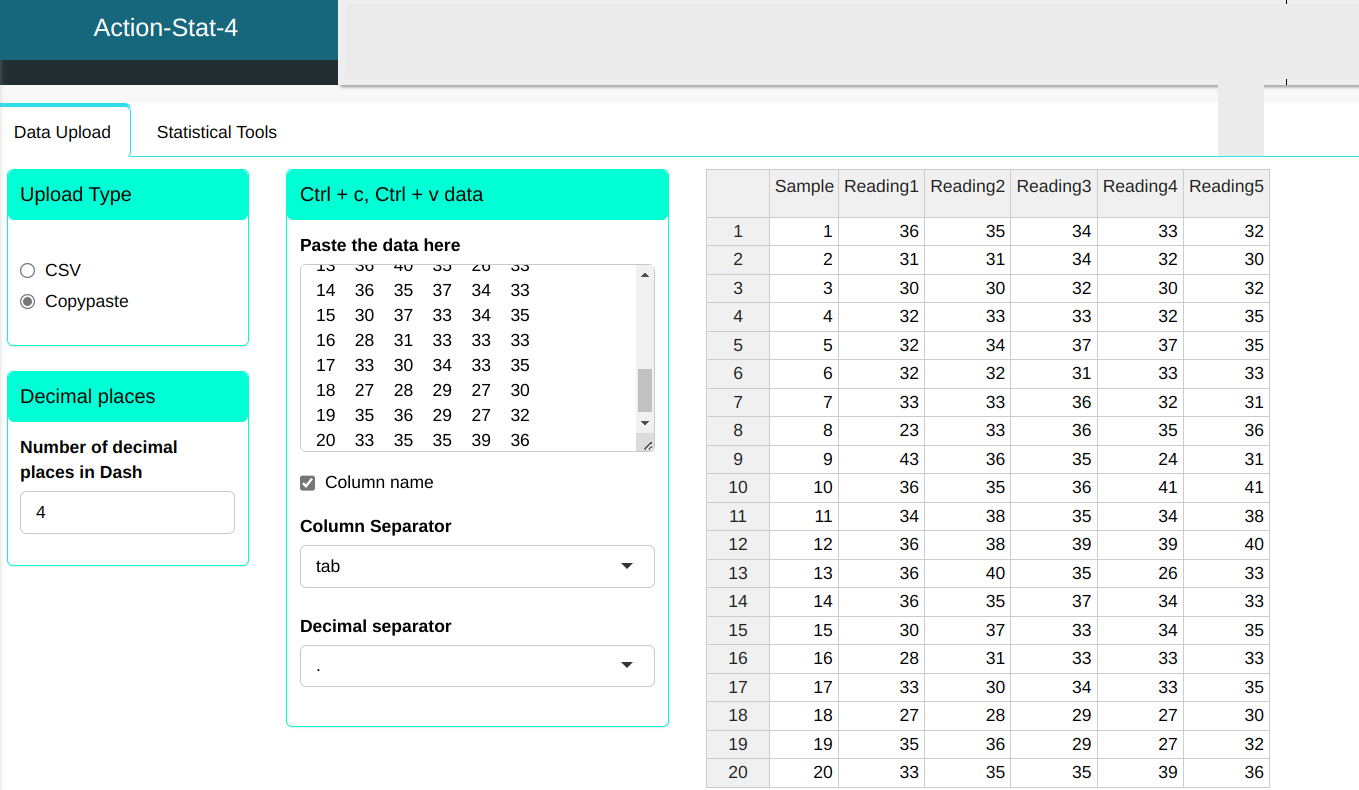
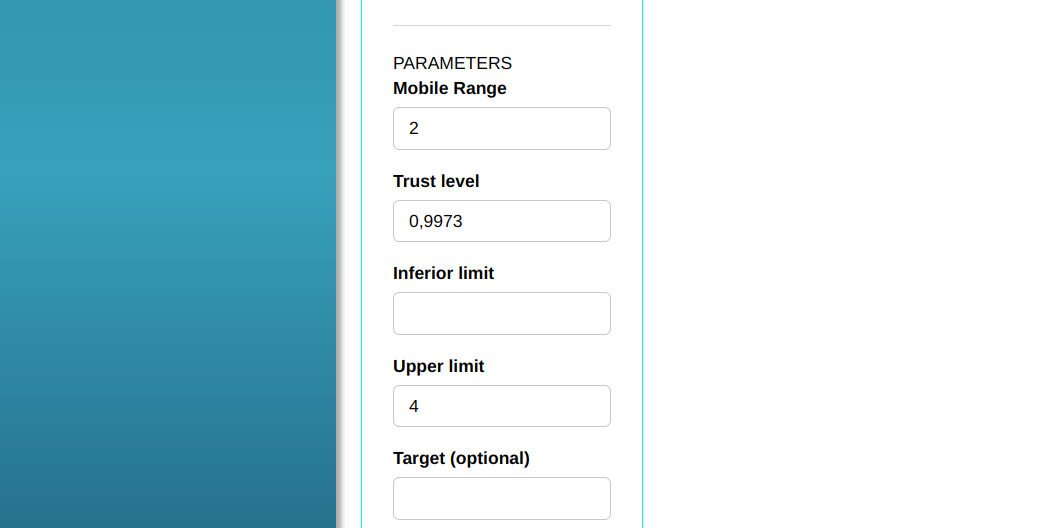
Configuring as shown in the figure below to perform the analysis.
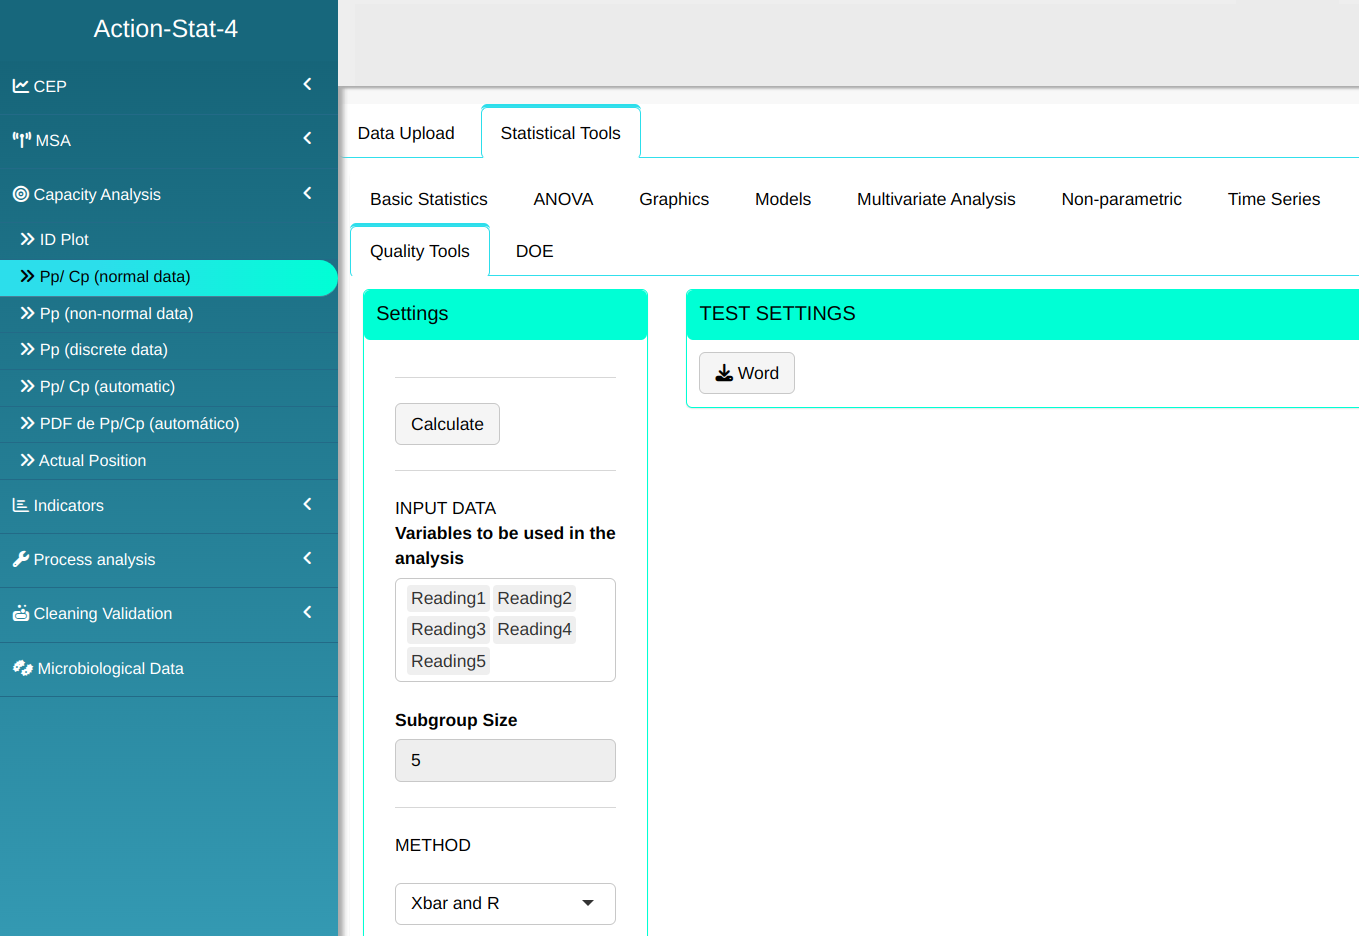


- In Select tests we can choose the tests we want to perform.
Then click Calculate to get the results. You can also generate the analyses and download them in Word format.

The results are:
Specifications
| Valor | |
|---|---|
| Sample: | 100 |
| Lower Limit | 24 |
| Upper Limit | 50 |
Estimates
| Estimate | |
|---|---|
| Mean | 33.550 |
| Standard Deviation (Short term) | 2.9724 |
| Standard Deviation (Long term) | 3.5377 |
Performace Indices (Long term)
| Performace Indices (Total Variability) | |
|---|---|
| PP | 1.225 |
| PPL | 0.8998 |
| PPU | 1.550 |
| PPK | 0.8998 |
Capability Indices (Short term)
| Capacity Indexes (Variability Inherent) | |
|---|---|
| CP | 1.4579 |
| CPL | 1.071 |
| CPU | 1.8448 |
| CPK | 1.071 |
Observed Indices
| Observed Indices | |
|---|---|
| PPM < LSL | 10000 |
| PPM > USL | 0 |
| Total PPM | 10000 |
Expected Indices (Long term)
| Expected Indice (Total Variability) | |
|---|---|
| PPM < LSL | 3471.964 |
| PPM > USL | 1.660 |
| Total PPM | 3473.624 |
Expected Indices (Short term)
| Expected Indicess (Inherent Variability) | |
|---|---|
| PPM < LSL | 656.9802 |
| PPM > USL | 0.0156 |
| Total PPM | 656.9958 |
SIGMA LEVEL
| SIGMA Level | |
|---|---|
| Zbench (long term) | 2.6994 |
| Zbench (Short term) | 3.2129 |
| Zshift | 1.500 |
| Sigma metrics | 4.1994 |
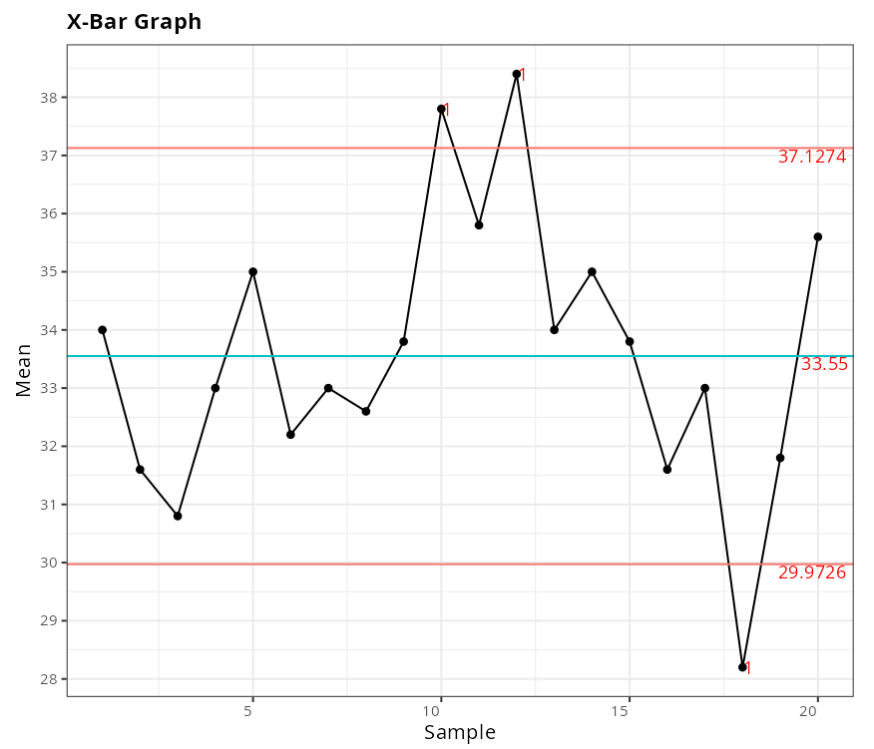
Out-of-control points - X-Bar Graph
| Subgrupo | Valor | Teste |
|---|---|---|
| 10 | 37.8 | 1 point more than 3 Sigmas from the center line |
| 12 | 38.4 | 1 point more than 3 Sigmas from the center line |
| 18 | 28.2 | 1 point more than 3 Sigmas from the center line |
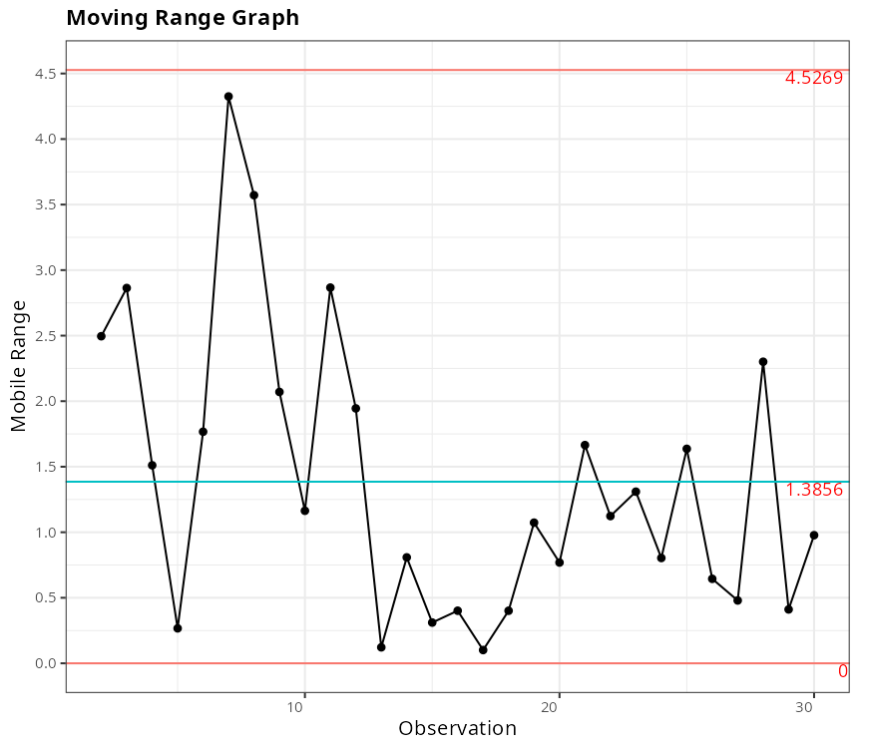
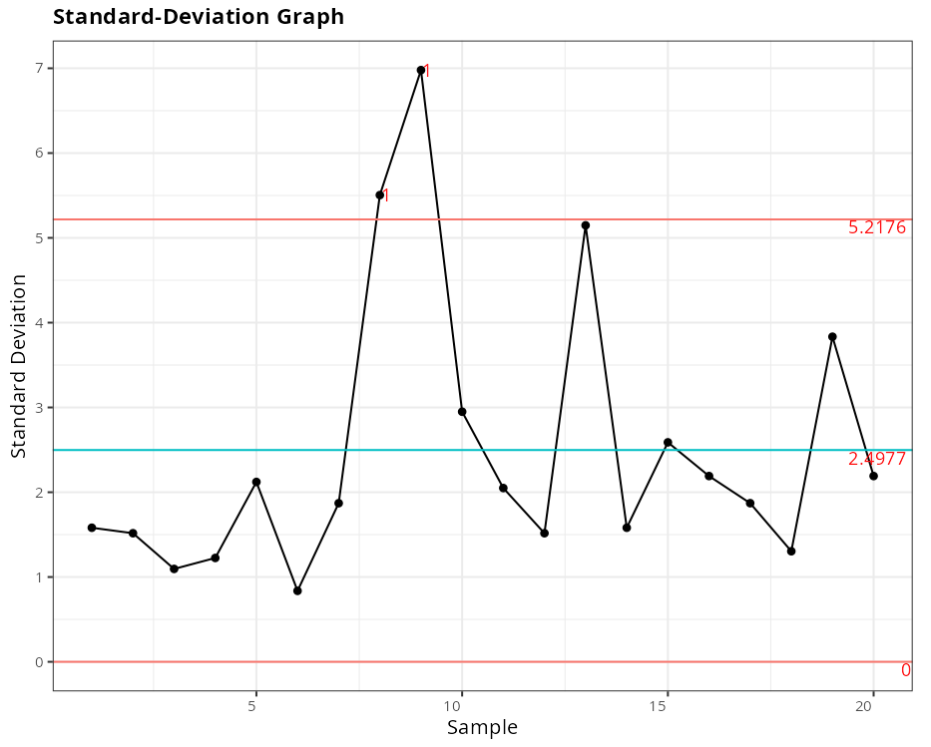
Out-of-control points - Standad-Deviation Graph
| Subgroup | Value | Test |
|---|---|---|
| 8 | 5.5045 | 1 point greater than 3 Sigmas from the center line |
| 9 | 6.9785 | 1 point greater than 3 Sigmas from the center line |
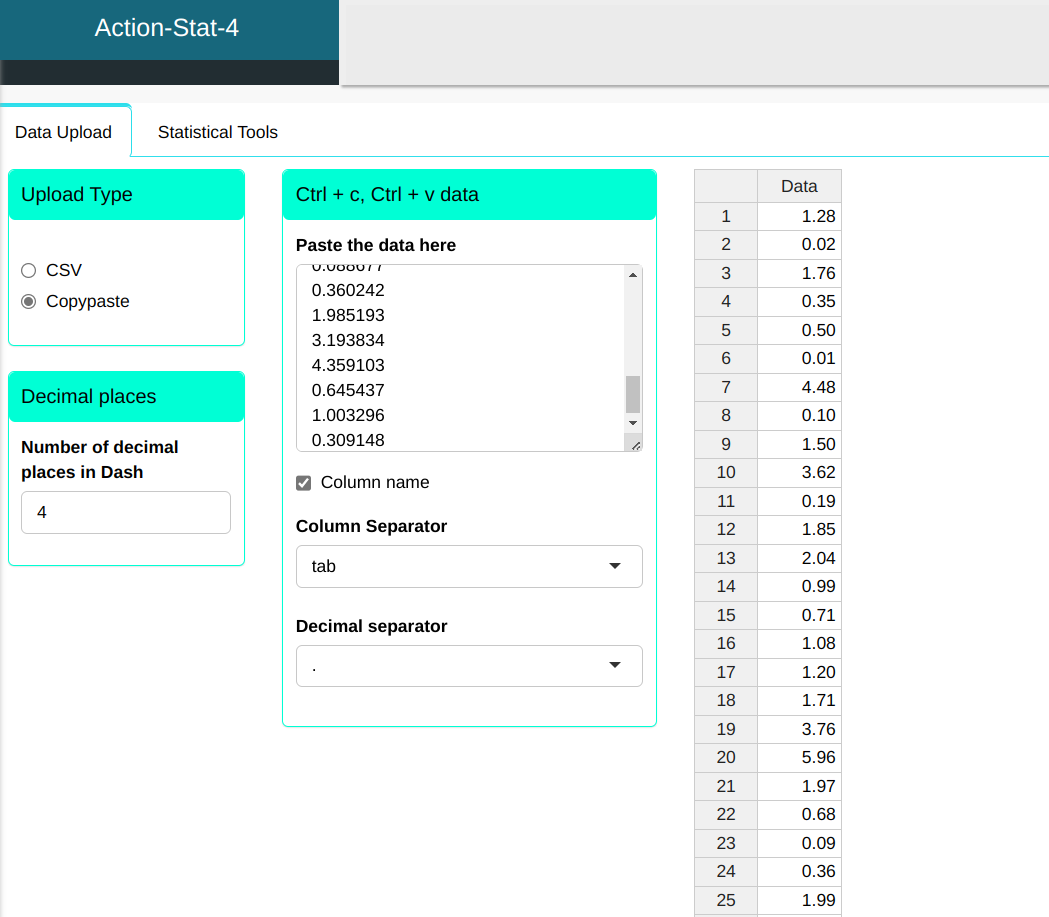
Exemplo 2:
Consider a process at the start of development, where we collected a sample of 30 units. These units were measured and the data is shown in the table below. For this case we have USL = 4.
| Data |
|---|
| 1.278258 |
| 0.017442 |
| 1.763441 |
| 0.350306 |
| 0.499543 |
| 0.009417 |
| 4.47932 |
| 0.096113 |
| 1.503284 |
| 3.618302 |
| 0.19454 |
| 1.845016 |
| 2.035204 |
| 0.992143 |
| 0.714152 |
| 1.084793 |
| 1.195303 |
| 1.707286 |
| 3.757334 |
| 5.958947 |
| 1.973829 |
| 0.680619 |
| 0.088677 |
| 0.360242 |
| 1.985193 |
| 3.193834 |
| 4.359103 |
| 0.645437 |
| 1.003296 |
| 0.309148 |
We will upload the data to the system.
Configuring as shown in the figure below to perform the analysis.
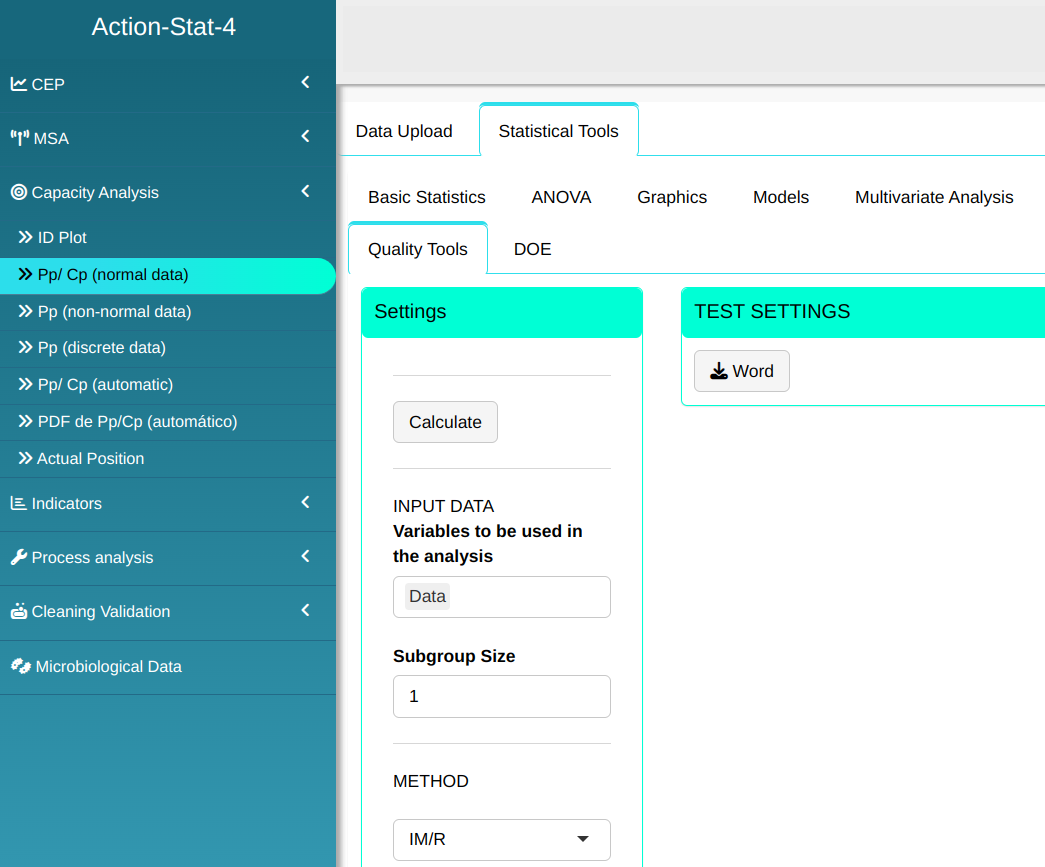
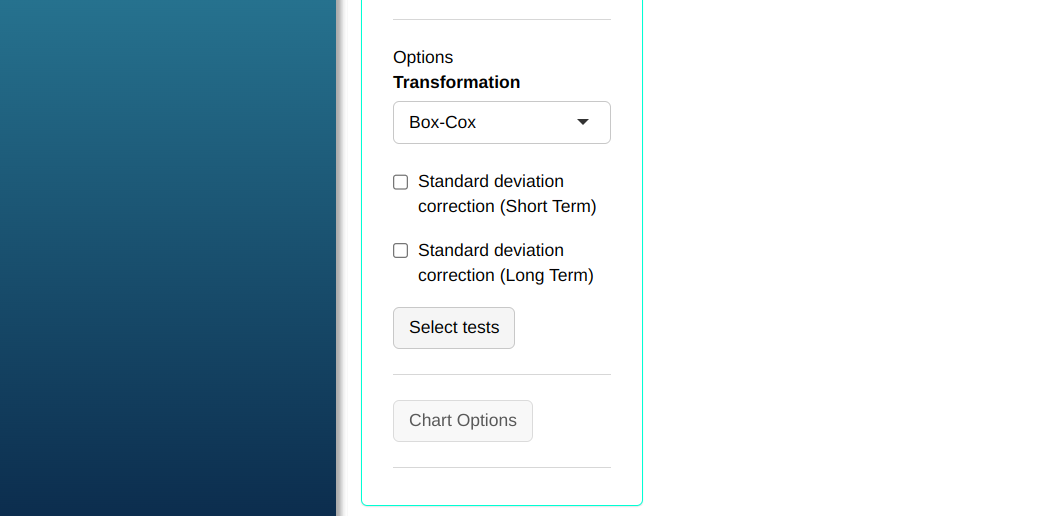
- In “select tests” we can choose the tests we want to carry out.
Then click Calculate to get the results. You can also generate the analyses and download them in Word format.
The results are:
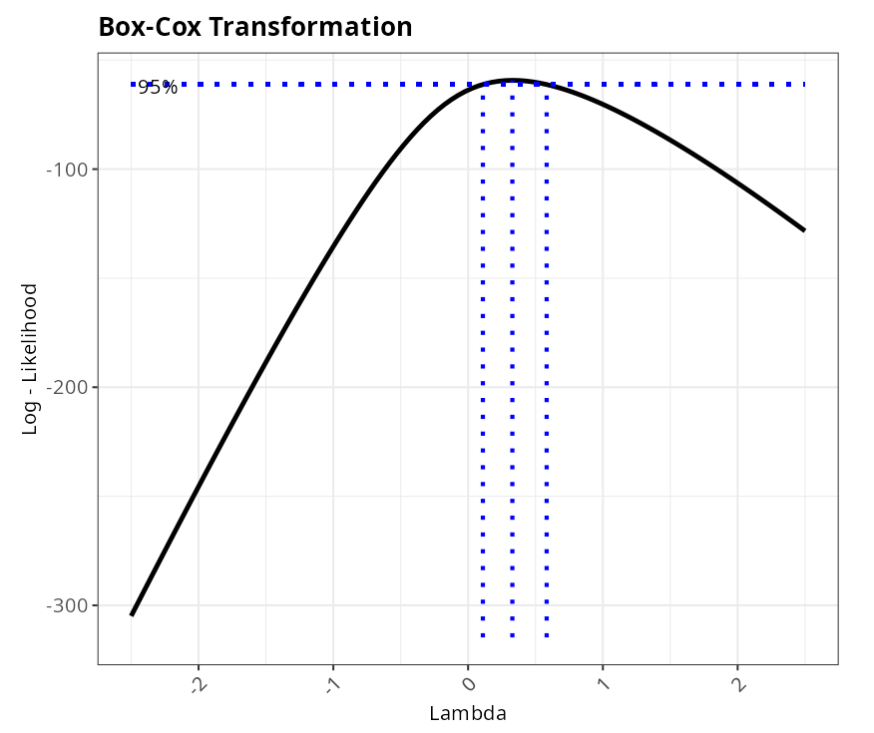
| Box-Cox Transformation | ||
| V1 | |
|---|---|
| Lambda | 0.328 |
| P-Value (Anderson-Darling) | 0.922 |
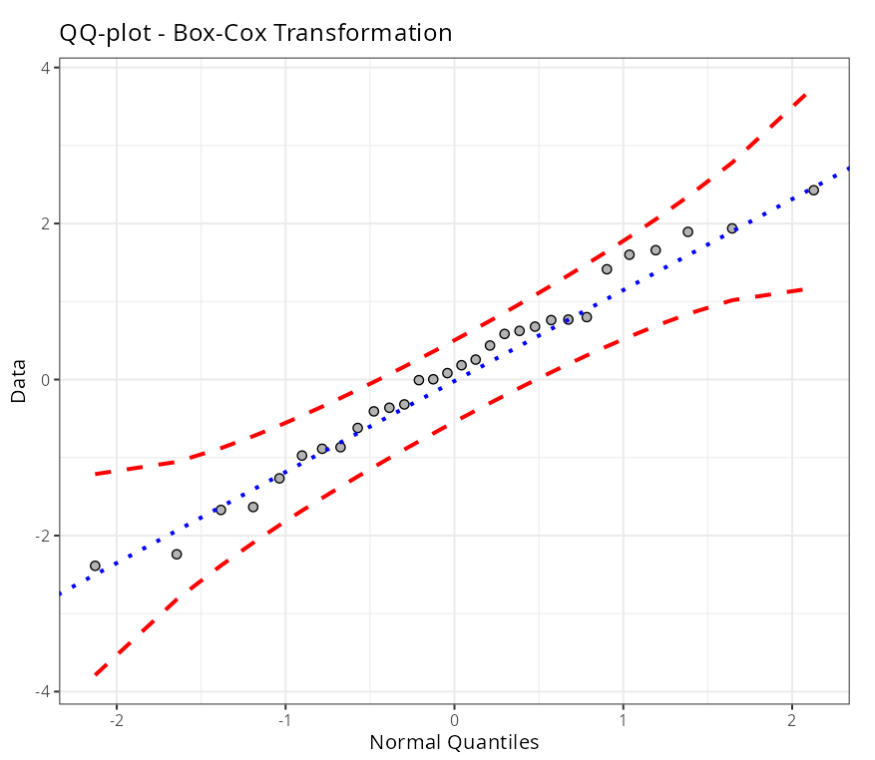
Transformed Data
| Data |
|---|
| 0.256 |
| -2.240 |
| 0.623 |
| -0.887 |
| -0.621 |
| -2.388 |
| 1.937 |
| -1.634 |
| 0.436 |
| 1.600 |
| -1.267 |
| 0.678 |
| 0.800 |
| -0.008 |
| -0.319 |
| 0.082 |
| 0.184 |
| 0.585 |
| 1.658 |
| 2.427 |
| 0.762 |
| -0.361 |
| -1.671 |
| -0.868 |
| 0.769 |
| 1.414 |
| 1.893 |
| -0.408 |
| 0.003 |
| -0.974 |
Specifications
| Value | ||
|---|---|---|
| 1 | Sample: | 30 |
| 3 | Upper Limit | 1.75557675336065 |
Estimates
| Estimates | |
|---|---|
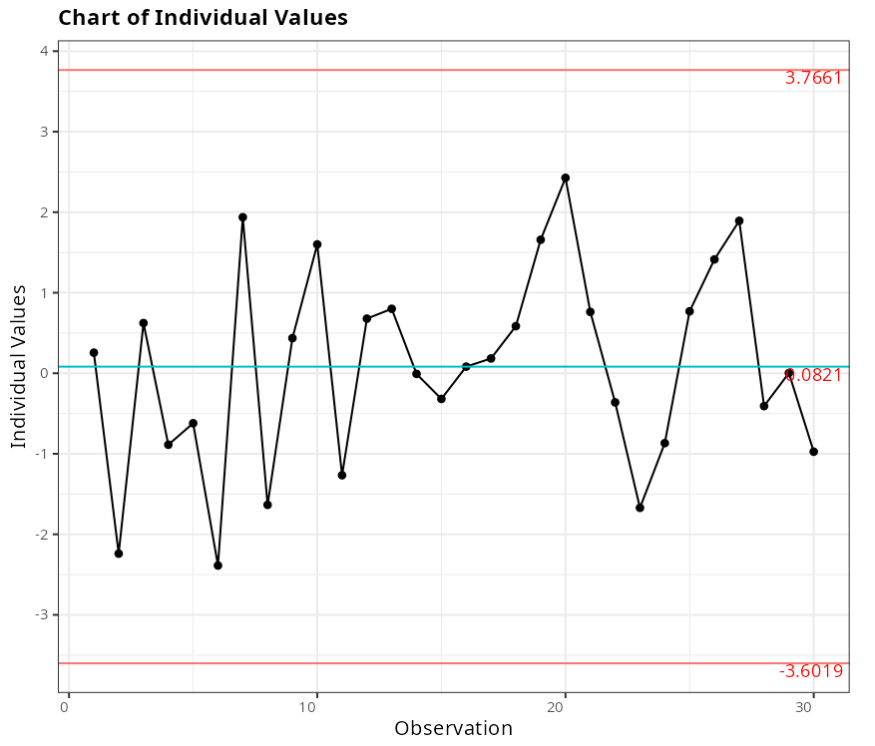
| Mean | 0.082 |
| Standard Deviation (Short term) | 1.228 |
| Standard Deviation (Long term) | 1.241 |
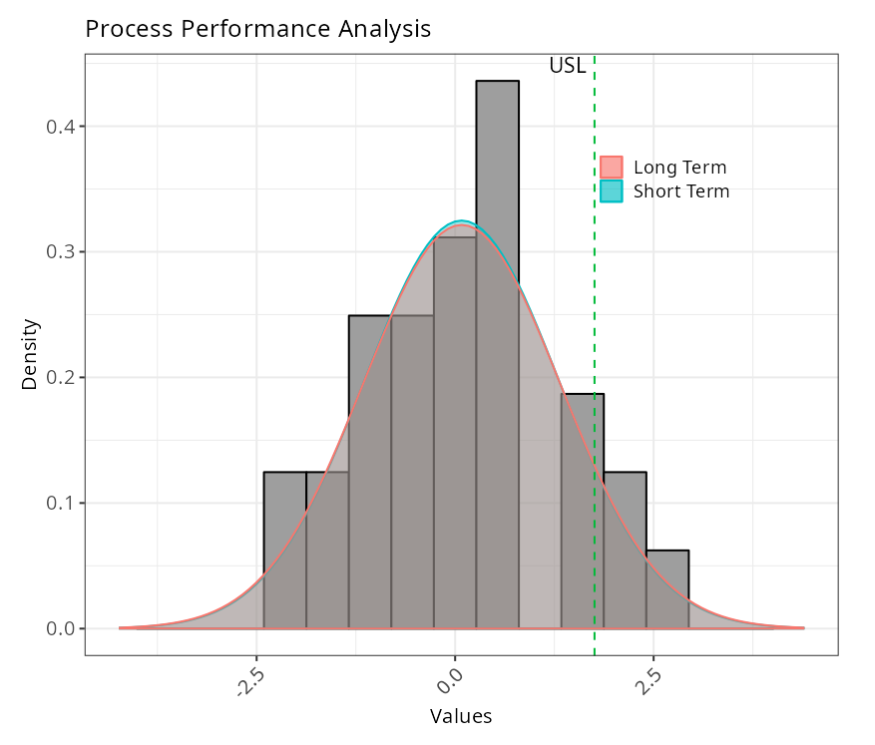
Performance Indices (Long Term)
| Performance Indices (Total Variability) | |
|---|---|
| PPU | 0.449 |
| PPK | 0.449 |
Capability Indices (Short term)
| Capacity Indexes (Variability Inherent) | |
|---|---|
| CPU | 0.454 |
| CPK | 0.454 |
Observed Indices
| Observed Indices | |
|---|---|
| PPM > USL | 100.000 |
| Total PPM | 100.000 |
Expected Indices (Long term)
| Expected Indices (Total Variability) | |
|---|---|
| PPM > USL | 88813.8411 |
| Total PPM | 88813.8411 |
Expected Indices (Short term)
| Expected Indices (Inherent Variability) | |
|---|---|
| PPM > USL | 86477.2784 |
| Total PPM | 86477.2784 |
SIGMA LEVEL
| SIGMA LEVEL | |
|---|---|
| Zbench (long term) | 1.348 |
| Zbench (short term) | 1.363 |
| Zshift | 1.500 |
| Sigma metric | 2.848 |