6. Real Position
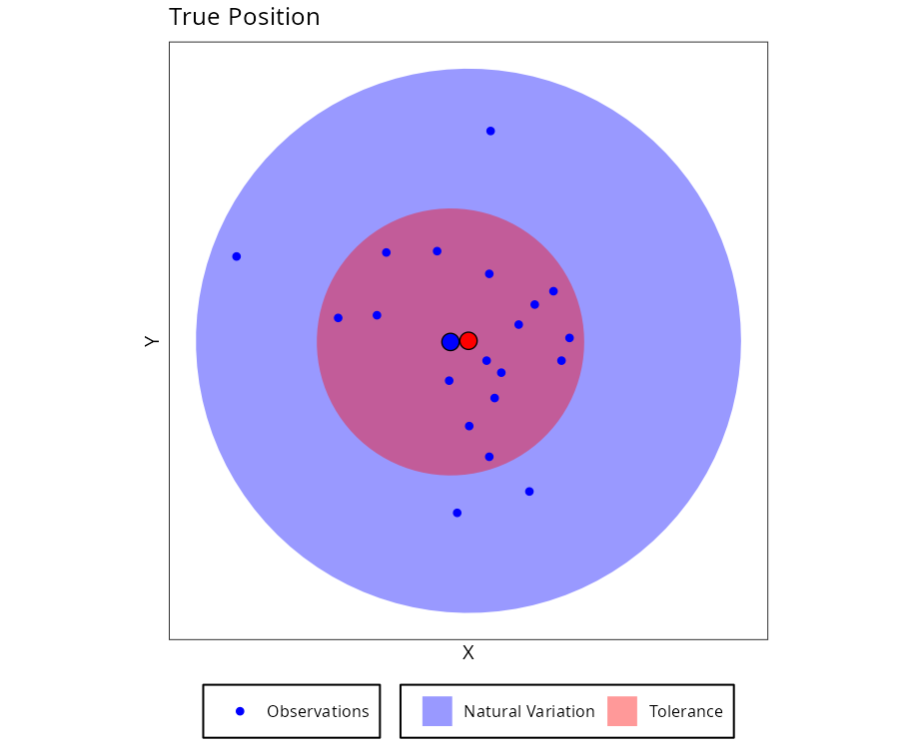
In many cases, we are interested in evaluating the capacity of a production process on the position of a given characteristic. In this case, in general, we have a circular tolerance region for this feature. Therefore, there is a need for a suitable model to assess such capacity.
Example:
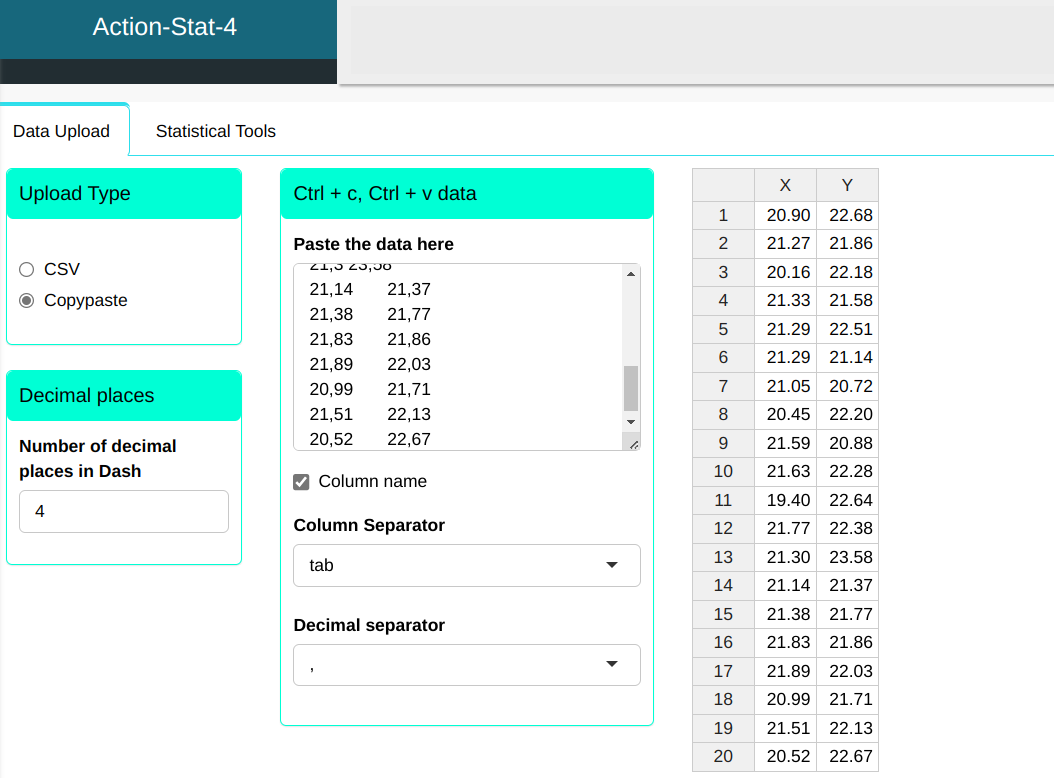
We are interested in evaluating the capacity of a production process about the position of the center of the hole of a piece. The data is shown in the following table.
| X | Y |
|---|---|
| 20.90 | 22.68 |
| 21.27 | 21.86 |
| 20.16 | 22.18 |
| 21.33 | 21.58 |
| 21.29 | 22.51 |
| 21.29 | 21.14 |
| 21.05 | 20.72 |
| 20.45 | 22.20 |
| 21.59 | 20.88 |
| 21.63 | 22.28 |
| 19.40 | 22.64 |
| 21.77 | 22.38 |
| 21.30 | 23.58 |
| 21.14 | 21.37 |
| 21.38 | 21.77 |
| 21.83 | 21.86 |
| 21.89 | 22.03 |
| 20.99 | 21.71 |
| 21.51 | 22.13 |
| 20.52 | 22.67 |
We will upload the data to the system.
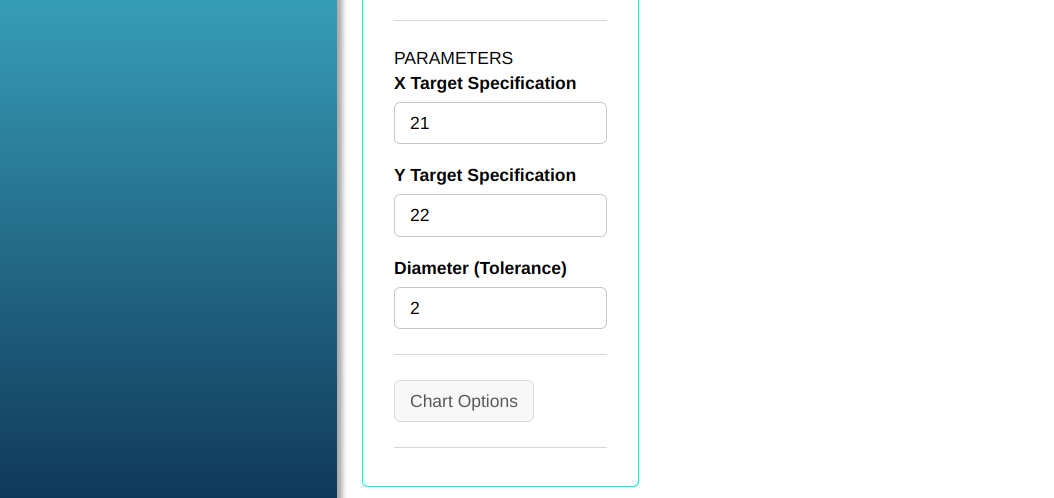
Setting as shown in the figure below to perform the analysis
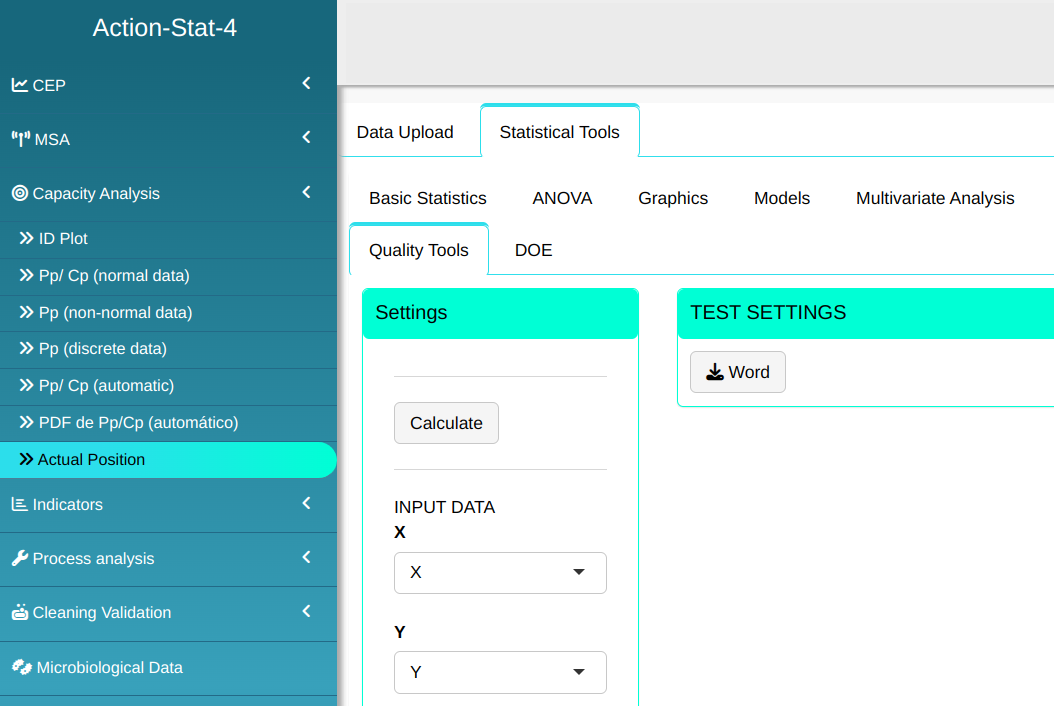
Then click Calculate we obtain the results. You can also generate the analyses and download them in Word format.

The results are:
Estimates Table
| X | Y | |
|---|---|---|
| Mean | 21.134 | 22.009 |
| Standard Deviation | 0.613 | 0.679 |
Capability Indices
| Process values | |
|---|---|
| Natural Variation region | 13.0521 |
| Tolerance Area | 3.1416 |
| PCp | 0.2407 |
| PCpk | 0.2118 |