2. Graph by Variables with Subgrou
“ACTION” provides the Charts by Variables with Subgroups tool that allows you to generate Mean and Amplitude ($\overline{X}$ and R) Mean and Standard Deviation ($\overline{X}$ and S) graph and Individual Values Graphs with Variation Between and Within Groups (I-MR-R or I-MR-S).
Example 1:
Let’s consider sample data on the length of pieces in subgroups of size 5.
| Sample | X1 | X2 | X3 | X4 | X5 |
|---|---|---|---|---|---|
| 1 | 0.65 | 0.7 | 0.65 | 0.65 | 0.85 |
| 2 | 0.75 | 0.85 | 0.75 | 0.85 | 0.65 |
| 3 | 0.75 | 0.8 | 0.8 | 0.7 | 0.75 |
| 4 | 0.6 | 0.7 | 0.7 | 0.75 | 0.65 |
| 5 | 0.7 | 0.75 | 0.65 | 0.85 | 0.8 |
| 6 | 0.6 | 0.75 | 0.75 | 0.85 | 0.7 |
| 7 | 0.75 | 0.8 | 0.65 | 0.75 | 0.7 |
| 8 | 0.6 | 0.7 | 0.8 | 0.75 | 0.75 |
| 9 | 0.65 | 0.8 | 0.85 | 0.85 | 0.75 |
| 10 | 0.6 | 0.7 | 0.6 | 0.8 | 0.65 |
| 11 | 0.8 | 0.75 | 0.7 | 0.8 | 0.7 |
| 12 | 0.85 | 0.75 | 0.85 | 0.65 | 0.7 |
| 13 | 0.7 | 0.7 | 0.75 | 0.75 | 0.7 |
| 14 | 0.65 | 0.7 | 0.85 | 0.75 | 0.6 |
| 15 | 0.9 | 0.8 | 0.8 | 0.75 | 0.85 |
| 16 | 0.75 | 0.8 | 0.75 | 0.8 | 0.65 |
| 17 | 0.75 | 0.7 | 0.85 | 0.7 | 0.8 |
| 18 | 0.75 | 0.7 | 0.6 | 0.7 | 0.6 |
| 19 | 0.65 | 0.65 | 0.85 | 0.65 | 0.7 |
| 20 | 0.6 | 0.6 | 0.65 | 0.6 | 0.65 |
| 21 | 0.5 | 0.55 | 0.65 | 0.8 | 0.8 |
| 22 | 0.6 | 0.8 | 0.65 | 0.65 | 0.75 |
| 23 | 0.8 | 0.65 | 0.75 | 0.65 | 0.65 |
| 24 | 0.65 | 0.6 | 0.6 | 0.6 | 0.7 |
| 25 | 0.65 | 0.7 | 0.7 | 0.6 | 0.65 |
We will upload the data to the system.
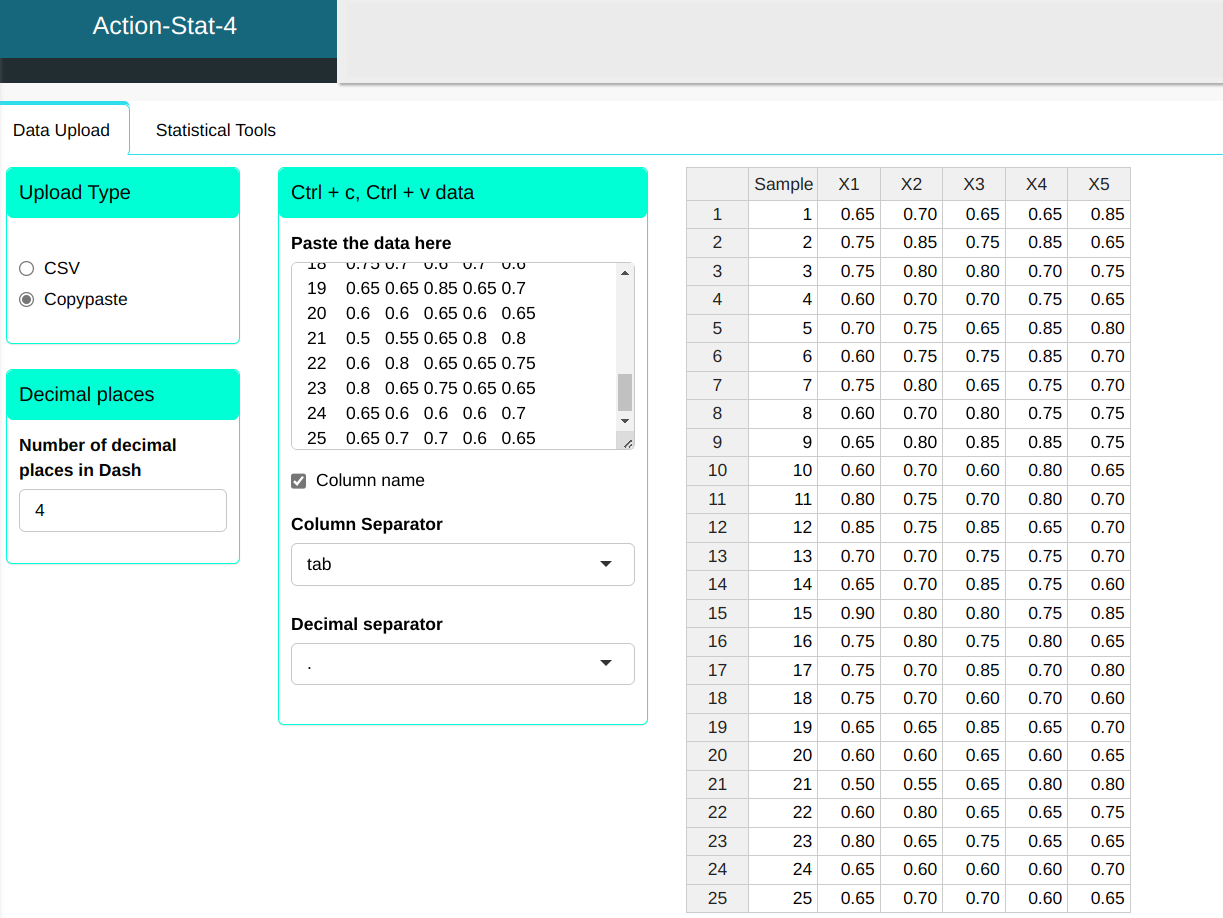
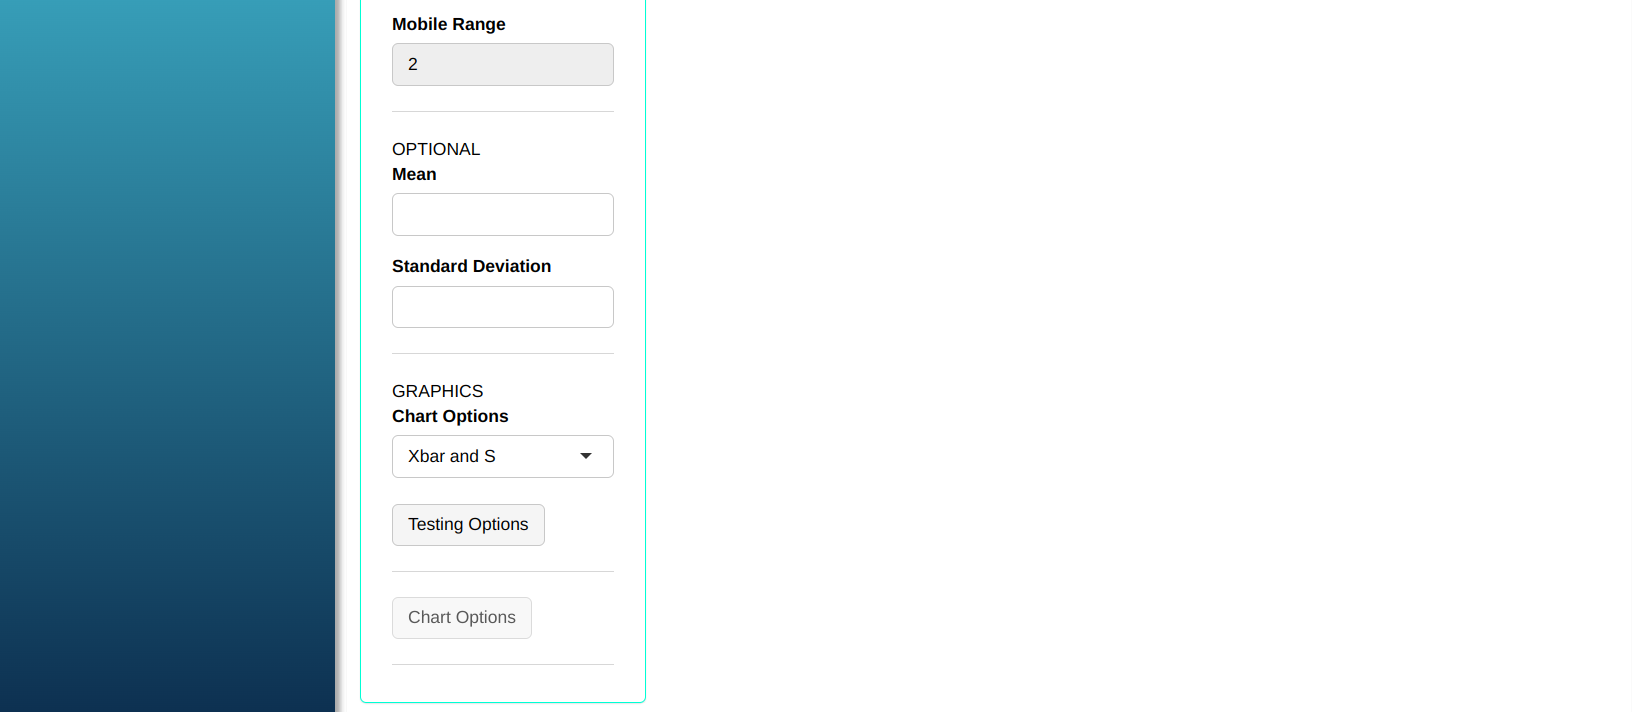
Configure as shown in the figure below to perform the graphical analysis.
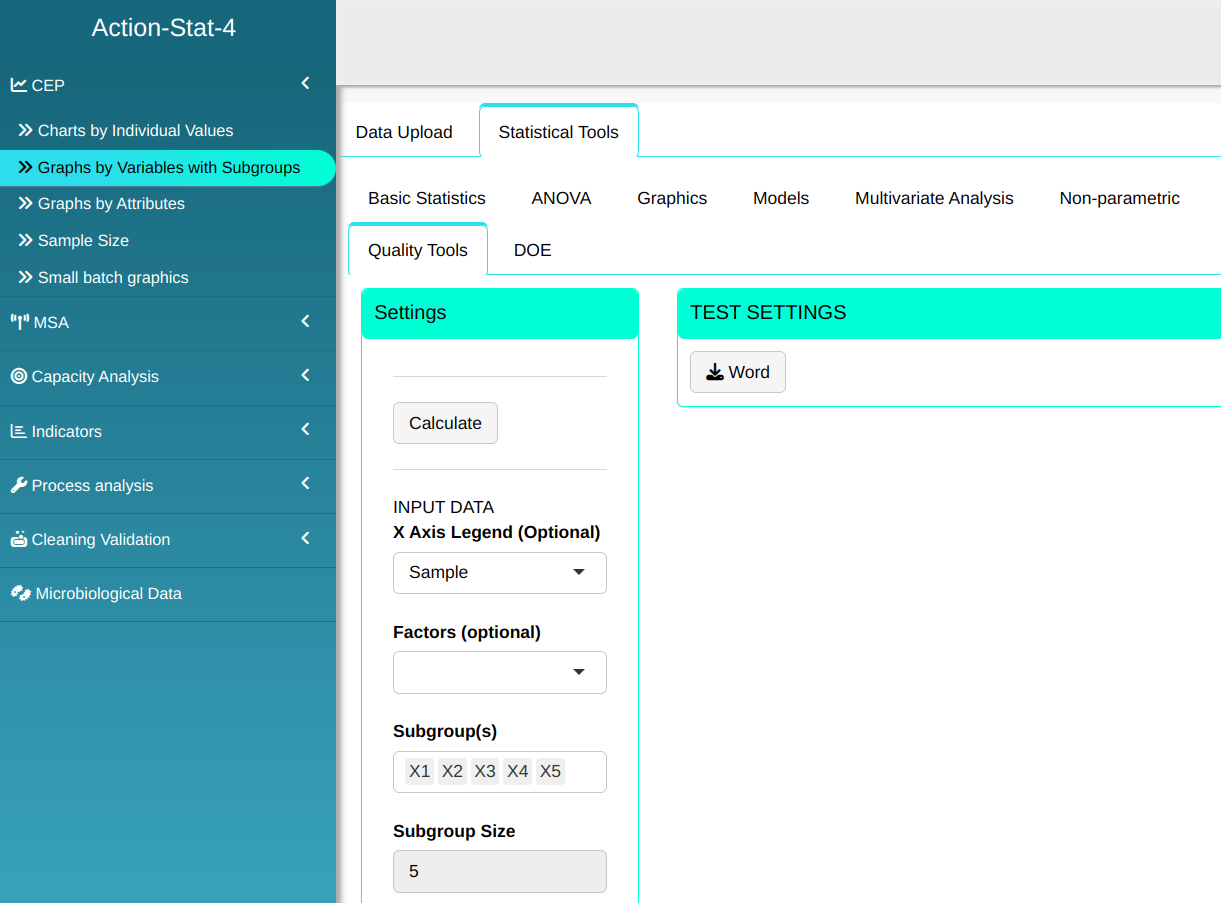
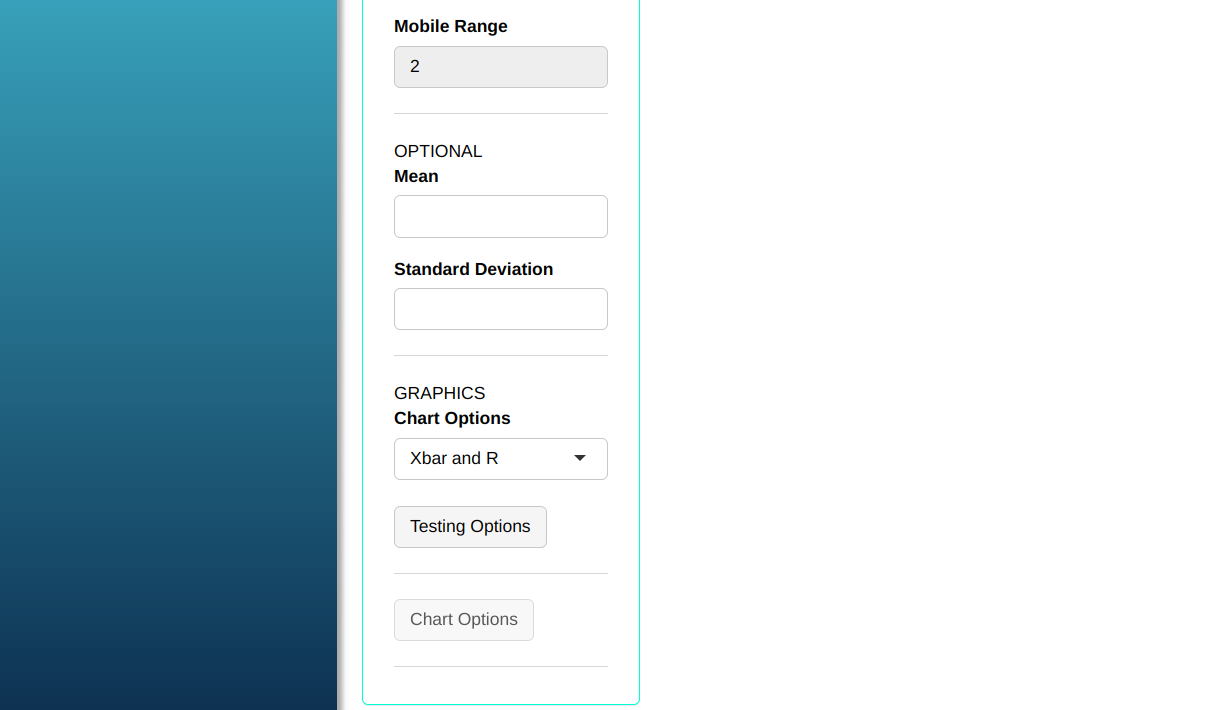
- Click on Test Options to decide which tests we are going to execute. In our case, we are going to select all of them, and then click OK.
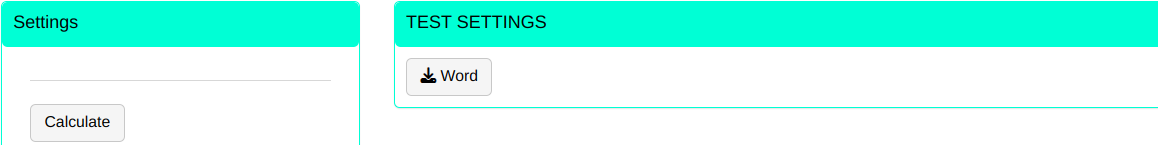
Then click Calculate we obtain the results. You can also generate the analyses and download them in Word format.
The results are
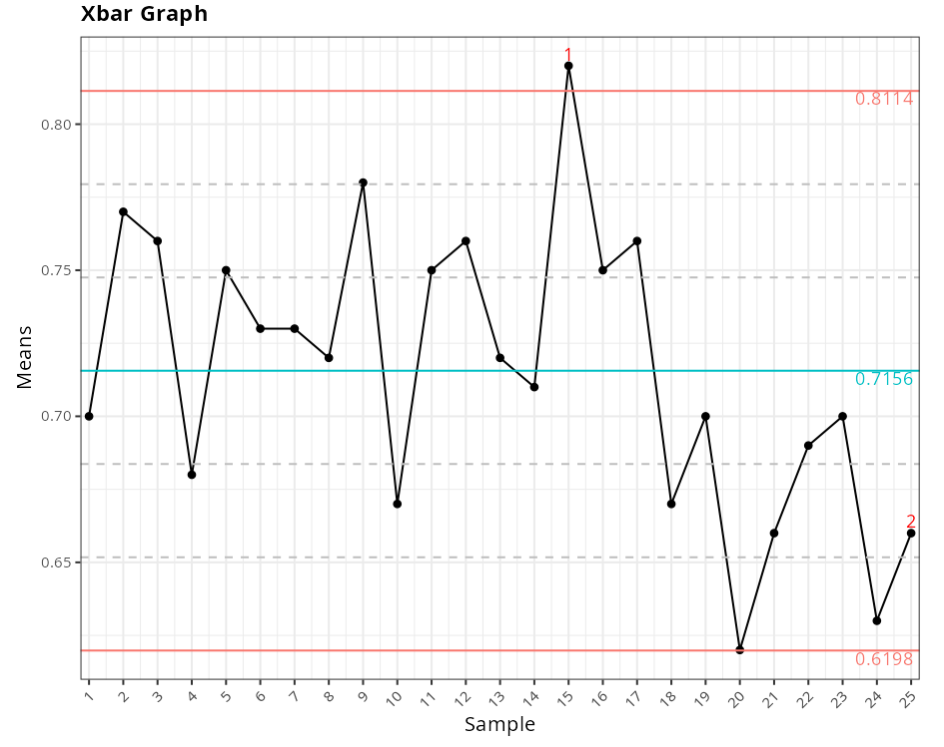
X-Bar Graph
| Value | |
|---|---|
| Upper Limit | 0.811 |
| Center Line | 0.716 |
| Lower Limit | 0.620 |
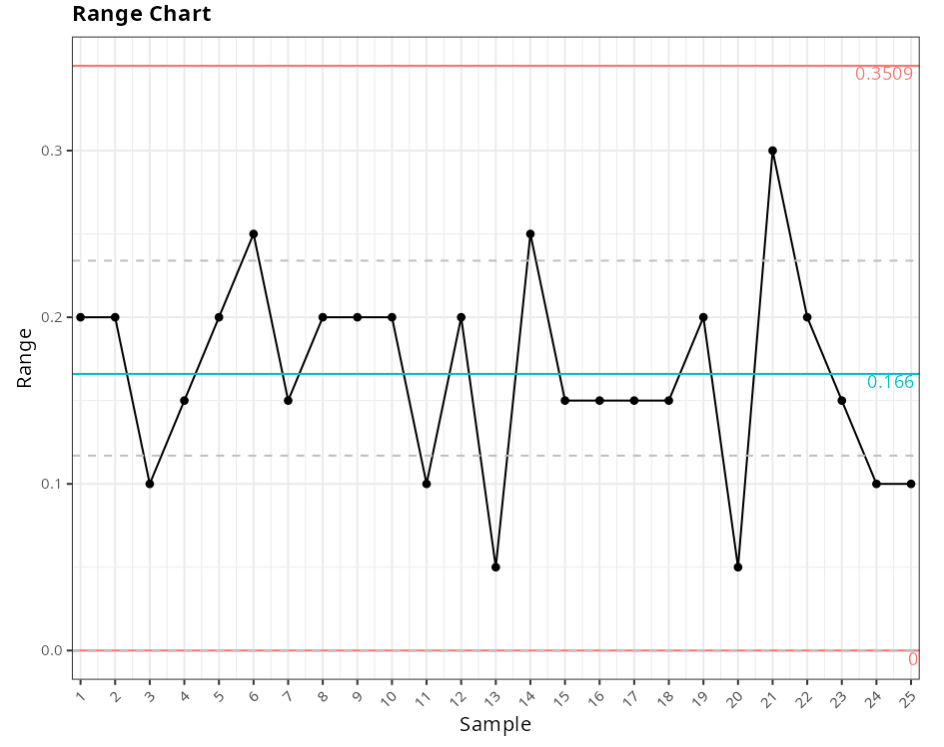
Range Chart
| Value | |
|---|---|
| Upper Limit | 0.351 |
| Center Line | 0.166 |
| Lower Limit | 0.000 |
| Standar Deviation | 0.071 |
Points out of control - X Bar Graph
| Subgroups | Value | Test |
|---|---|---|
| 15 | 0.82 | 1 point greater than 3 sigmas from the center line |
| 25 | 0.66 | 7 points or more in sequence on the same side of the center line |
Example 2:
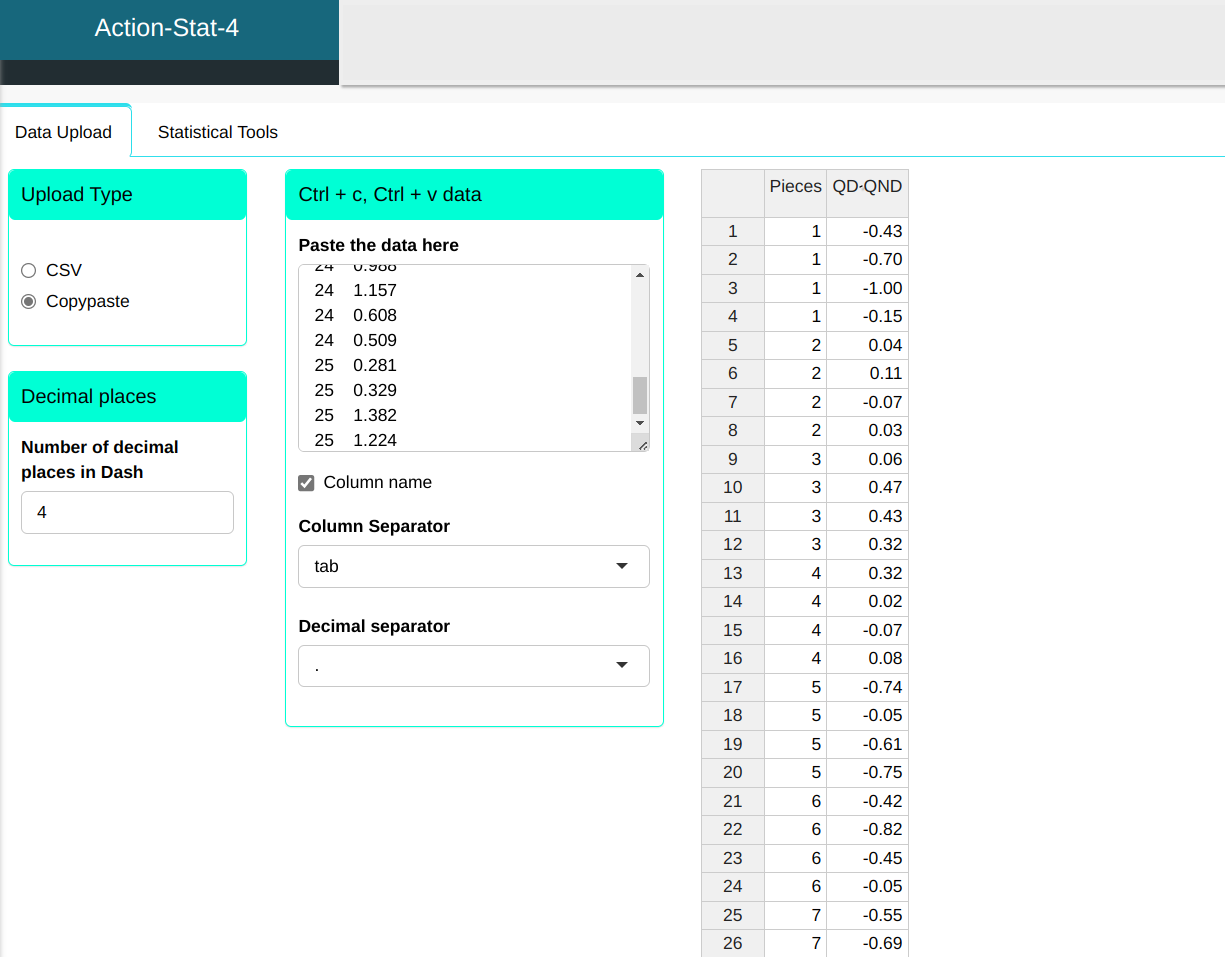
Let’s consider a plate that makes up a particular clutch. It is important to check the balance of this plate. Using a balancing machine, we determine a point of accumulation of mass. From this point we take 3 points counterclockwise and 4 points clockwise, for a total of 8 points. The thickness QD is measured at the point at 0° and the thickness QND is measured at the point 180° from the first. The second point is taken from the first at 80° clockwise, at which the thickness QD is measured and the corresponding thickness QND is taken at the point 180° from it. Similarly, we measure at 90° and 270°, as well as at 160° and 340°. This is done for each of the 25 pieces selected. In this case we analyze the difference between the thicknesses QD and QND.
| Pieces | QD - QND |
|---|---|
| 1 | -0.434 |
| 1 | -0.697 |
| 1 | -1.002 |
| 1 | -0.153 |
| 2 | 0.036 |
| 2 | 0.113 |
| 2 | -0.071 |
| 2 | 0.025 |
| 3 | 0.062 |
| 3 | 0.468 |
| 3 | 0.431 |
| 3 | 0.317 |
| 4 | 0.317 |
| 4 | 0.017 |
| 4 | -0.073 |
| 4 | 0.082 |
| 5 | -0.741 |
| 5 | -0.046 |
| 5 | -0.615 |
| 5 | -0.751 |
| 6 | -0.423 |
| 6 | -0.816 |
| 6 | -0.448 |
| 6 | -0.05 |
| 7 | -0.546 |
| 7 | -0.689 |
| 7 | -0.177 |
| 7 | -0.192 |
| 8 | 0.036 |
| 8 | -0.312 |
| 8 | 0.509 |
| 8 | 0.332 |
| 9 | 0.51 |
| 9 | 0.353 |
| 9 | 0.599 |
| 9 | 0.76 |
| 10 | 0.662 |
| 10 | 0.473 |
| 10 | 0.036 |
| 10 | 0.009 |
| 11 | 0.029 |
| 11 | 0.025 |
| 11 | 0.16 |
| 11 | 0.091 |
| 12 | -0.008 |
| 12 | 0.018 |
| 12 | -0.002 |
| 12 | 0.215 |
| 13 | -0.338 |
| 13 | -0.639 |
| 13 | -0.133 |
| 13 | -0.05 |
| 14 | -0.477 |
| 14 | -0.811 |
| 14 | -0.191 |
| 14 | 0.084 |
| 15 | 0.805 |
| 15 | 0.738 |
| 15 | 0.323 |
| 15 | 0.555 |
| 16 | 0.278 |
| 16 | 0.439 |
| 16 | 0.726 |
| 16 | 0.579 |
| 17 | 0.599 |
| 17 | 0.76 |
| 17 | 0.662 |
| 17 | 0.473 |
| 18 | 0.036 |
| 18 | 0.009 |
| 18 | 0.029 |
| 18 | 0.025 |
| 19 | 0.16 |
| 19 | 0.091 |
| 19 | -0.008 |
| 19 | -0.741 |
| 20 | -0.199 |
| 20 | -0.389 |
| 20 | -0.625 |
| 20 | -0.534 |
| 21 | -0.234 |
| 21 | -0.035 |
| 21 | 0.228 |
| 21 | 0.37 |
| 22 | 0.521 |
| 22 | 0.002 |
| 22 | -0.016 |
| 22 | -0.054 |
| 23 | -0.353 |
| 23 | 0.018 |
| 23 | -0.62 |
| 23 | -0.181 |
| 24 | 0.988 |
| 24 | 1.157 |
| 24 | 0.608 |
| 24 | 0.509 |
| 25 | 0.281 |
| 25 | 0.329 |
| 25 | 1.382 |
| 25 | 1.224 |
We will upload the data to the system.
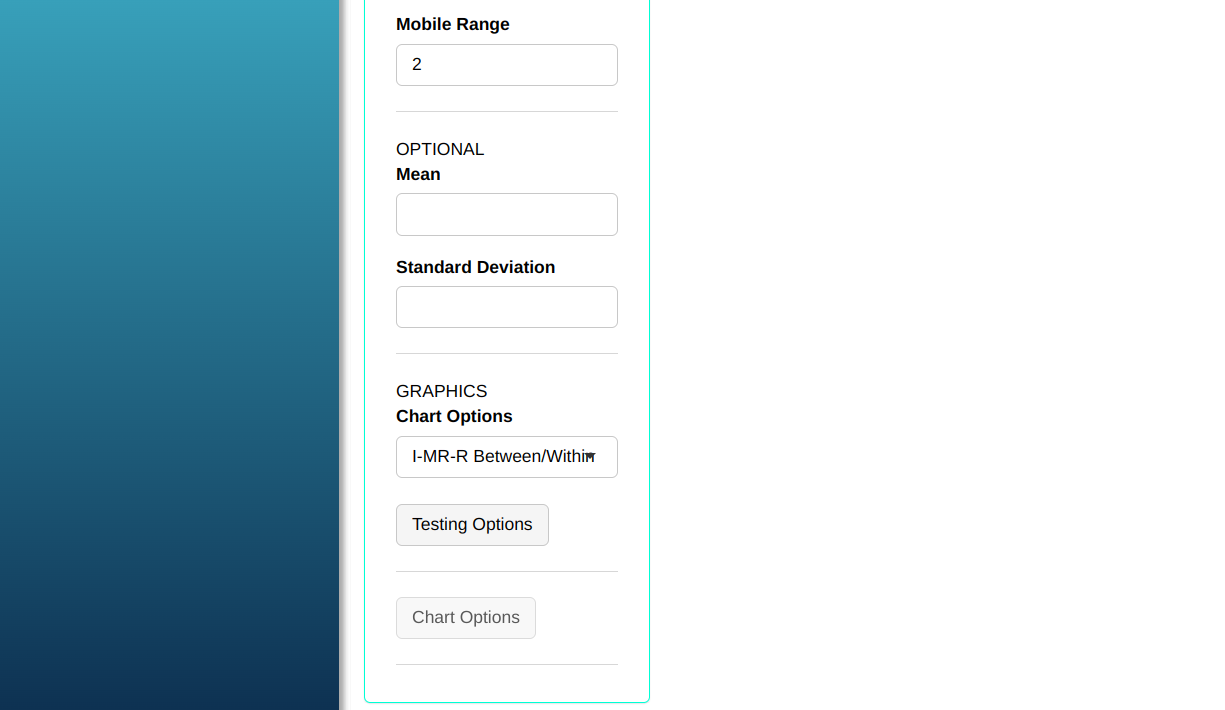
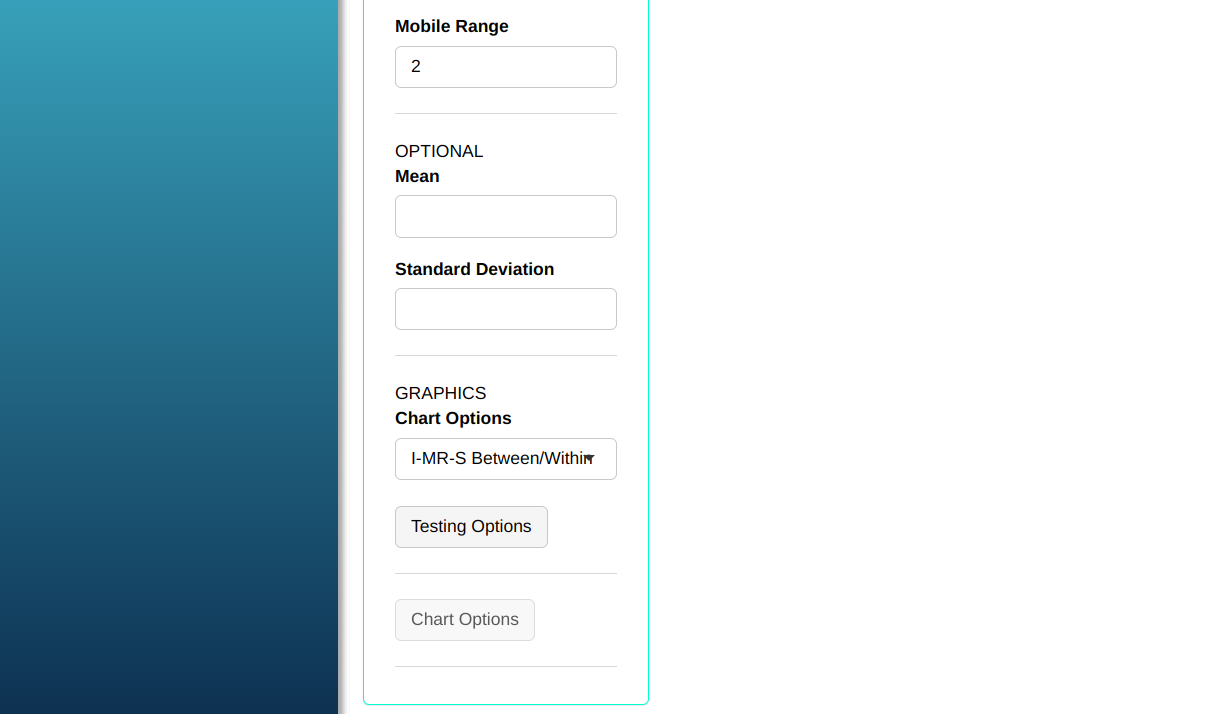
Configure as shown in the figure below to perform the graphical analysis.
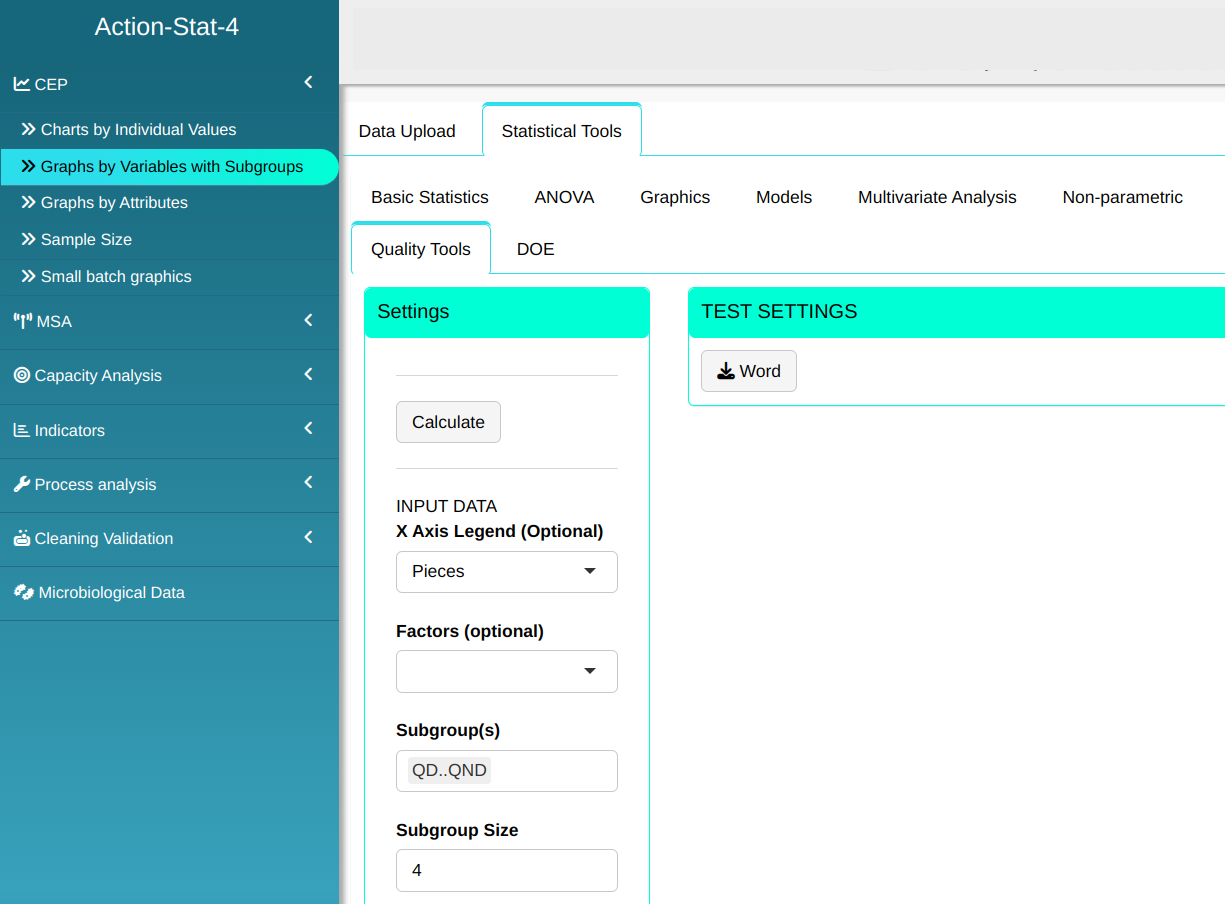
- Click on Test Options to decide which tests we are going to execute. In our case, we are going to select all of them, and then click OK.
Then click Calculate we obtain the results. You can also generate the analyses and download them in Word format.
The results are
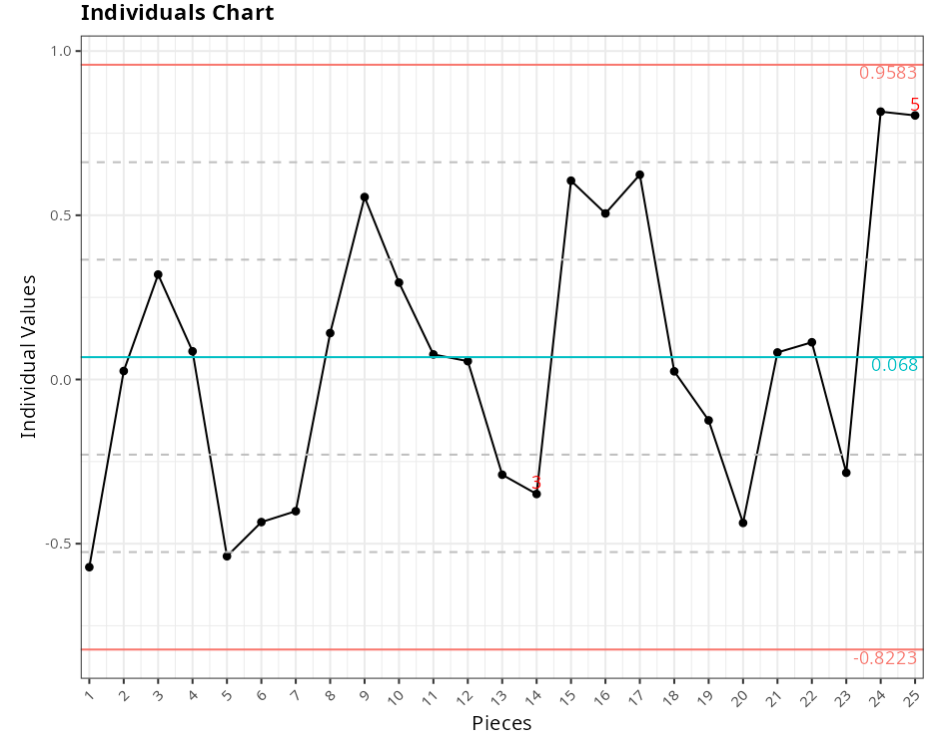
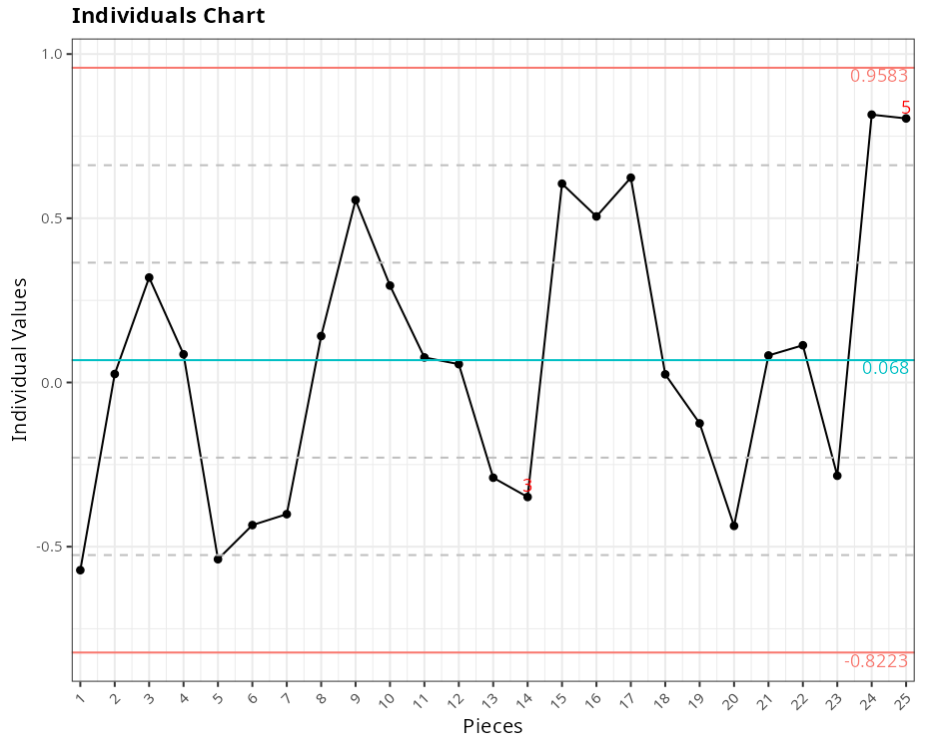
Individual Chart
| Value | |
|---|---|
| Upper Limit | 0.958 |
| Center Line | 0.068 |
| Lower Limit | -0.822 |
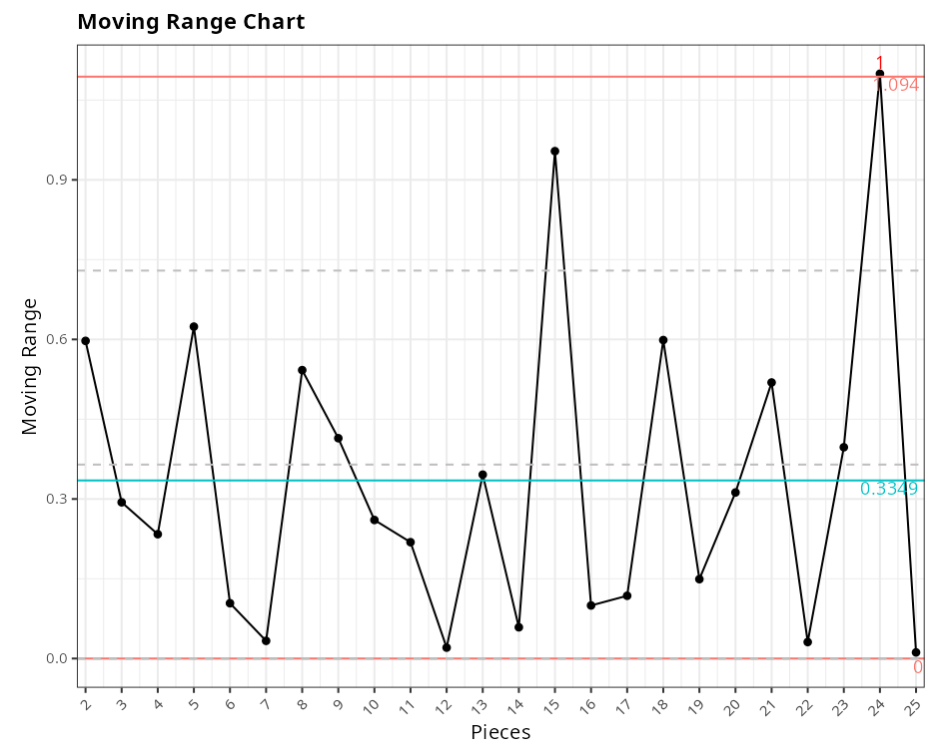
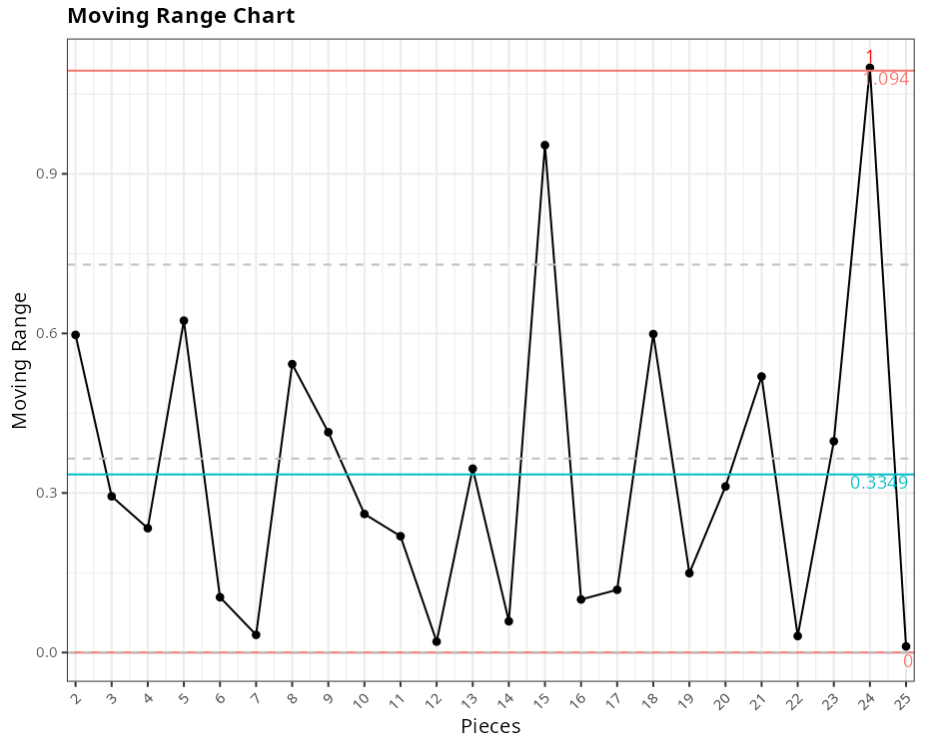
Moving Range Chart
| Value | |
|---|---|
| Upper Limit | 1.094 |
| Center Line | 0.335 |
| Lower Limit | 0.000 |
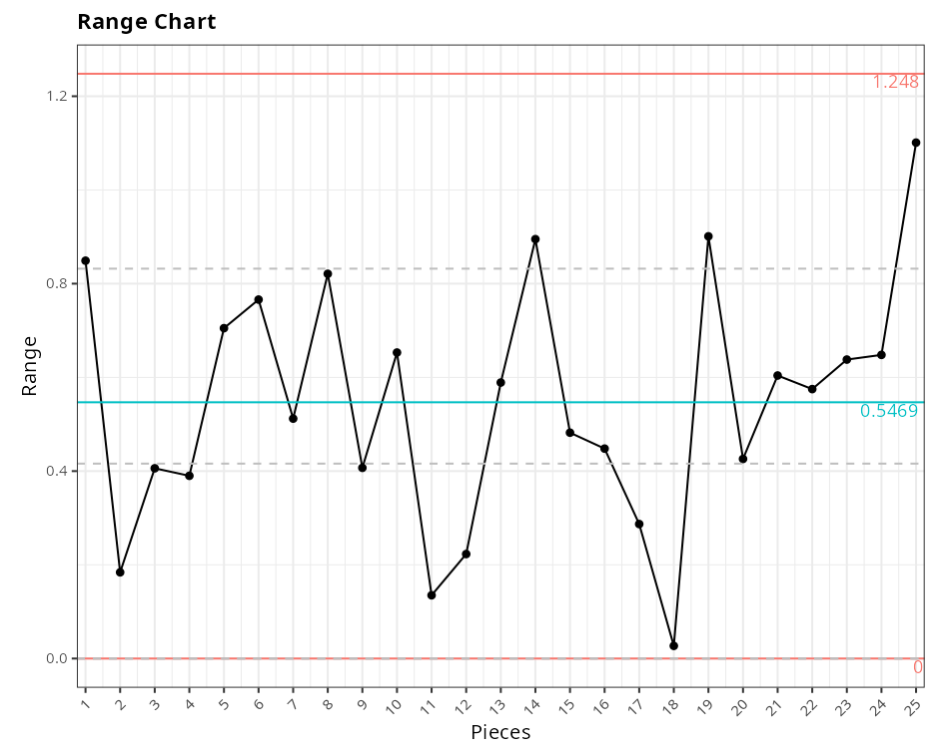
Range Chart
| Value | |
|---|---|
| Upper Limit | 1.248 |
| Center line | 0.547 |
| Lower Limit | 0.000 |
Standard Deviation
| Value | |
|---|---|
| Between | 0.265 |
| Within | 0.266 |
| Between / Within | 0.375 |
Points out of control - Individual Value Chart
| Subgroup | Value | Test |
|---|---|---|
| 14 | -0.349 | 6 points or more in sequence all increasing or decreasing |
| 25 | 0.804 | 2 of 3 consecutive points greater than 2 sigmas from the center line |
Points out of control - Moving Amplitude Chart
| Subgroup | Value | Test |
|---|---|---|
| 24 | 1.099 | 1 point greater than 3 Sigmas from the center line |
Example 3:
Let’s consider a plate that makes up a particular clutch. It is important to check the balance of this plate. Using a balancing machine, we determine a point of accumulation of mass. From this point we take 3 points counterclockwise and 4 points clockwise, for a total of 8 points. The thickness QD is measured at the point at 0° and the thickness QND is measured at the point 180° from the first. The second point is taken from the first at 80° clockwise, at which the thickness QD is measured and the corresponding thickness QND is taken at the point 180° from it. Similarly, we measure at 90° and 270°, as well as at 160° and 340°. This is done for each of the 25 pieces selected. In this case we analyze the difference between the thicknesses QD and QND.
| Pieces | QD - QND |
|---|---|
| 1 | -0.434 |
| 1 | -0.697 |
| 1 | -1.002 |
| 1 | -0.153 |
| 2 | 0.036 |
| 2 | 0.113 |
| 2 | -0.071 |
| 2 | 0.025 |
| 3 | 0.062 |
| 3 | 0.468 |
| 3 | 0.431 |
| 3 | 0.317 |
| 4 | 0.317 |
| 4 | 0.017 |
| 4 | -0.073 |
| 4 | 0.082 |
| 5 | -0.741 |
| 5 | -0.046 |
| 5 | -0.615 |
| 5 | -0.751 |
| 6 | -0.423 |
| 6 | -0.816 |
| 6 | -0.448 |
| 6 | -0.05 |
| 7 | -0.546 |
| 7 | -0.689 |
| 7 | -0.177 |
| 7 | -0.192 |
| 8 | 0.036 |
| 8 | -0.312 |
| 8 | 0.509 |
| 8 | 0.332 |
| 9 | 0.51 |
| 9 | 0.353 |
| 9 | 0.599 |
| 9 | 0.76 |
| 10 | 0.662 |
| 10 | 0.473 |
| 10 | 0.036 |
| 10 | 0.009 |
| 11 | 0.029 |
| 11 | 0.025 |
| 11 | 0.16 |
| 11 | 0.091 |
| 12 | -0.008 |
| 12 | 0.018 |
| 12 | -0.002 |
| 12 | 0.215 |
| 13 | -0.338 |
| 13 | -0.639 |
| 13 | -0.133 |
| 13 | -0.05 |
| 14 | -0.477 |
| 14 | -0.811 |
| 14 | -0.191 |
| 14 | 0.084 |
| 15 | 0.805 |
| 15 | 0.738 |
| 15 | 0.323 |
| 15 | 0.555 |
| 16 | 0.278 |
| 16 | 0.439 |
| 16 | 0.726 |
| 16 | 0.579 |
| 17 | 0.599 |
| 17 | 0.76 |
| 17 | 0.662 |
| 17 | 0.473 |
| 18 | 0.036 |
| 18 | 0.009 |
| 18 | 0.029 |
| 18 | 0.025 |
| 19 | 0.16 |
| 19 | 0.091 |
| 19 | -0.008 |
| 19 | -0.741 |
| 20 | -0.199 |
| 20 | -0.389 |
| 20 | -0.625 |
| 20 | -0.534 |
| 21 | -0.234 |
| 21 | -0.035 |
| 21 | 0.228 |
| 21 | 0.37 |
| 22 | 0.521 |
| 22 | 0.002 |
| 22 | -0.016 |
| 22 | -0.054 |
| 23 | -0.353 |
| 23 | 0.018 |
| 23 | -0.62 |
| 23 | -0.181 |
| 24 | 0.988 |
| 24 | 1.157 |
| 24 | 0.608 |
| 24 | 0.509 |
| 25 | 0.281 |
| 25 | 0.329 |
| 25 | 1.382 |
| 25 | 1.224 |
We will upload the data to the system.
Configure as shown in the figure below to perform the graphical analysis.

- Click on Test Options to decide which tests we are going to execute. In our case, we are going to select all of them, and then click OK.
Then click Calculate we obtain the results. You can also generate the analyses and download them in Word format.
The results are
Individuals Chart
| Value | |
|---|---|
| Uper Limit | 0.958 |
| Center Line | 0.068 |
| Lower Limit | -0.822 |
Moving Range Chart
| Value | |
|---|---|
| Upper Limit | 1.094 |
| Center line | 0.335 |
| Lower Limit | 0.000 |
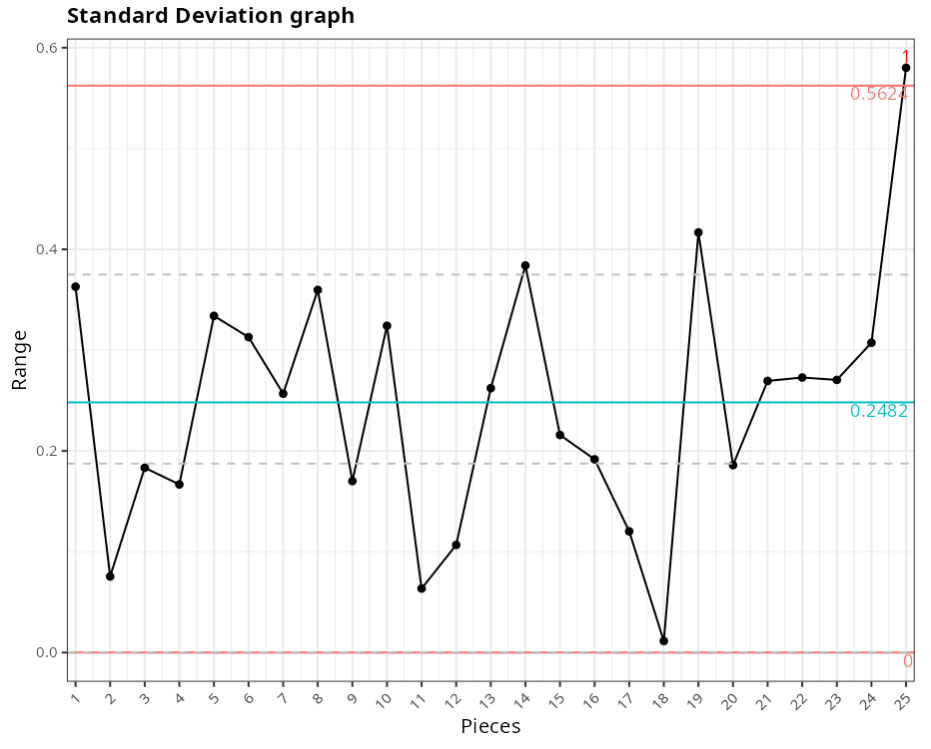
Standard Deviation graph
| Value | |
|---|---|
| Upper Limit | 0.562 |
| Center Line | 0.248 |
| Lower Limit | 0.000 |
Standard Deviation
| Value | |
|---|---|
| Between | 0.262 |
| Within | 0.280 |
| Between / Within | 0.383 |
Points out of control - Individual Values Chart
| Subgroup | Value | Test |
|---|---|---|
| 14 | -0.349 | 6 points or more in sequence, all increasing or decreasing |
| 25 | 0.804 | 2 of 3 consecutive points greater than 2 sigmas from the center line |
Points out of control - Moving Amplitude Chart
| Subgroup | Value | Test |
|---|---|---|
| 24 | 1.099 | 1 point greater than 3 Sigmas from the center line |
Points out of control - Standard deviation Chart
| Subgroup | Value | Test |
|---|---|---|
| 25 | 0.58 | 1 point greater than 3 Sigmas from the center line |
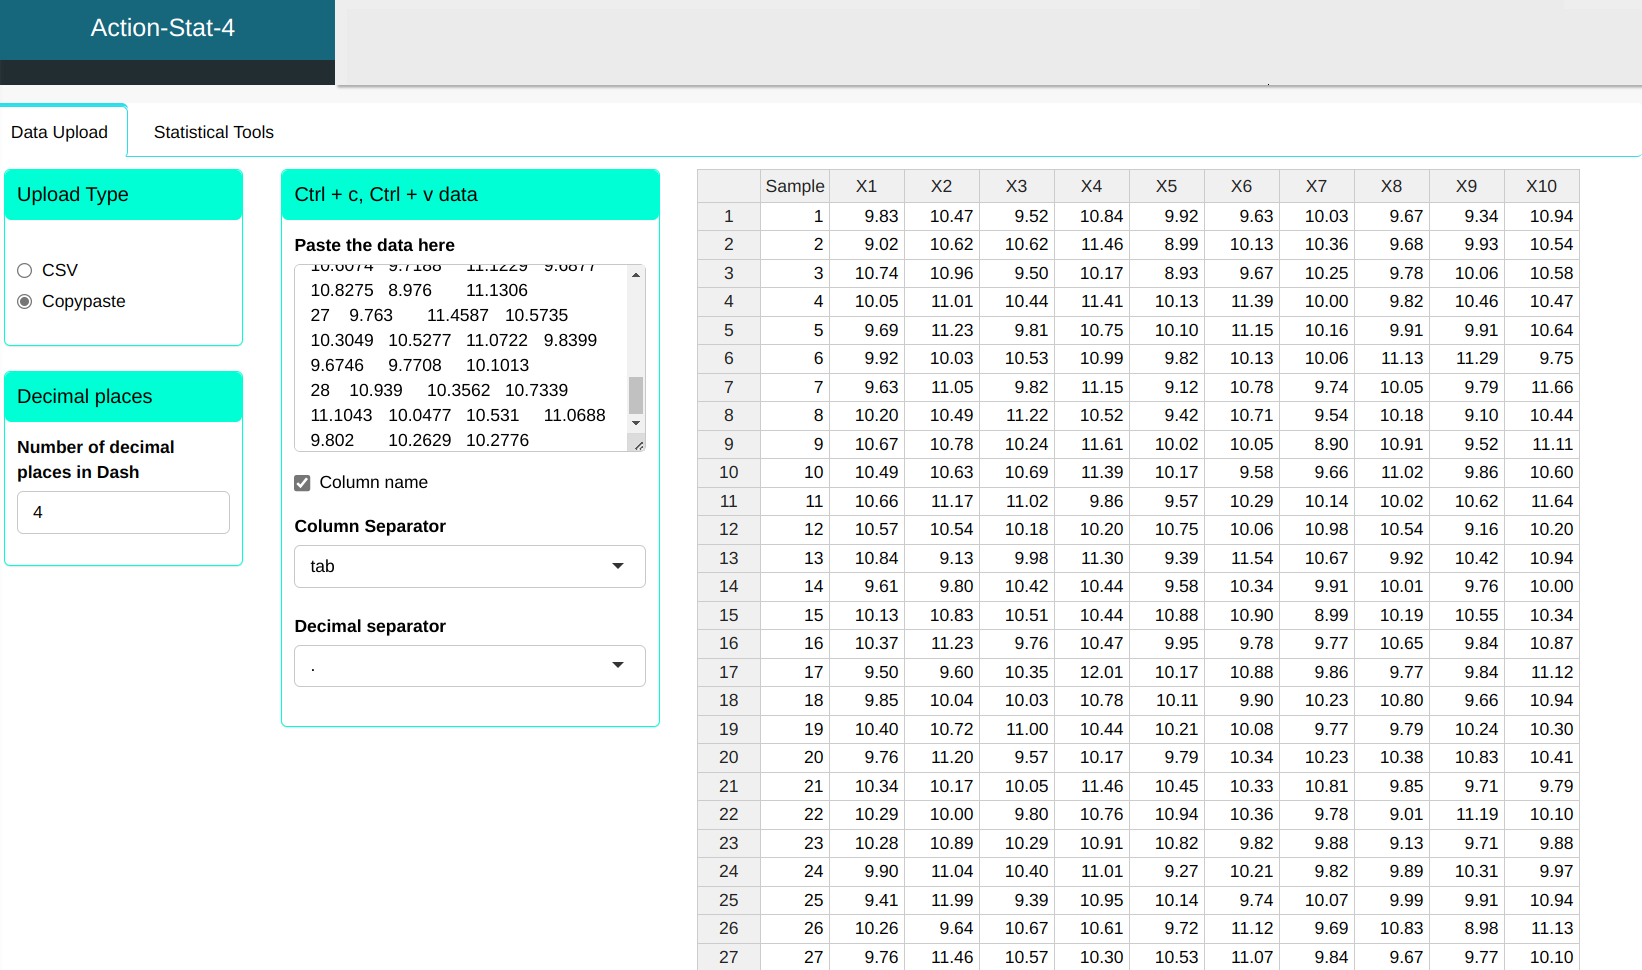
Example 4:
Consider a pin machining process where the diameter is measured in subgroups of 10 pieces over time.
| Sample | X1 | X2 | X3 | X4 | X5 | X6 | X7 | X8 | X9 | X10 |
|---|---|---|---|---|---|---|---|---|---|---|
| 1 | 9.8323 | 10.4735 | 9.5178 | 10.8361 | 9.9201 | 9.6272 | 10.0284 | 9.6664 | 9.3373 | 10.9362 |
| 2 | 9.0219 | 10.6217 | 10.6176 | 11.4604 | 8.9944 | 10.1264 | 10.3556 | 9.6835 | 9.9313 | 10.5404 |
| 3 | 10.7431 | 10.9621 | 9.4968 | 10.17 | 8.9321 | 9.6742 | 10.2471 | 9.7774 | 10.0575 | 10.5816 |
| 4 | 10.0543 | 11.0115 | 10.4363 | 11.4068 | 10.1321 | 11.3897 | 9.9963 | 9.8184 | 10.4614 | 10.4651 |
| 5 | 9.6915 | 11.2257 | 9.8063 | 10.7478 | 10.1048 | 11.1482 | 10.1624 | 9.9117 | 9.9081 | 10.6442 |
| 6 | 9.9209 | 10.0309 | 10.5285 | 10.9878 | 9.8168 | 10.1317 | 10.0633 | 11.1288 | 11.2937 | 9.7451 |
| 7 | 9.6343 | 11.0474 | 9.8212 | 11.1468 | 9.115 | 10.7762 | 9.7394 | 10.0534 | 9.7941 | 11.6617 |
| 8 | 10.2035 | 10.4941 | 11.2188 | 10.515 | 9.415 | 10.7148 | 9.5438 | 10.1777 | 9.1048 | 10.4412 |
| 9 | 10.6667 | 10.7832 | 10.2442 | 11.6138 | 10.0163 | 10.0467 | 8.9035 | 10.9109 | 9.523 | 11.1139 |
| 10 | 10.4892 | 10.6291 | 10.6905 | 11.387 | 10.1746 | 9.5808 | 9.6638 | 11.0216 | 9.8581 | 10.6037 |
| 11 | 10.6649 | 11.1688 | 11.0198 | 9.8607 | 9.5741 | 10.2868 | 10.139 | 10.0186 | 10.6223 | 11.6381 |
| 12 | 10.5682 | 10.5393 | 10.1765 | 10.1989 | 10.75 | 10.0564 | 10.9785 | 10.5446 | 9.1627 | 10.2037 |
| 13 | 10.8432 | 9.1263 | 9.9808 | 11.2966 | 9.385 | 11.5448 | 10.6659 | 9.9193 | 10.417 | 10.9449 |
| 14 | 9.6101 | 9.8 | 10.4167 | 10.4374 | 9.5798 | 10.3382 | 9.9084 | 10.0147 | 9.758 | 9.9967 |
| 15 | 10.1325 | 10.8271 | 10.507 | 10.4371 | 10.8779 | 10.8975 | 8.9913 | 10.1882 | 10.5538 | 10.3392 |
| 16 | 10.3702 | 11.2328 | 9.7624 | 10.4681 | 9.9547 | 9.7824 | 9.7726 | 10.6453 | 9.8423 | 10.868 |
| 17 | 9.5008 | 9.5963 | 10.349 | 12.0111 | 10.1694 | 10.877 | 9.8602 | 9.7677 | 9.8443 | 11.1214 |
| 18 | 9.8528 | 10.0426 | 10.0269 | 10.7828 | 10.1054 | 9.9032 | 10.2323 | 10.7983 | 9.6603 | 10.9406 |
| 19 | 10.4005 | 10.7238 | 11.0019 | 10.4417 | 10.2053 | 10.0774 | 9.7682 | 9.7861 | 10.2386 | 10.3 |
| 20 | 9.7635 | 11.202 | 9.5674 | 10.1705 | 9.7851 | 10.3353 | 10.2331 | 10.3768 | 10.8271 | 10.4101 |
| 21 | 10.3412 | 10.1655 | 10.0494 | 11.4595 | 10.4515 | 10.326 | 10.8081 | 9.8483 | 9.7066 | 9.7909 |
| 22 | 10.2931 | 9.9962 | 9.7957 | 10.759 | 10.9442 | 10.3623 | 9.7833 | 9.006 | 11.1923 | 10.1037 |
| 23 | 10.2808 | 10.8858 | 10.2942 | 10.912 | 10.8164 | 9.8223 | 9.8758 | 9.1255 | 9.7107 | 9.8788 |
| 24 | 9.8984 | 11.0424 | 10.3988 | 11.0127 | 9.2655 | 10.2082 | 9.8238 | 9.8925 | 10.3074 | 9.9735 |
| 25 | 9.4126 | 11.9882 | 9.3897 | 10.9499 | 10.1394 | 9.7375 | 10.0704 | 9.9912 | 9.9054 | 10.9421 |
| 26 | 10.2554 | 9.6405 | 10.6678 | 10.6074 | 9.7188 | 11.1229 | 9.6877 | 10.8275 | 8.976 | 11.1306 |
| 27 | 9.763 | 11.4587 | 10.5735 | 10.3049 | 10.5277 | 11.0722 | 9.8399 | 9.6746 | 9.7708 | 10.1013 |
| 28 | 10.939 | 10.3562 | 10.7339 | 11.1043 | 10.0477 | 10.531 | 11.0688 | 9.802 | 10.2629 | 10.2776 |
We will upload the data to the system.
Configure as shown in the figure below to perform the graphical analysis
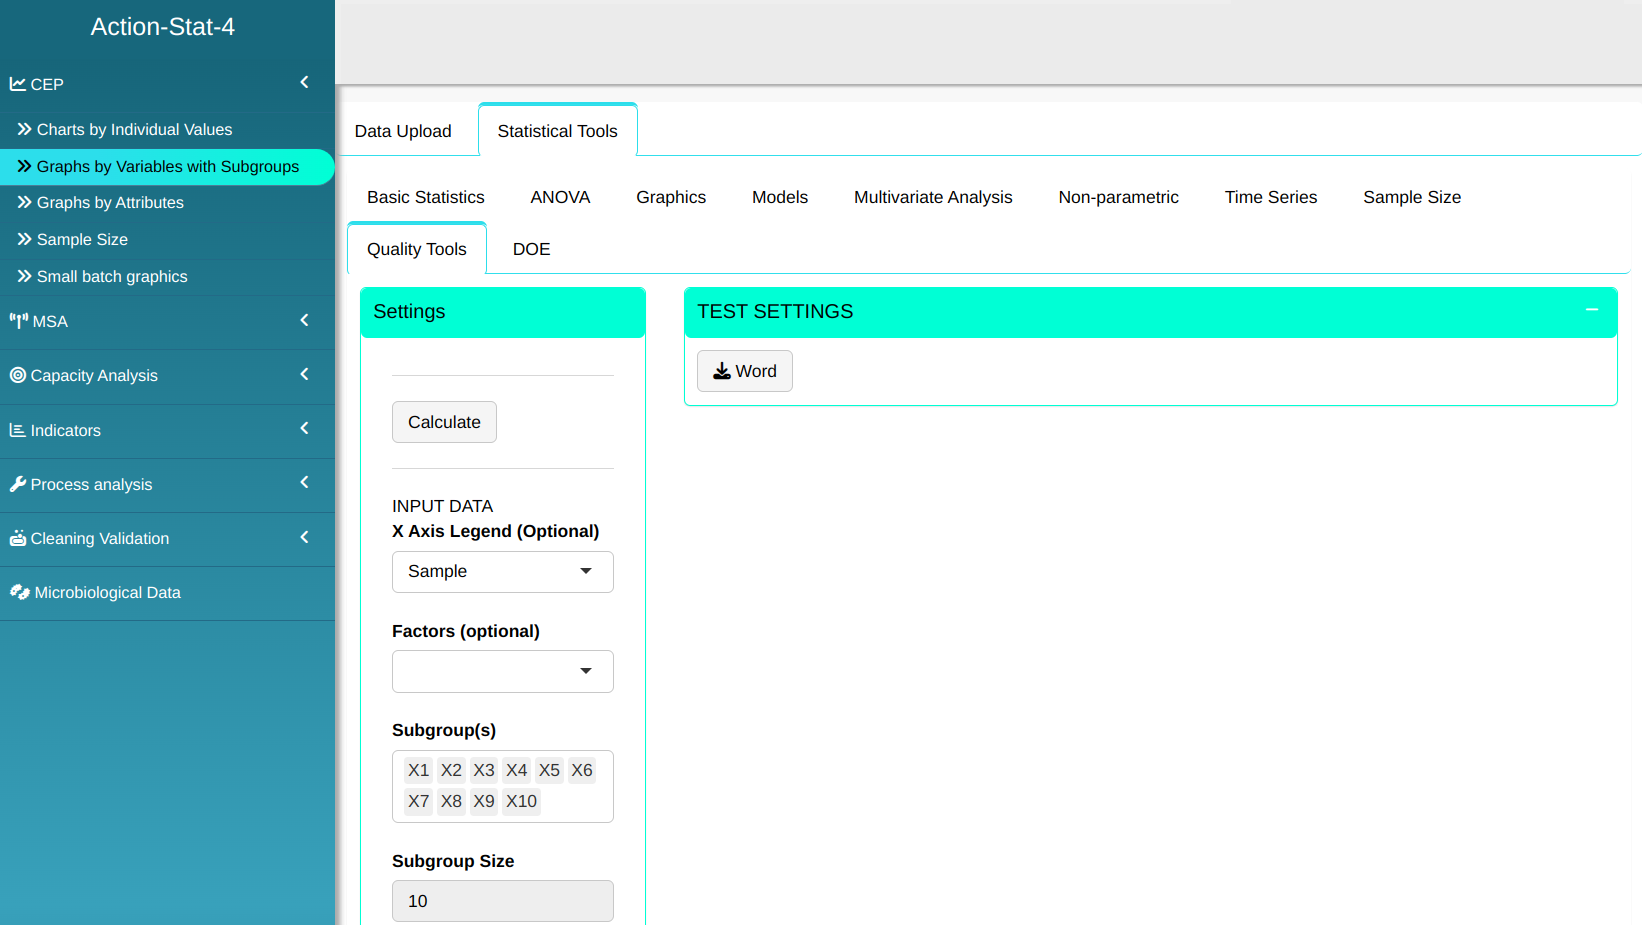
- Click on Test Options to decide which tests we are going to execute. In our case, we are going to select all of them, and then click OK.
Then click Calculate we obtain the results. You can also generate the analyses and download them in Word format.
The results are
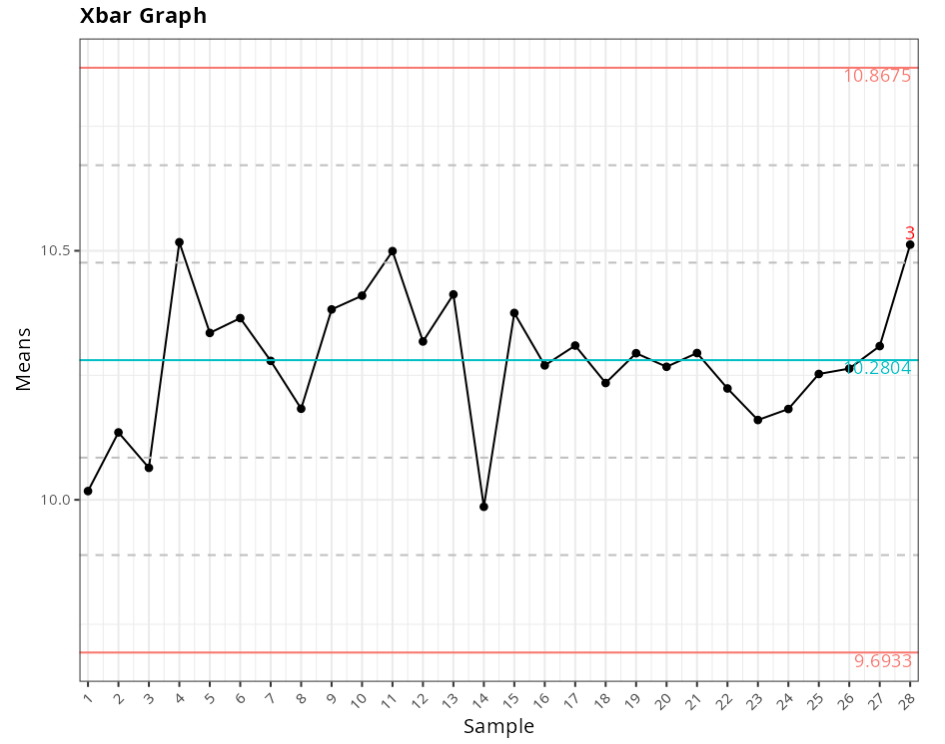
X-Bar Graph
| Value | |
|---|---|
| Upper Limit | 10.86 |
| Center Line | 10.280 |
| Lower Limit | 9.693 |
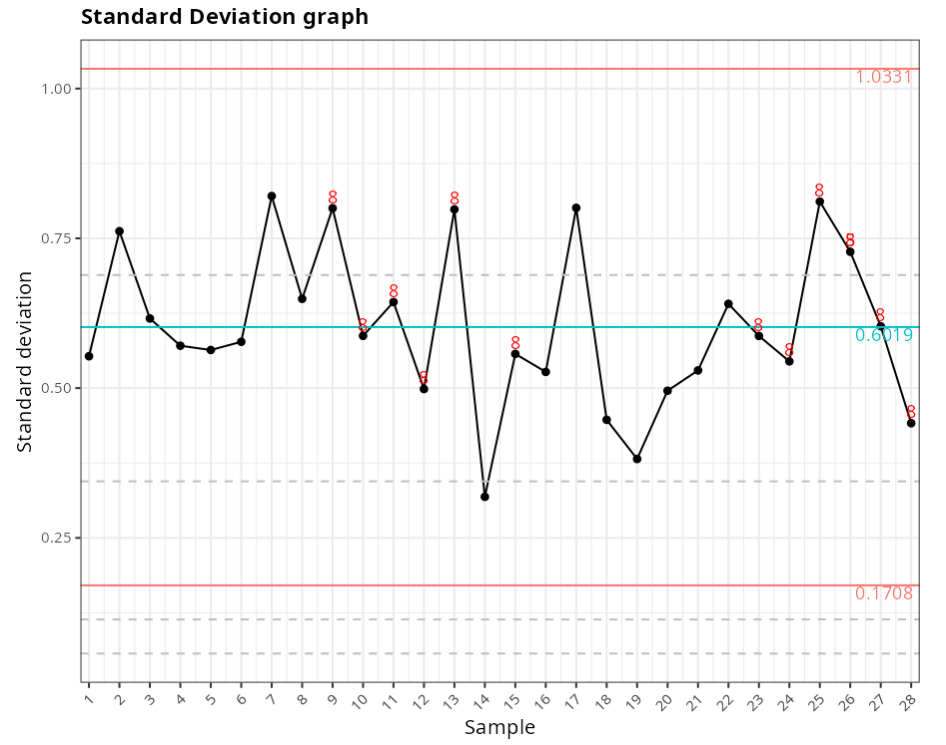
Standard Deviation graph
| Value | |
|---|---|
| Upper Limit | 1.033 |
| Center Line | 0.602 |
| Lower Limit | 0.171 |
Points out of control - X-Barra Graph
| Subgroup | Value | Test |
|---|---|---|
| 28 | 10.512 | 6 points or more in sequence, all increasing or decreasing |
Points out of control - Standard Deviation Chart
| Subgroup | Value | Test |
|---|---|---|
| 26 | 0.728 | 2 of 3 consecutive points greater than 2 sigmas from the center line |
| 9 | 0.800 | Eight or more consecutive points greater than 1 sigma from the center line |
| 10 | 0.587 | Eight or more consecutive points greater than 1 sigma from the center line |
| 11 | 0.644 | Eight or more consecutive points greater than 1 sigma from the center line |
| 12 | 0.498 | Eight or more consecutive points greater than 1 sigma from the center line |
| 13 | 0.798 | Eight or more consecutive points greater than 1 sigma from the center line |
| 15 | 0.557 | Eight or more consecutive points greater than 1 sigma from the center line |
| 23 | 0.587 | Eight or more consecutive points greater than 1 sigma from the center line |
| 24 | 0.545 | Eight or more consecutive points greater than 1 sigma from the center line |
| 25 | 0.811 | Eight or more consecutive points greater than 1 sigma from the center line |
| 26 | 0.728 | Eight or more consecutive points greater than 1 sigma from the center line |
| 27 | 0.603 | Eight or more consecutive points greater than 1 sigma from the center line |
| 28 | 0.441 | Eight or more consecutive points greater than 1 sigma from the center line |