1. Graphs by Individual Variables
Many quality characteristics can be expressed in terms of numeric values. Measurable quality characteristics such as weight, dimension or volume are called variables.
Example 1:
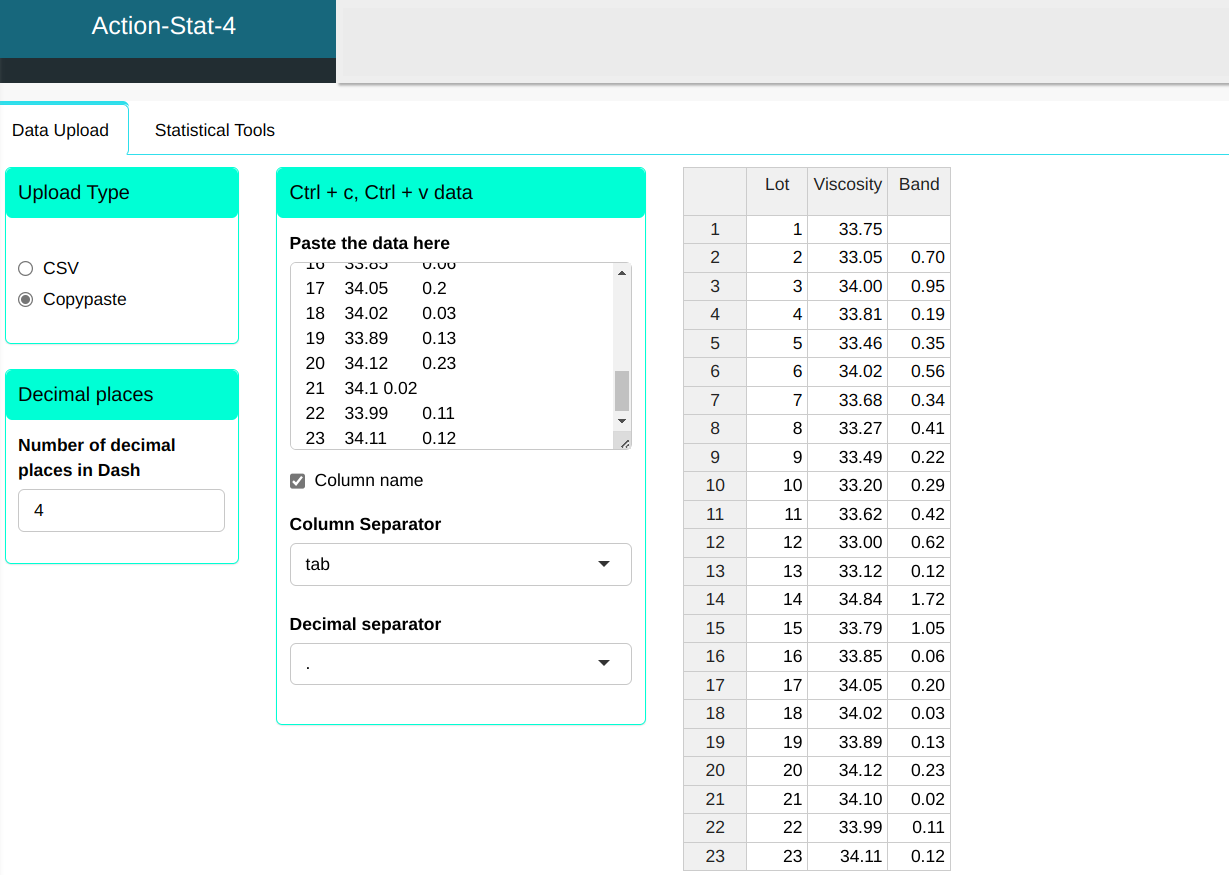
We will upload data regarding the viscosity of a given product.
| Lot | Viscosity | Band |
|---|---|---|
| 1 | 33.75 | |
| 2 | 33.05 | 0.70 |
| 3 | 34.00 | 0.95 |
| 4 | 33.81 | 0.19 |
| 5 | 33.46 | 0.35 |
| 6 | 34.02 | 0.56 |
| 7 | 33.68 | 0.34 |
| 8 | 33.27 | 0.41 |
| 9 | 33.49 | 0.22 |
| 10 | 33.20 | 0.29 |
| 11 | 33.62 | 0.42 |
| 12 | 33.00 | 0.62 |
| 13 | 33.12 | 0.12 |
| 14 | 34.84 | 1.72 |
| 15 | 33.79 | 1.05 |
| 16 | 33.85 | 0.06 |
| 17 | 34.05 | 0.20 |
| 18 | 34.02 | 0.03 |
| 19 | 33.89 | 0.13 |
| 20 | 34.12 | 0.23 |
| 21 | 34.10 | 0.02 |
| 22 | 33.99 | 0.11 |
| 23 | 34.11 | 0.12 |
Setting as shown in the figure below to perform the analysis
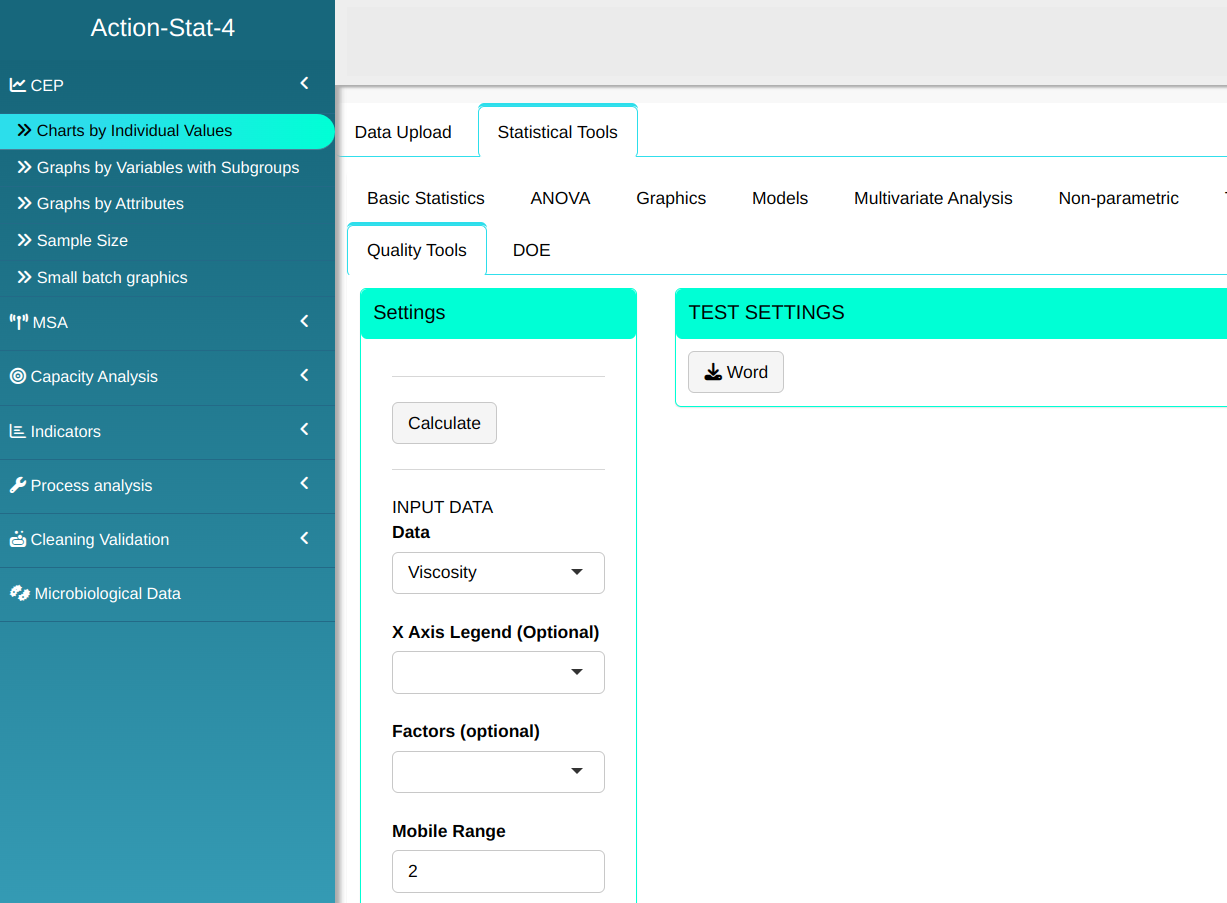
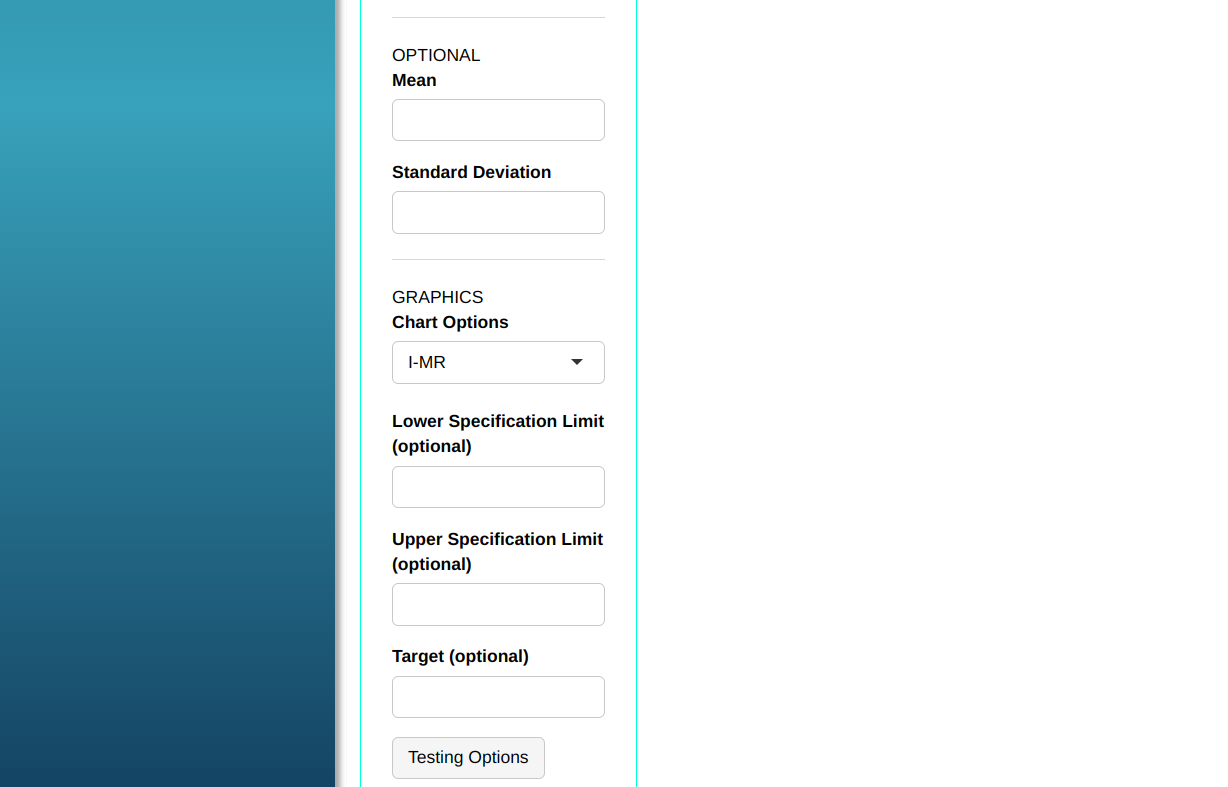

- Click on “Test Options” to decide which tests we will run. In our case, we will select all of them and click OK.
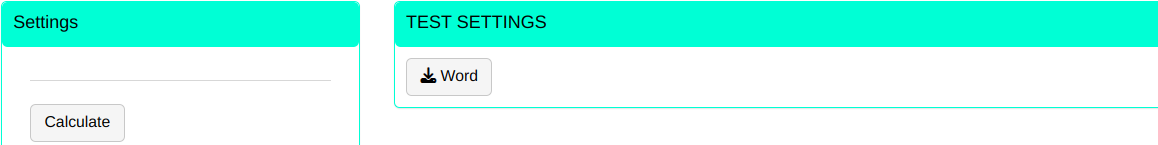
Then click Calculate we obtain the results. You can also generate the analyses and download them in Word format.
The results are:
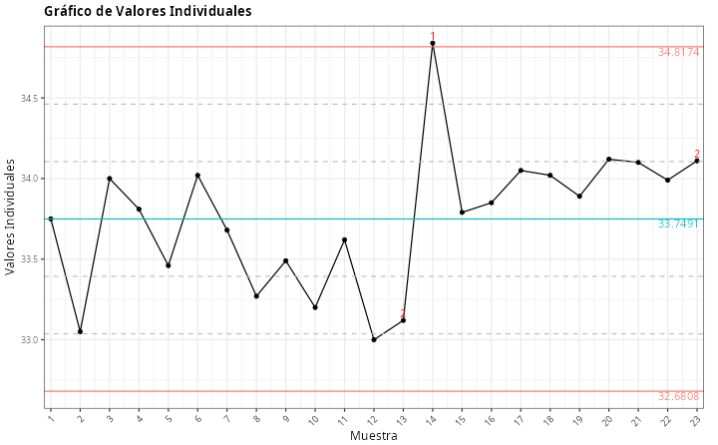
Individual Values Chart
| Value | |
|---|---|
| Upper Limit | 34.817 |
| Center line | 33.749 |
| Lower Limit | 32.681 |
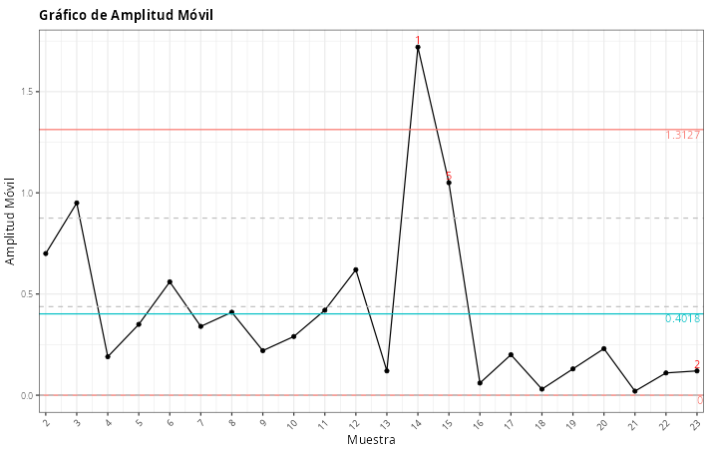
Moving Amplitude Chart
| Value | |
|---|---|
| Upper Limit | 1.313 |
| Center line | 0.402 |
| Lower Limit | 0.000 |
| Standard deviation | 0.356 |
Points out of control - Individual Values Chart
| Subgroups | Value | Test |
|---|---|---|
| 14 | 34.84 | 1 point more than 3 Sigmas from the center line |
| 13 | 33.12 | 7 points or more in sequence on the same side of the center line |
| 23 | 34.11 | 7 points or more in sequence on the same side of the center line |
Points out of control - Moving Amplitude Chart
| Subgroups | Value | Test |
|---|---|---|
| 14 | 1.72 | 1 point more than 3 Sigma from the center line |
| 23 | 0.12 | 7 points or more in a row on the same side of the center line |
| 15 | 1.05 | 2 of 3 consecutive points greater than 2 deviations pattern from the center line |
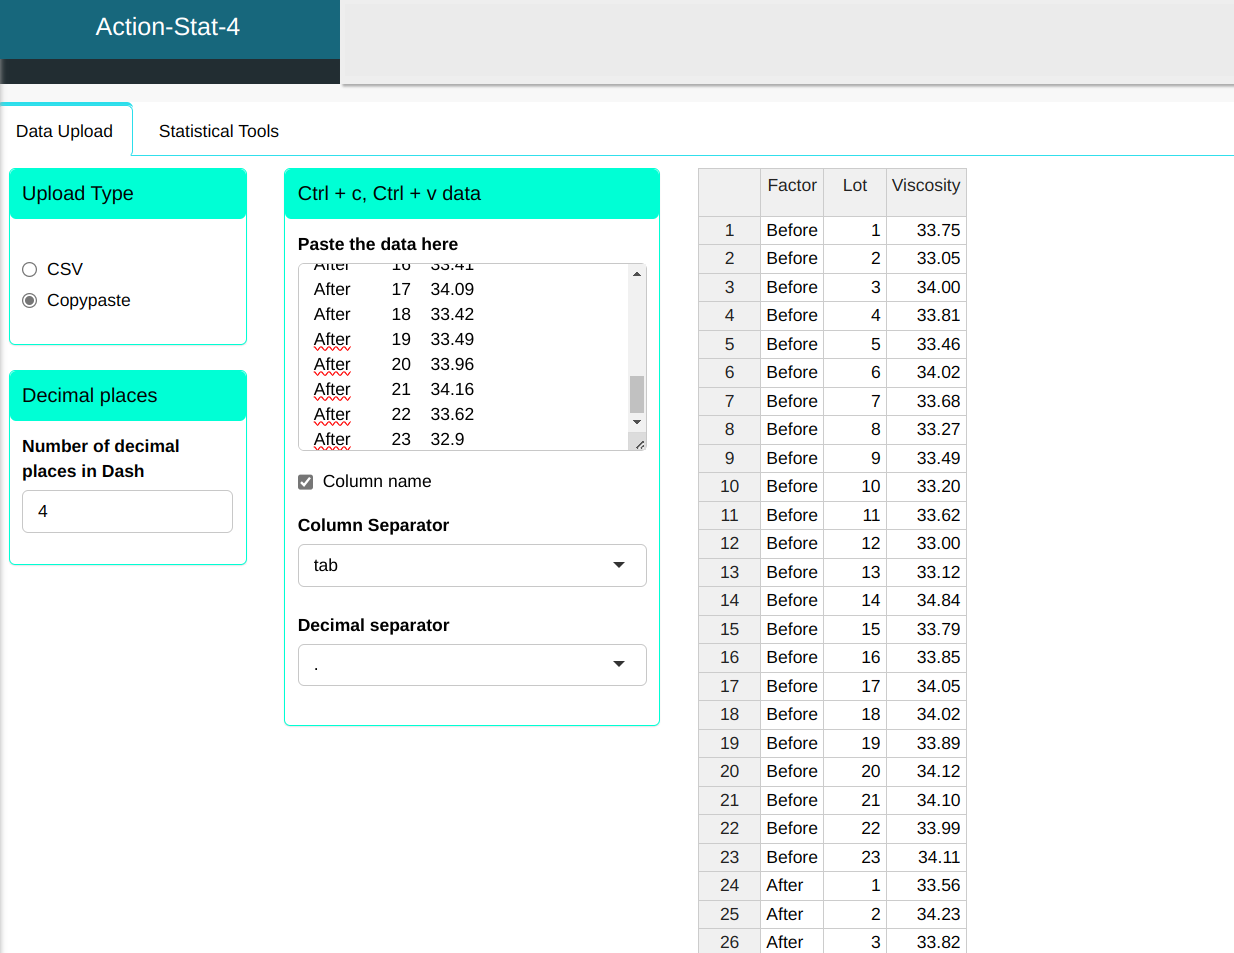
Example 2:
Consider the example above, after some changes in production, new viscosity measurements were made. We want to make a comparison between before and after these changes.
| Factor | Lot | Viscosity |
|---|---|---|
| Before | 1 | 33.75 |
| Before | 2 | 33.05 |
| Before | 3 | 34.00 |
| Before | 4 | 33.81 |
| Before | 5 | 33.46 |
| Before | 6 | 34.02 |
| Before | 7 | 33.68 |
| Before | 8 | 33.27 |
| Before | 9 | 33.49 |
| Before | 10 | 33.20 |
| Before | 11 | 33.62 |
| Before | 12 | 33.00 |
| Before | 13 | 33.12 |
| Before | 14 | 34.84 |
| Before | 15 | 33.79 |
| Before | 16 | 33.85 |
| Before | 17 | 34.05 |
| Before | 18 | 34.02 |
| Before | 19 | 33.89 |
| Before | 20 | 34.12 |
| Before | 21 | 34.10 |
| Before | 22 | 33.99 |
| Before | 23 | 34.11 |
| After | 1 | 33.56 |
| After | 2 | 34.23 |
| After | 3 | 33.82 |
| After | 4 | 33.23 |
| After | 5 | 33.39 |
| After | 6 | 33.70 |
| After | 7 | 33.67 |
| After | 8 | 33.84 |
| After | 9 | 33.81 |
| After | 10 | 33.55 |
| After | 11 | 33.90 |
| After | 12 | 33.69 |
| After | 13 | 33.84 |
| After | 14 | 33.68 |
| After | 15 | 34.20 |
| After | 16 | 33.41 |
| After | 17 | 34.09 |
| After | 18 | 33.42 |
| After | 19 | 33.49 |
| After | 20 | 33.96 |
| After | 21 | 34.16 |
| After | 22 | 33.62 |
| After | 23 | 32.90 |
Setting as shown in the figure below to perform the analysis


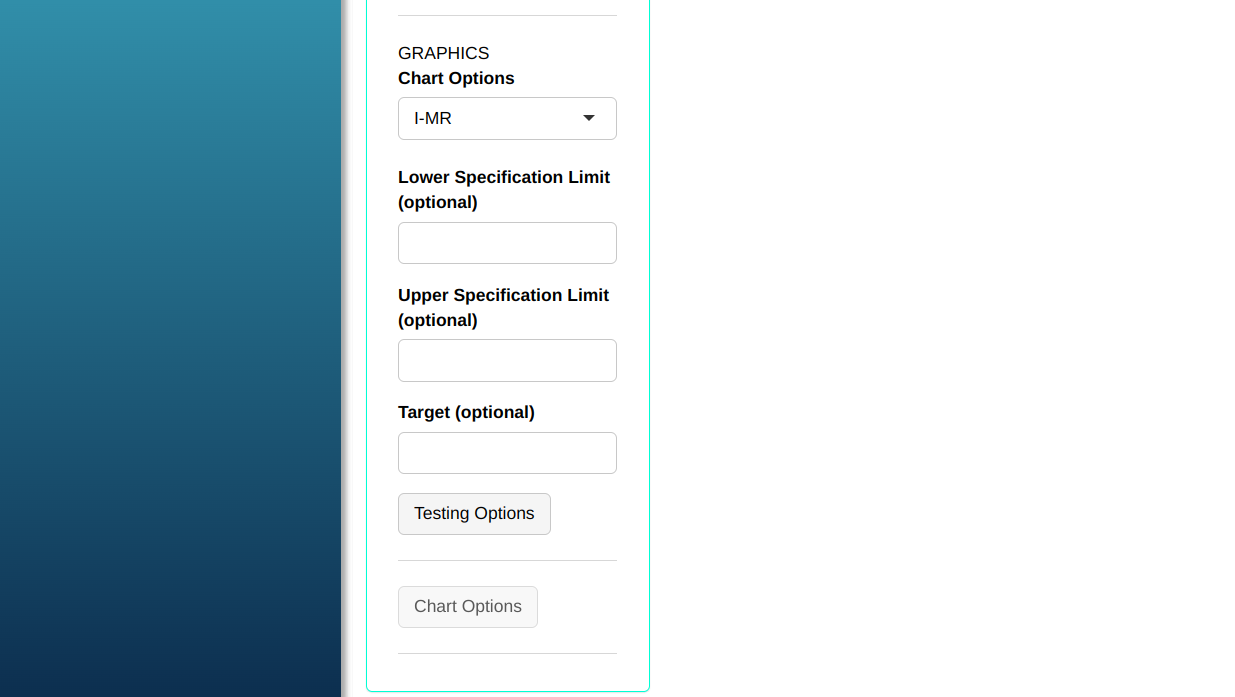
- Click on “Test Options” to decide which tests we will run. In our case, we will select all of them and click OK.
Then click Calculate we obtain the results. You can also generate the analyses and download them in Word format.
The results are:
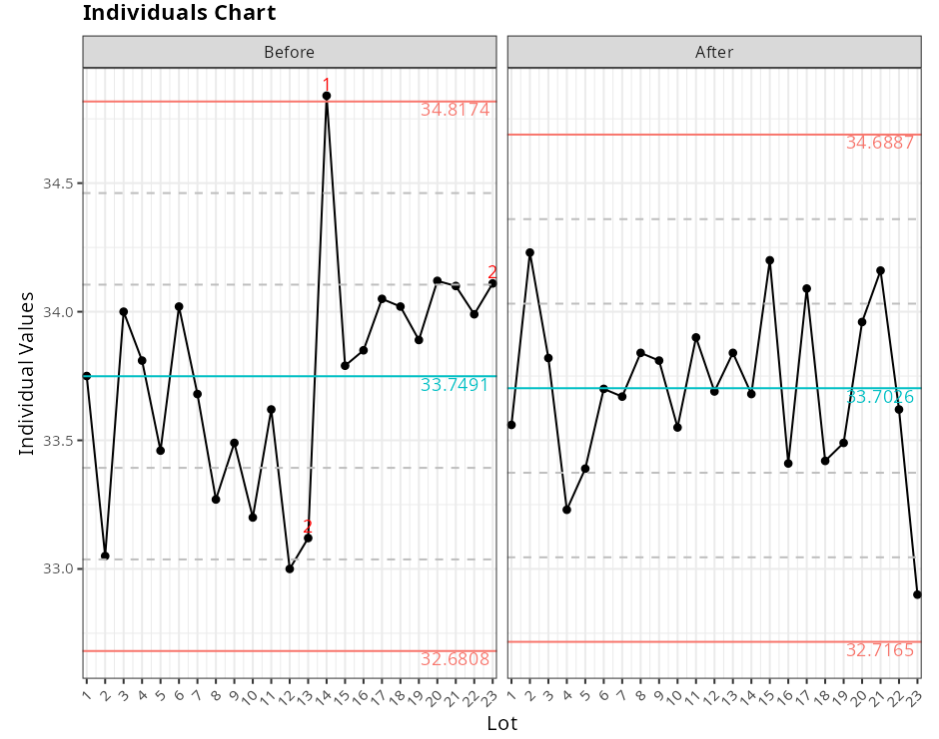
Individual Chart
| Before | After | |
|---|---|---|
| Upper Limit | 34.817 | 34.689 |
| Center line | 33.749 | 33.703 |
| Lower Limit | 32.681 | 32.716 |
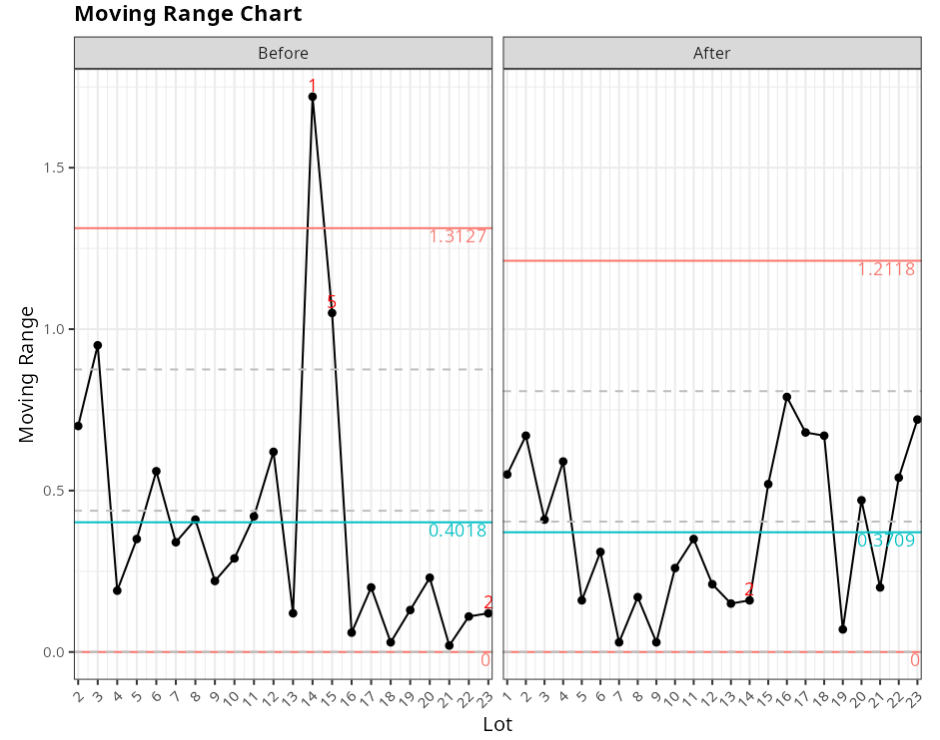
Moving Range Chart
| Before | After | |
|---|---|---|
| Upper Limit | 1.313 | 1.212 |
| Center line | 0.402 | 0.371 |
| Lower Limit | 0.000 | 0.000 |
Moving Range Chart (Standard Deviation)
| Before | After | |
|---|---|---|
| Standard Deviation | 0.356 | 0.329 |
Out of control points - Individual Values Chart
| Subgroups | Value | Factor | Test |
|---|---|---|---|
| 14 | 34.84 | Before | 1 point greater than 3 Sigmas from the center line |
| 13 | 33.12 | Before | 7 points or more in sequence on the same side of the center line |
| 23 | 34.11 | Before | 7 points or more in sequence on the same side of the center line |
Out of control points - Moving Amplitude Chart
| Subgroups | Value | Factor | Test |
|---|---|---|---|
| 14 | 1.72 | Before | 1 point greater than 3 Sigma from the center line |
| 23 | 0.12 | Before | 7 points or more in sequence on the same side of the center line |
| 15 | 1.05 | Before | 2 of 3 consecutive points greater than 2 sigmas from the center line |
| 14 | 0.16 | After | 7 points or more in sequence on the same side of the center line |