2. Defect per million opportunities
In many situations, we are interested in calculating a measure of process performance that takes into account the fact that it can There is more than one defect in each product.
Example:
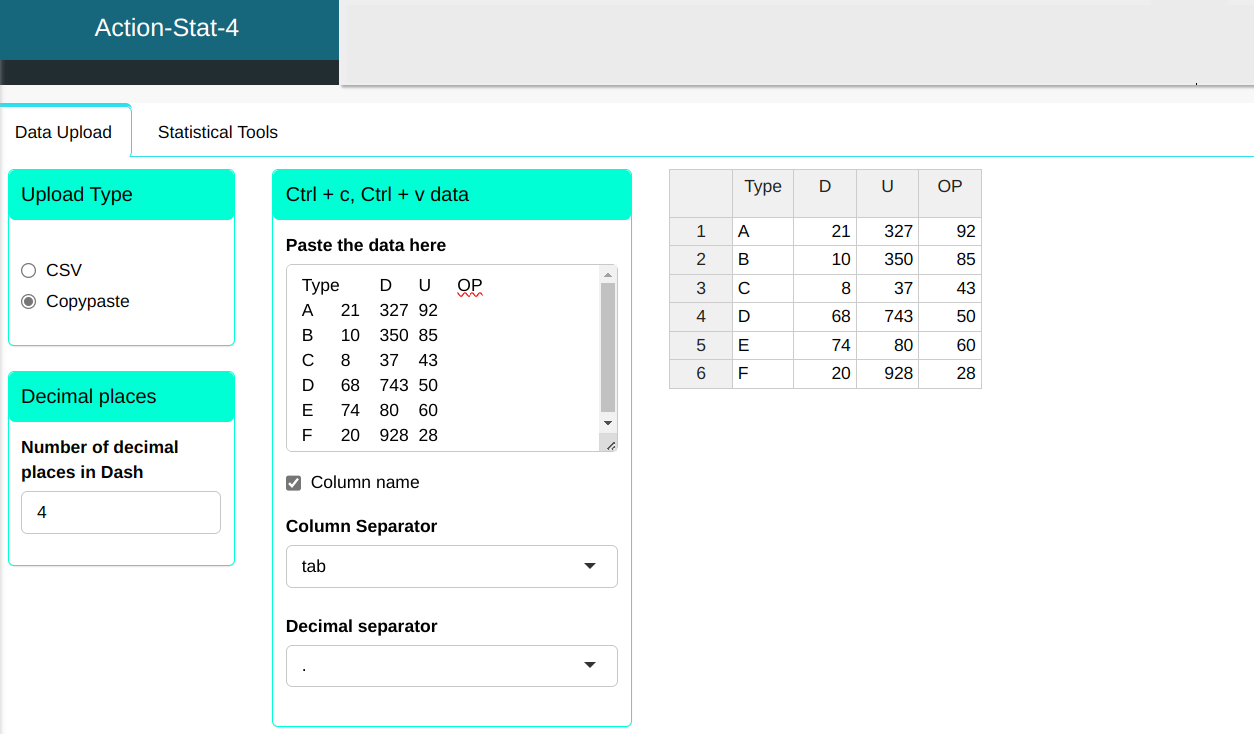
The defects found in the technical assistance of a product were classified into types 1, 2, 3, 4, 5 and 6. During a certain period of time, data were collected on the number of defects (D), units (U) and opportunities per unit.
| Type | D | U | OP |
|---|---|---|---|
| A | 21 | 327 | 92 |
| B | 10 | 350 | 85 |
| C | 8 | 37 | 43 |
| D | 68 | 743 | 50 |
| E | 74 | 80 | 60 |
| F | 20 | 928 | 28 |
We will upload the data to the system.
Configure as shown in the figure below to perform the analysis.
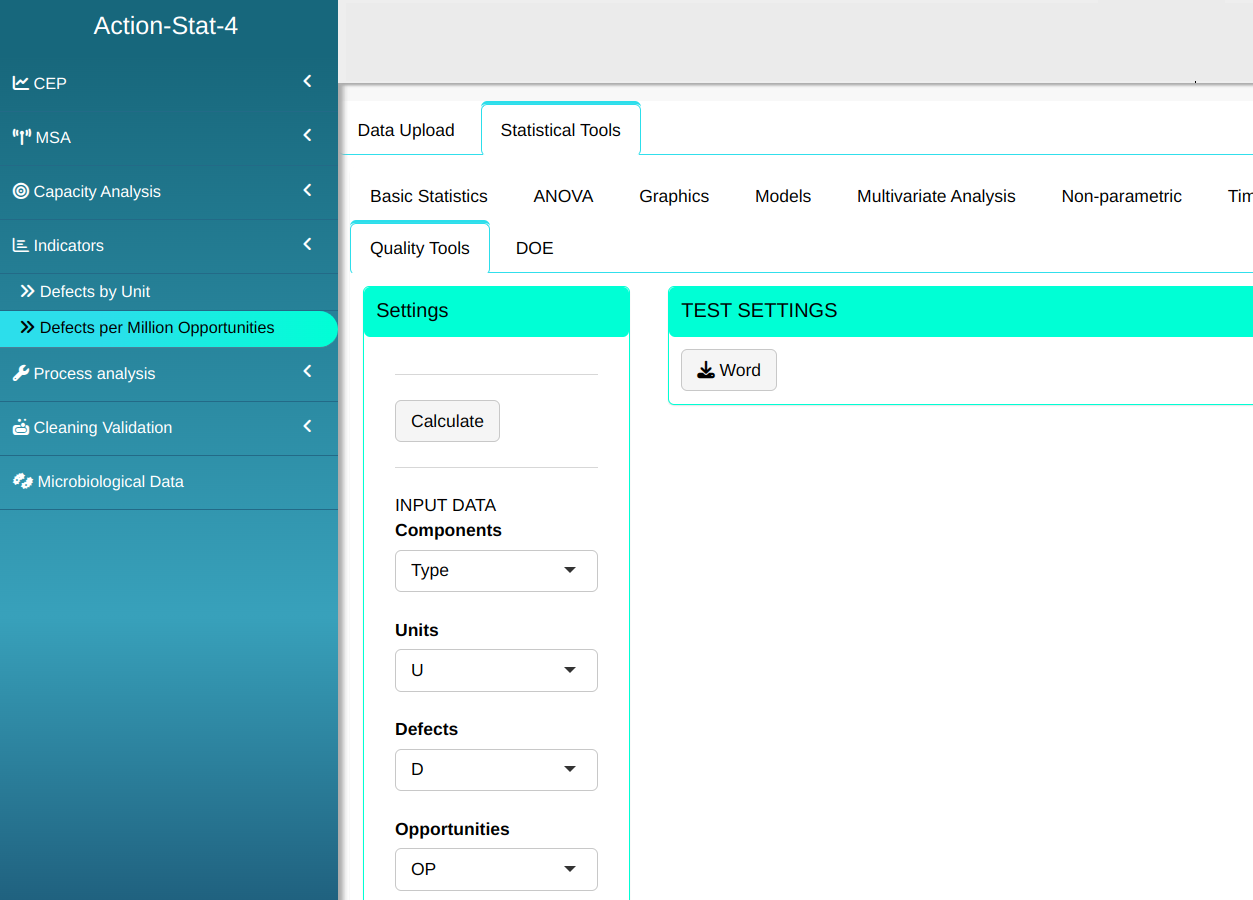

Then click Calculate we obtain the results. You can also generate the analyses and download them in Word format.

The results are:
Quality indicator - DPMO
| V1 | |
|---|---|
| Total DPO | 0.002 |
| Total DPMO | 1553.815 |
| Total Sigma Metric | 4.453 |
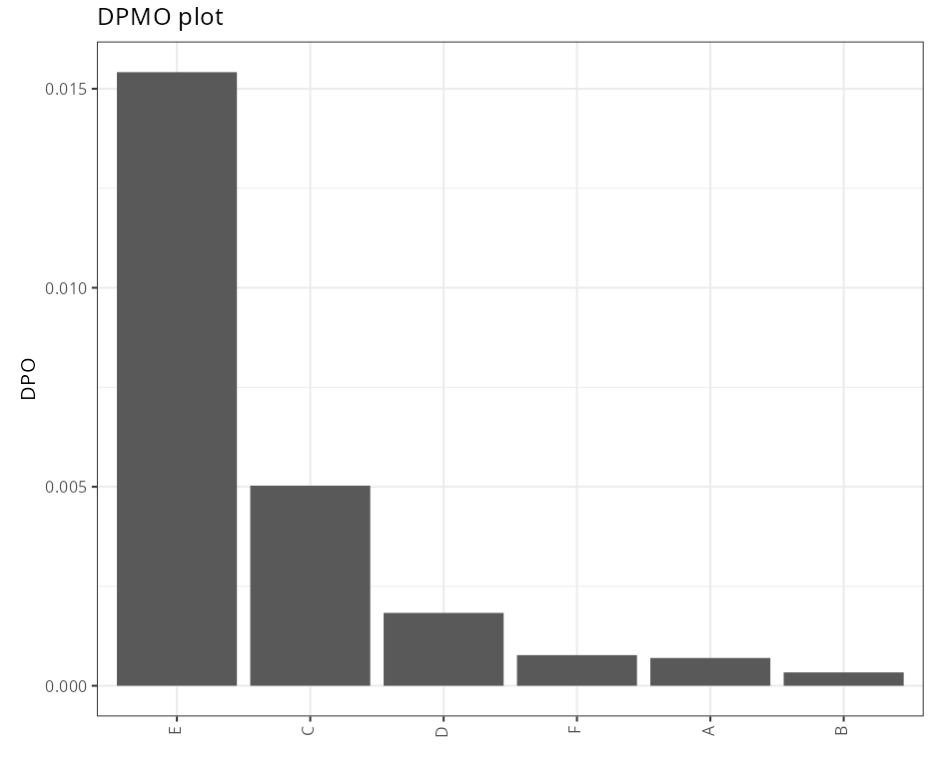
DPMO
| DPU | DPO | DPMO | Sigma Metric | |
|---|---|---|---|---|
| A | 0.064 | 0.001 | 698.045 | 4.691 |
| B | 0.029 | 0.000 | 336.134 | 4.896 |
| C | 0.216 | 0.005 | 5028.284 | 4.072 |
| D | 0.092 | 0.002 | 1830.417 | 4.402 |
| E | 0.925 | 0.015 | 15416.667 | 3.661 |
| F | 0.022 | 0.001 | 769.704 | 4.663 |
Last modified 19.11.2025: Atualizar Manual (288ad71)