1. Defect by Units
In many situations, we are interested in estimating the occurrence rate of defective components per unit of measurement.
Example:
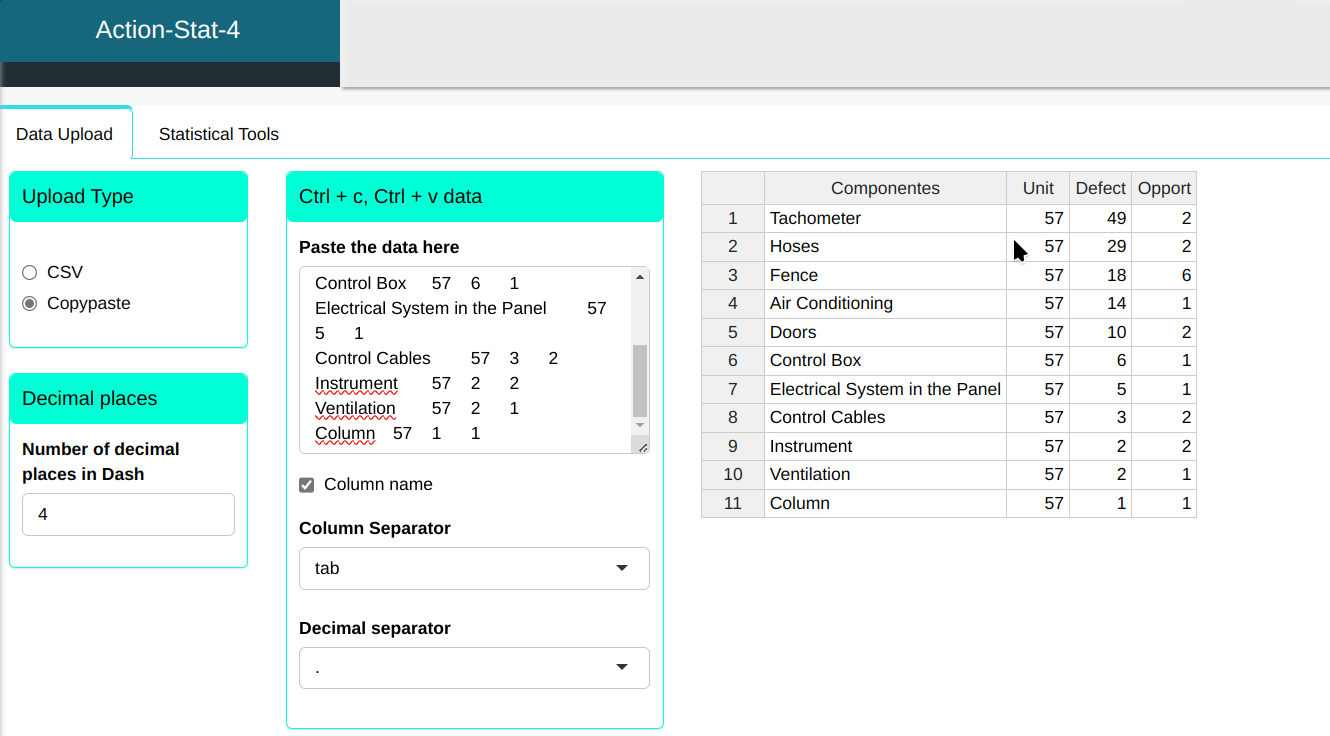
Consider a sugarcane harvesting machine where we will check the machine cab. Table 1 lists the types of defects, the units manufactured and the number of opportunities per defect. We will find confidence intervals for the cab product and also for each of its components.
| Components | Unit | Defect | Opportunity |
|---|---|---|---|
| Tachometer | 57 | 49 | 2 |
| Hoses | 57 | 29 | 2 |
| Fence | 57 | 18 | 6 |
| Air Conditioning | 57 | 14 | 1 |
| Doors | 57 | 10 | 2 |
| Control box | 57 | 6 | 1 |
| Electrical System in the Panel | 57 | 5 | 1 |
| Control cables | 57 | 3 | 2 |
| Instrument | 57 | 2 | 2 |
| Ventilation | 57 | 2 | 1 |
| Column | 57 | 1 | 1 |
We will upload the data to the system.
Configure as shown in the figure below to perform the analysis.
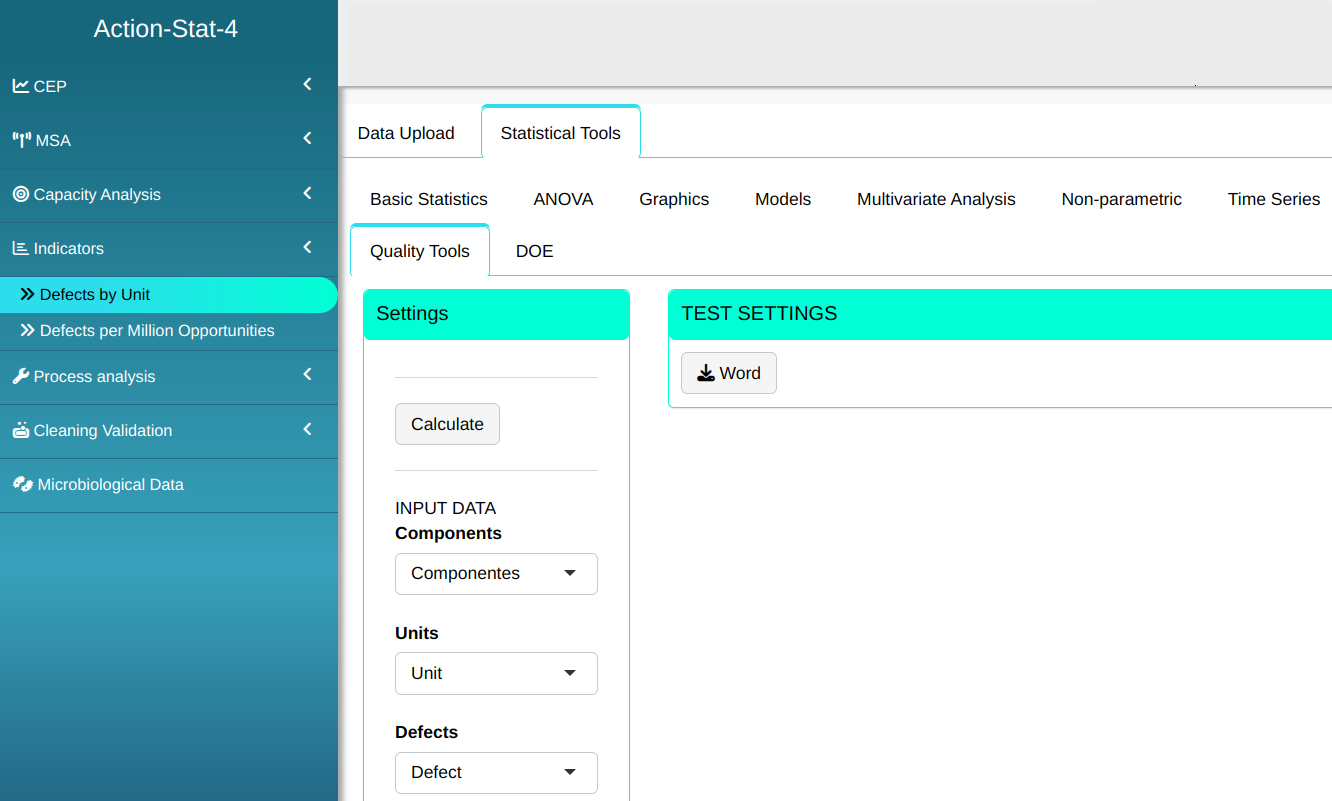

Then click Calculate we obtain the results. You can also generate the analyses and download them in Word format.

The results are:
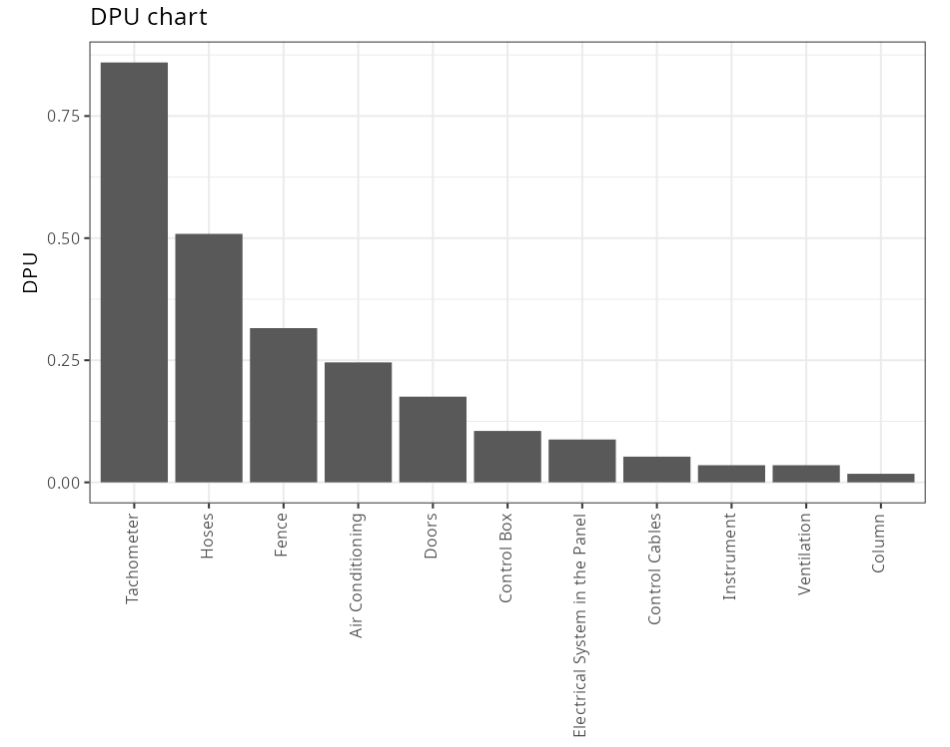
Quality indicator - DPU
| V1 | |
|---|---|
| Total PPM | 912716.732 |
| Total Yield | 0.087 |
| Total probability of defect | 0.913 |
| TOTAL SIGMA METRIC | 0.000 |
DPU Table
| DPU | Yield | Probability of Metric | SIGMA METRIC | |
|---|---|---|---|---|
| Tachometer | 0.860 | 0.423 | 0.577 | 0.000 |
| Hoses | 0.509 | 0.601 | 0.399 | 1.694 |
| Fence | 0.316 | 0.729 | 0.271 | 2.100 |
| Air Conditioning | 0.246 | 0.782 | 0.218 | 2.280 |
| Doors | 0.175 | 0.839 | 0.161 | 2.497 |
| Control box | 0.105 | 0.900 | 0.100 | 2.790 |
| Electrical system in the panel | 0.088 | 0.916 | 0.084 | 2.887 |
| Control cables | 0.053 | 0.949 | 0.051 | 3.139 |
| Instrument | 0.035 | 0.966 | 0.034 | 3.323 |
| Ventilation | 0.035 | 0.966 | 0.034 | 3.323 |
| Column | 0.018 | 0.983 | 0.017 | 3.613 |
Last modified 19.11.2025: Atualizar Manual (288ad71)