2. Stability by Variables with Subgroups
In variable measurement systems we need to assess whether the measurement process is stable over time. This evaluation is done using the control chart of the measurements obtained by an experiment over time.
Example:
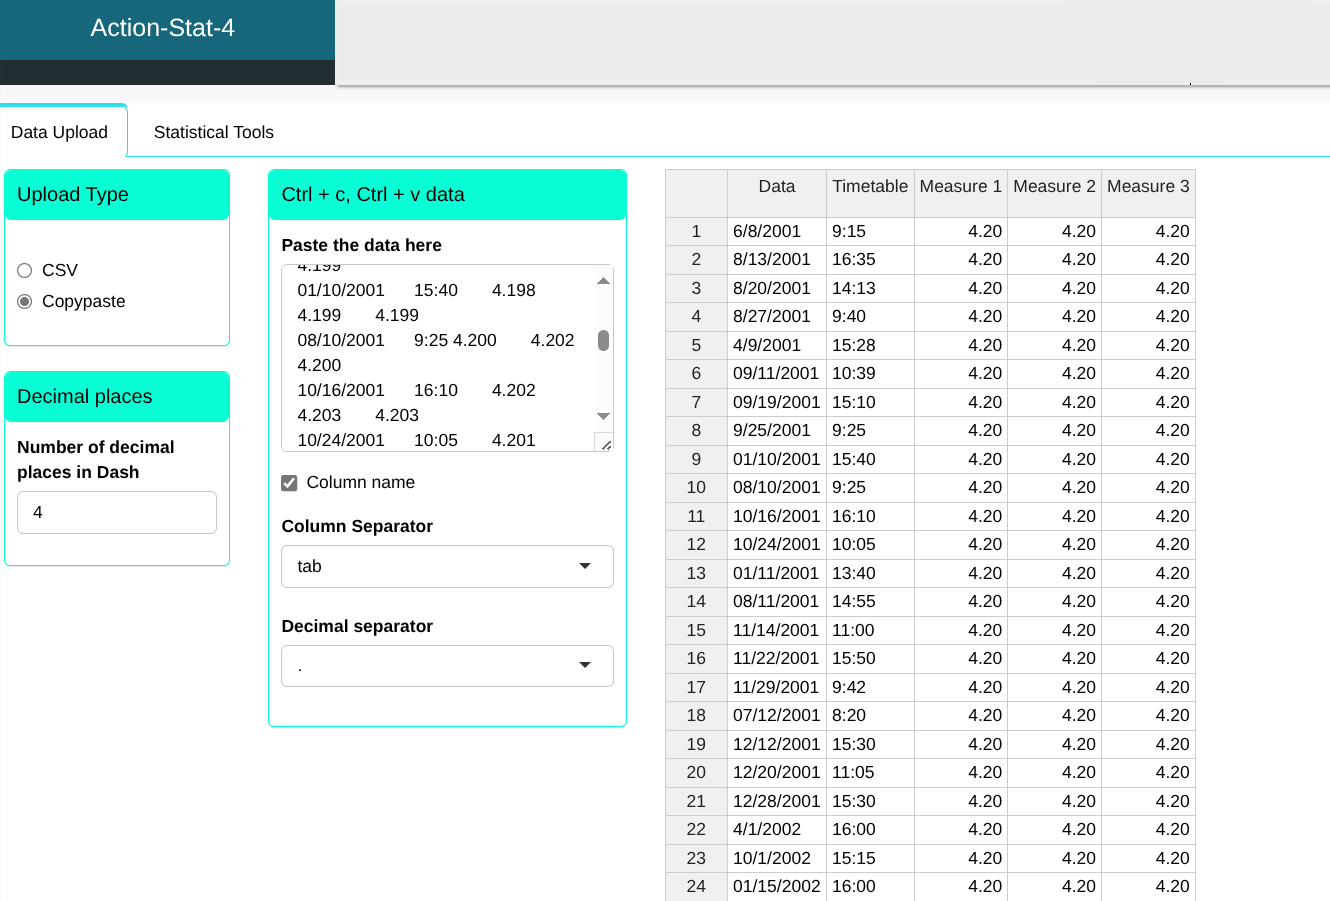
The technician must carry out a study on the stability and measurement to evaluate the diameter of a steel bar with a micrometer. The technician selected a piece. which was measured on a daily basis and subgroup size 3. by one evaluator.
The values are in the table:
| Data | Timetable | Measure 1 | Measure 2 | Measure 3 |
|---|---|---|---|---|
| 6/8/2001 | 9:15 | 4.202 | 4.201 | 4.202 |
| 8/13/2001 | 16:35 | 4.201 | 4.202 | 4.203 |
| 8/20/2001 | 14:13 | 4.199 | 4.198 | 4.200 |
| 8/27/2001 | 9:40 | 4.200 | 4.201 | 4.201 |
| 4/9/2001 | 15:28 | 4.200 | 4.201 | 4.200 |
| 09/11/2001 | 10:39 | 4.202 | 4.201 | 4.200 |
| 09/19/2001 | 15:10 | 4.200 | 4.201 | 4.200 |
| 9/25/2001 | 9:25 | 4.200 | 4.199 | 4.199 |
| 01/10/2001 | 15:40 | 4.198 | 4.199 | 4.199 |
| 08/10/2001 | 9:25 | 4.200 | 4.202 | 4.200 |
| 10/16/2001 | 16:10 | 4.202 | 4.203 | 4.203 |
| 10/24/2001 | 10:05 | 4.201 | 4.202 | 4.201 |
| 01/11/2001 | 13:40 | 4.199 | 4.199 | 4.198 |
| 08/11/2001 | 14:55 | 4.200 | 4.200 | 4.201 |
| 11/14/2001 | 11:00 | 4.199 | 4.198 | 4.199 |
| 11/22/2001 | 15:50 | 4.200 | 4.199 | 4.200 |
| 11/29/2001 | 9:42 | 4.201 | 4.201 | 4.200 |
| 07/12/2001 | 8:20 | 4.199 | 4.200 | 4.199 |
| 12/12/2001 | 15:30 | 4.200 | 4.201 | 4.199 |
| 12/20/2001 | 11:05 | 4.199 | 4.199 | 4.200 |
| 12/28/2001 | 15:30 | 4.201 | 4.200 | 4.199 |
| 4/1/2002 | 16:00 | 4.200 | 4.200 | 4.202 |
| 10/1/2002 | 15:15 | 4.203 | 4.204 | 4.203 |
| 01/15/2002 | 16:00 | 4.204 | 4.203 | 4.203 |
We will upload the data to the system.
Configuring as shown in the figure below to perform the analysis.
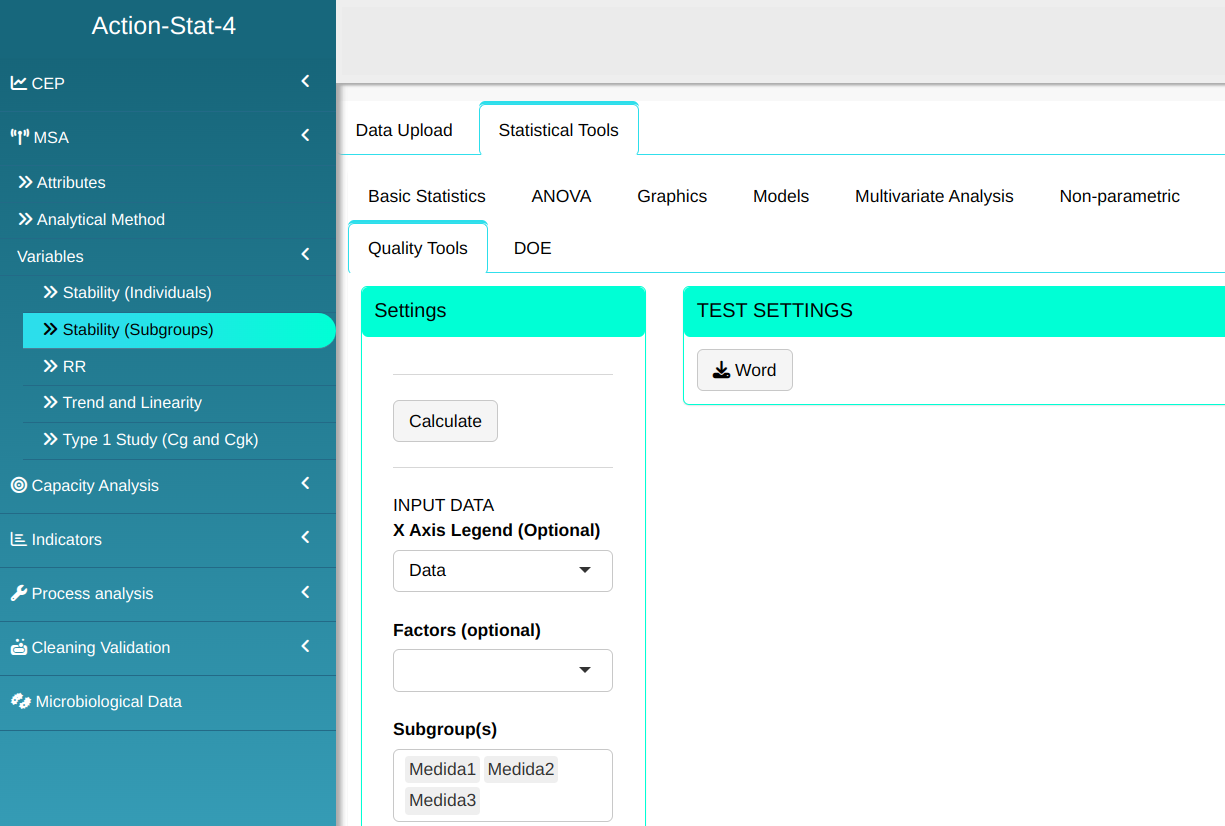
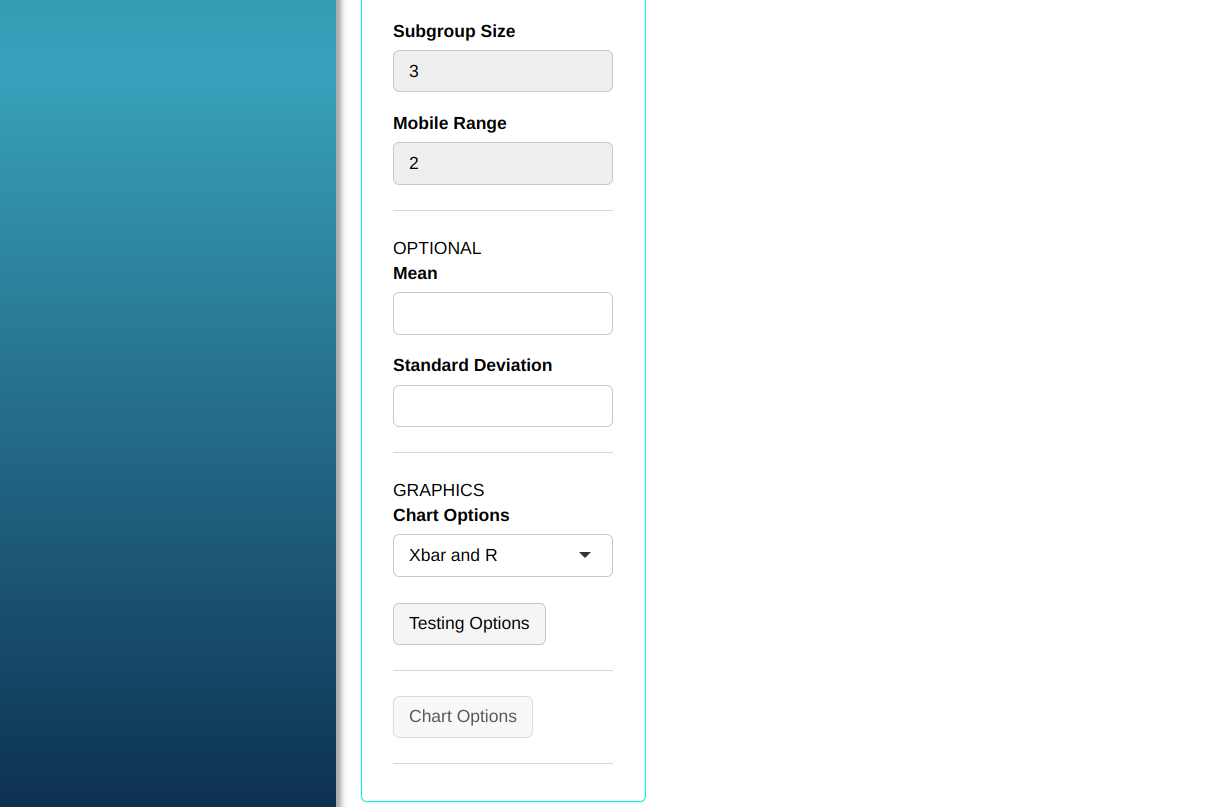
- Click “Select Tests” to decide which tests to run. In our case, we’ll select all of them. Then, click OK.
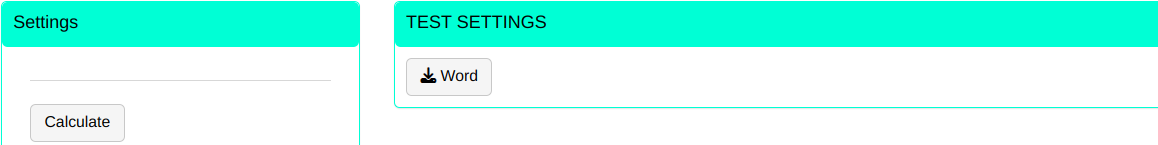
Then click Calculate to get the results. You can also generate the analyses and download them in Word format.
The results are:
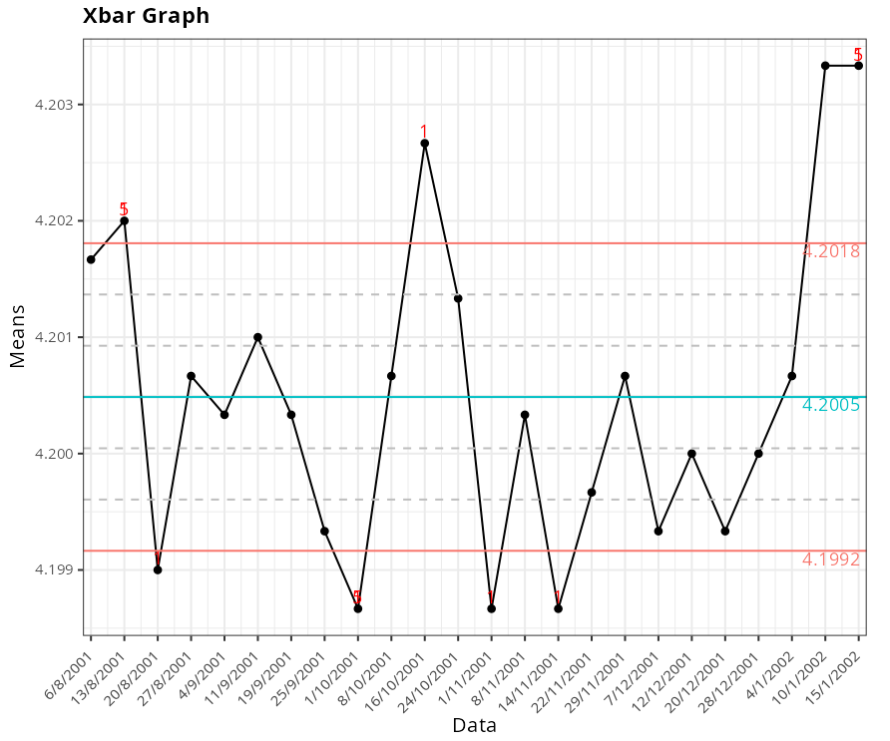
Xbar Chart
| Value | |
|---|---|
| Upper limit | 4.202 |
| Center line | 4.200 |
| Lower limit | 4.199 |
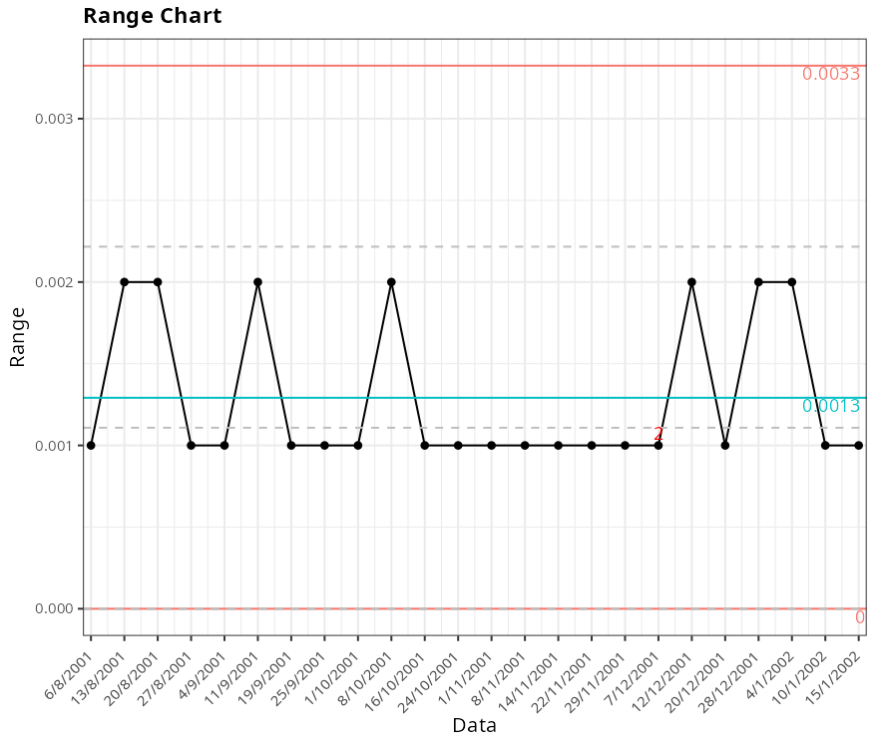
Range Chart
| Value | |
|---|---|
| Upper limit | 0.0033 |
| Center line | 0.0013 |
| Lower limit | 0 |
| Standard deviation | 0.0008 |
Out of Control points - Xbar Graph
| Subgroups | Value | Test |
|---|---|---|
| 13/08/01 | 4.2020 | 1 point greater than 3 sigmas from the center line |
| 20/08/01 | 4.1990 | 1 point greater than 3 sigmas from the center line |
| 01/10/01 | 4.1987 | 1 point greater than 3 sigmas from the center line |
| 16/10/01 | 4.2027 | 1 point greater than 3 sigmas from the center line |
| 01/11/01 | 4.1987 | 1 point greater than 3 sigmas from the center line |
| 14/11/01 | 4.1987 | 1 point greater than 3 sigmas from the center line |
| 15/01/02 | 4.2033 | 1 point greater than 3 sigmas from the center line |
| 13/08/01 | 4.2020 | 2 of 3 consecutive points greater than 2 sigmas from the center line |
| 01/10/01 | 4.1987 | 2 of 3 consecutive points greater than 2 sigmas from the center line |
| 15/01/02 | 4.2033 | 2 of 3 consecutive points greater than 2 sigmas from the center line |
Out of control points - Range Chart
| Subgroups | Value | Test |
|---|---|---|
| 07/12/01 | 0.0010 | 7 points or more in sequence on the same side of the center line |
Last modified 19.11.2025: Atualizar Manual (288ad71)