1. Stability by individual variables
In variable measurement systems we need to evaluate whether the process the measurement is stable over time. This evaluation is carried out through the control chart of measurements obtained through an experiment over time.
Example:
Description of the experiment:
-
Produce a lots of fairly homogeneous specimens (same run);;
-
The bodies do not degrade during the time it realization to experiment;
-
Availability of a large number of test bodies..
1º Step:
To carry out the experiment we used 32 bodies of test whose characteristics such as raw material used. machine that produced. process and evaluator are as uniform as possible.
2º Step:
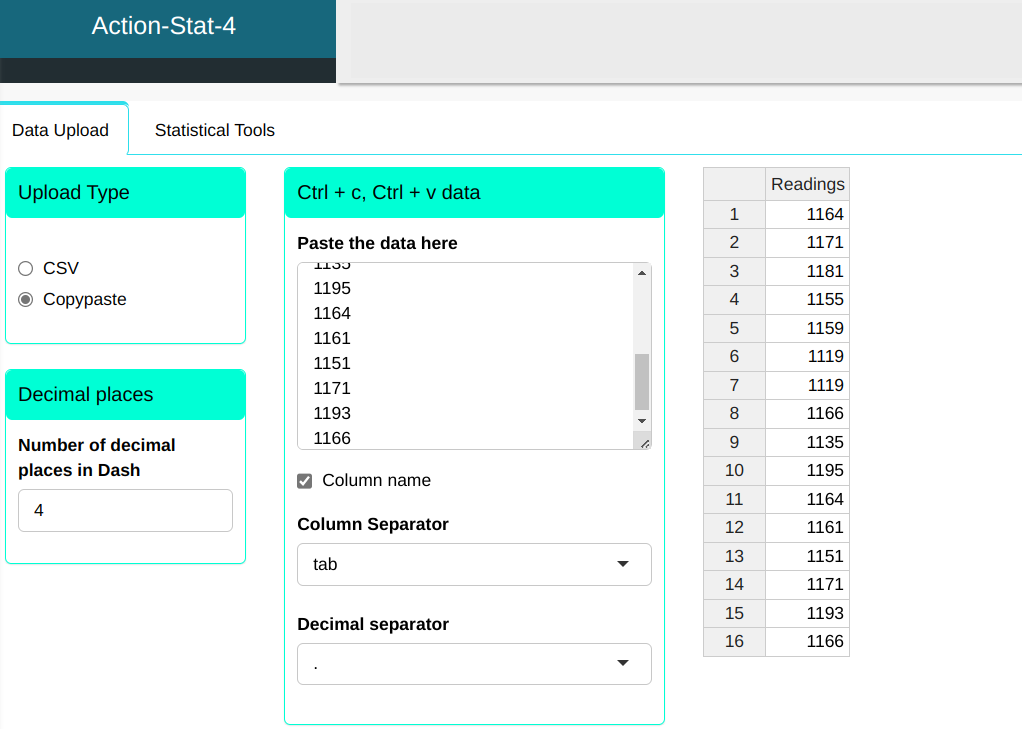
Using 16 samples (half of the batch). We carried out a stability study of the I-MR process with which we verify. through the control limits. the variability of the process. These 16 specimens are measured on the same day.
| Readings |
|---|
| 1164 |
| 1171 |
| 1181 |
| 1155 |
| 1159 |
| 1119 |
| 1119 |
| 1166 |
| 1135 |
| 1195 |
| 1164 |
| 1161 |
| 1151 |
| 1171 |
| 1193 |
| 1166 |
To perform the analysis we configure according to the figure below.
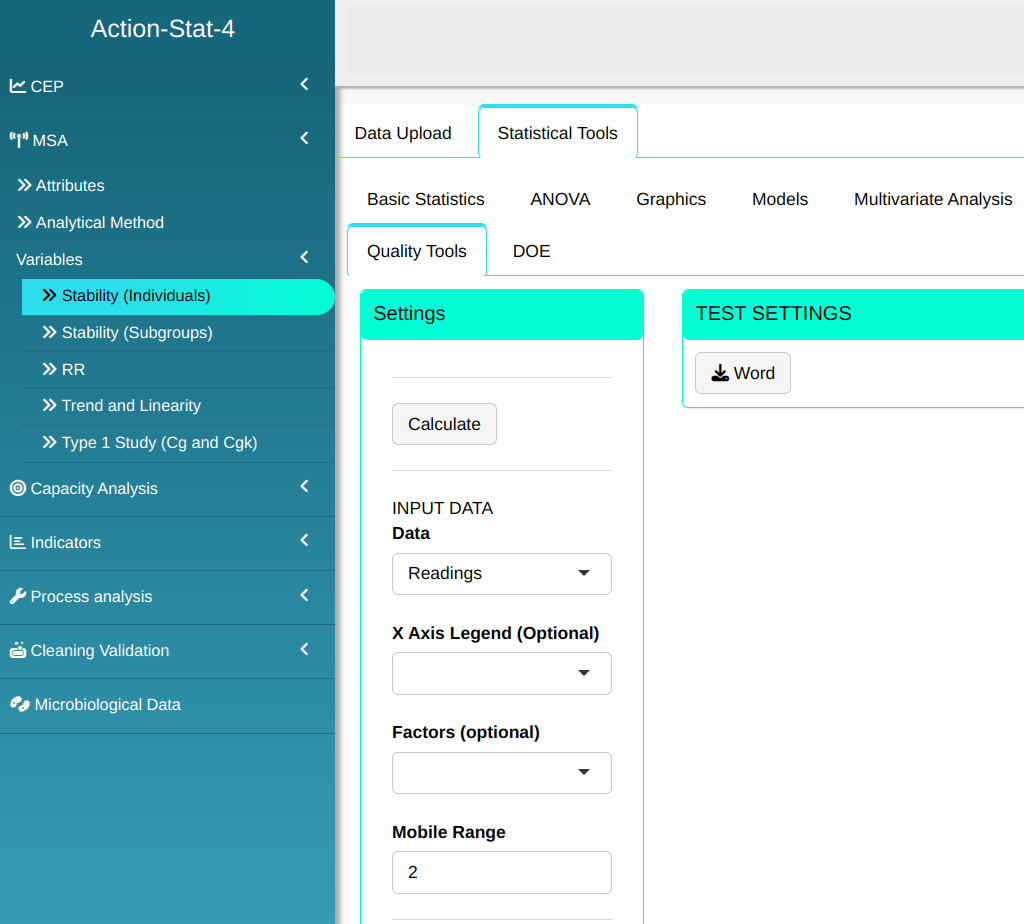
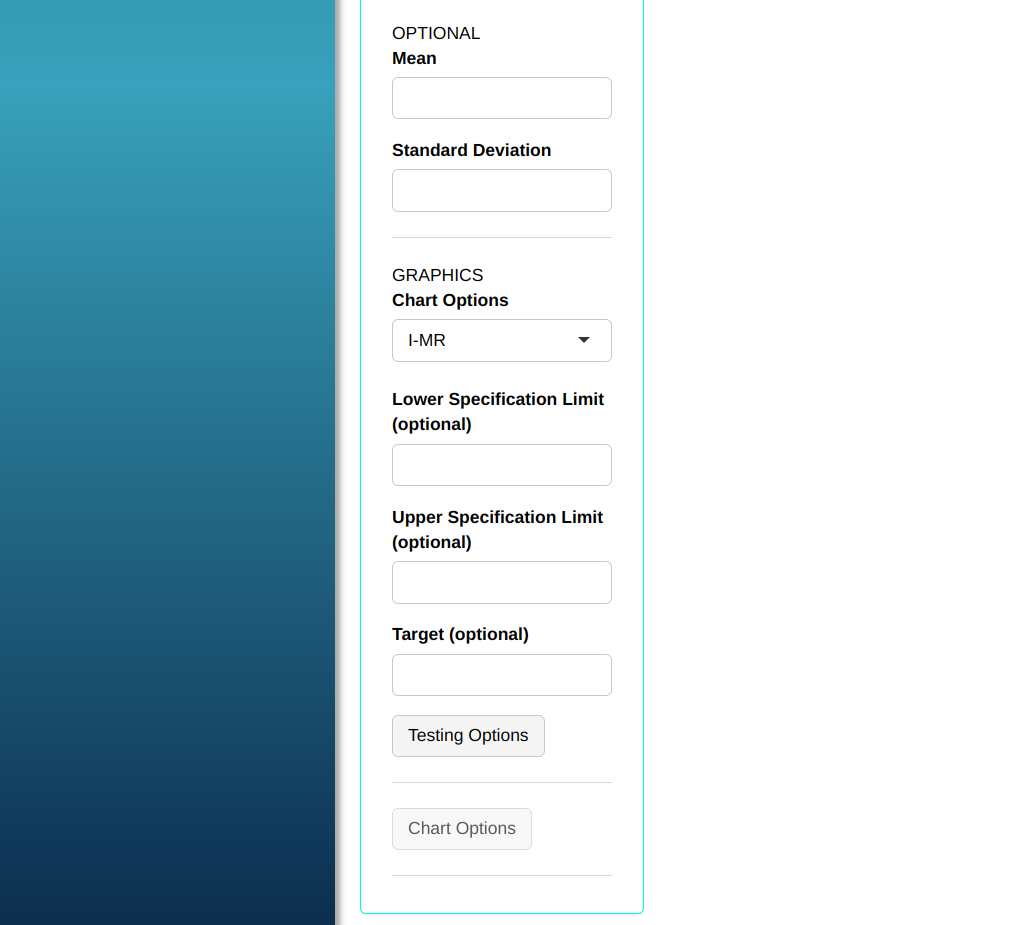
- Click “Select Tests” to decide which tests to run. In our case, we’ll select all of them. Then, click OK.
By clicking on Calculate we obtain the results.
The results are:
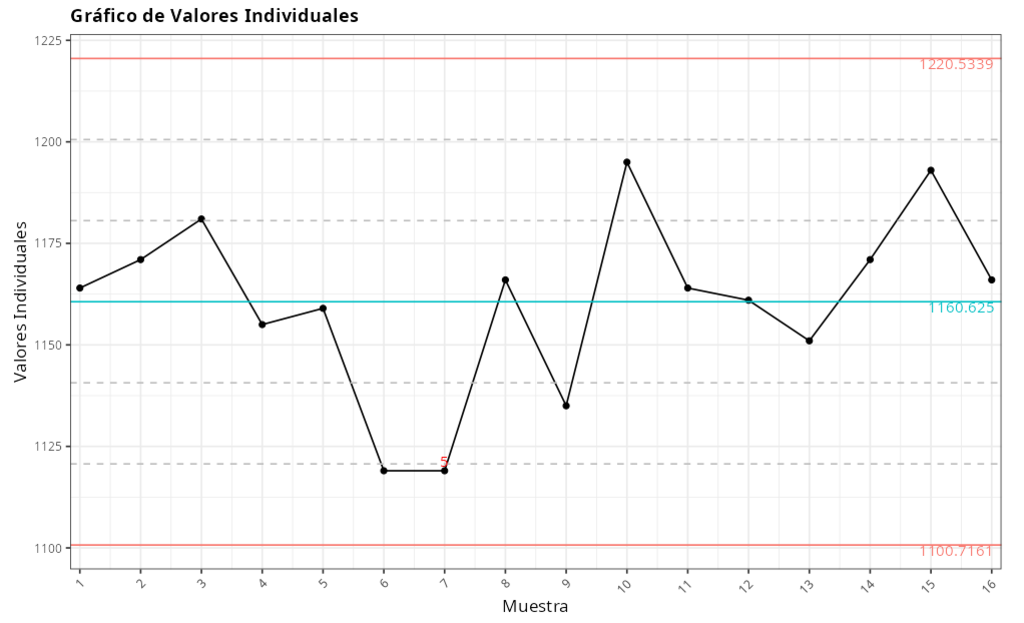
Table of individual values
| Value | |
|---|---|
| Upper limit | 1220.534 |
| Center line | 1160.625 |
| Lower limit | 1100.716 |
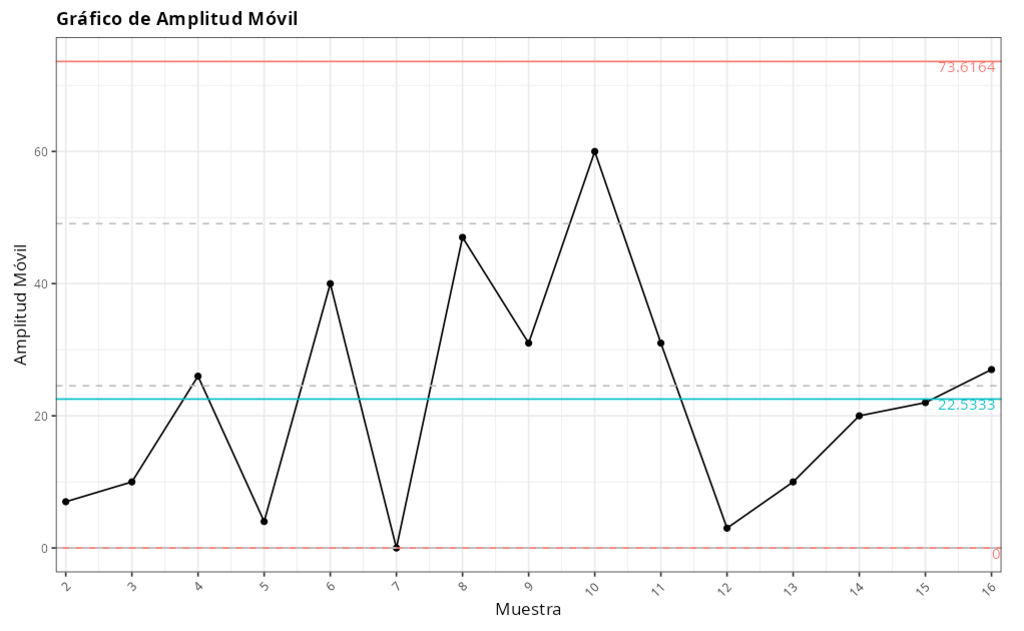
Moving amplitude graph
| Value | |
|---|---|
| Upper limit | 73.616 |
| Center line | 22.533 |
| Lower limit | 0.000 |
| Standard deviation | 19.970 |
Out of Control Points - Individual Value Table
| Subgroups | Value | Test |
|---|---|---|
| 7 | 1119 | 2 of 3 consecutive points greater than 2 standard deviations from the center line |