3. Repeatability and Reproducibility
Repeatability and reproducibility is the sum of the variations due to the lack of repeatability and reproducibility. They can be used to estimate the variability associated with the measurement system.
Example 1:
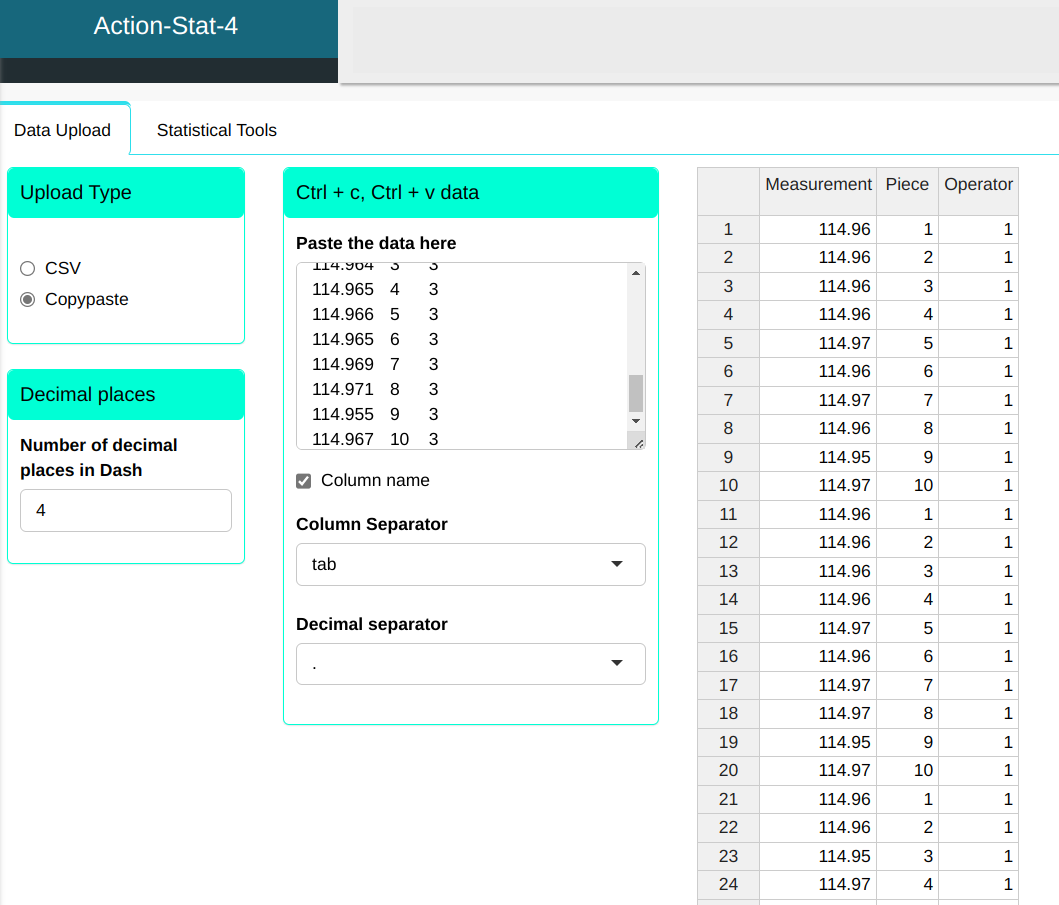
Consider a measuring system for measuring the internal diameter of a bearing. The quality engineer carried out an experiment with 10 parts, 3 operators and 3 repetitions for each operator and part. he data referring to this experiment is set out in the .CSV file
| Measurement | Parts | Operator |
|---|---|---|
| 114.958 | 1 | 1 |
| 114.957 | 2 | 1 |
| 114.962 | 3 | 1 |
| 114.963 | 4 | 1 |
| 114.965 | 5 | 1 |
| 114.963 | 6 | 1 |
| 114.967 | 7 | 1 |
| 114.963 | 8 | 1 |
| 114.953 | 9 | 1 |
| 114.967 | 10 | 1 |
| 114.957 | 1 | 1 |
| 114.958 | 2 | 1 |
| 114.962 | 3 | 1 |
| 114.963 | 4 | 1 |
| 114.965 | 5 | 1 |
| 114.962 | 6 | 1 |
| 114.967 | 7 | 1 |
| 114.968 | 8 | 1 |
| 114.952 | 9 | 1 |
| 114.967 | 10 | 1 |
| 114.958 | 1 | 1 |
| 114.958 | 2 | 1 |
| 114.953 | 3 | 1 |
| 114.965 | 4 | 1 |
| 114.967 | 5 | 1 |
| 114.962 | 6 | 1 |
| 114.967 | 7 | 1 |
| 114.968 | 8 | 1 |
| 114.953 | 9 | 1 |
| 114.966 | 10 | 1 |
| 114.962 | 1 | 2 |
| 114.956 | 2 | 2 |
| 114.963 | 3 | 2 |
| 114.965 | 4 | 2 |
| 114.966 | 5 | 2 |
| 114.965 | 6 | 2 |
| 114.969 | 7 | 2 |
| 114.97 | 8 | 2 |
| 114.955 | 9 | 2 |
| 114.965 | 10 | 2 |
| 114.961 | 1 | 2 |
| 114.957 | 2 | 2 |
| 114.963 | 3 | 2 |
| 114.966 | 4 | 2 |
| 114.967 | 5 | 2 |
| 114.963 | 6 | 2 |
| 114.97 | 7 | 2 |
| 114.968 | 8 | 2 |
| 114.955 | 9 | 2 |
| 114.964 | 10 | 2 |
| 114.961 | 1 | 2 |
| 114.96 | 2 | 2 |
| 114.963 | 3 | 2 |
| 114.966 | 4 | 2 |
| 114.968 | 5 | 2 |
| 114.965 | 6 | 2 |
| 114.968 | 7 | 2 |
| 114.969 | 8 | 2 |
| 114.953 | 9 | 2 |
| 114.965 | 10 | 2 |
| 114.958 | 1 | 3 |
| 114.96 | 2 | 3 |
| 114.965 | 3 | 3 |
| 114.966 | 4 | 3 |
| 114.967 | 5 | 3 |
| 114.964 | 6 | 3 |
| 114.97 | 7 | 3 |
| 114.97 | 8 | 3 |
| 114.955 | 9 | 3 |
| 114.966 | 10 | 3 |
| 114.958 | 1 | 3 |
| 114.959 | 2 | 3 |
| 114.965 | 3 | 3 |
| 114.965 | 4 | 3 |
| 114.966 | 5 | 3 |
| 114.965 | 6 | 3 |
| 114.97 | 7 | 3 |
| 114.97 | 8 | 3 |
| 114.954 | 9 | 3 |
| 114.966 | 10 | 3 |
| 114.958 | 1 | 3 |
| 114.958 | 2 | 3 |
| 114.964 | 3 | 3 |
| 114.965 | 4 | 3 |
| 114.966 | 5 | 3 |
| 114.965 | 6 | 3 |
| 114.969 | 7 | 3 |
| 114.971 | 8 | 3 |
| 114.955 | 9 | 3 |
| 114.967 | 10 | 3 |
We will upload the data to the system.
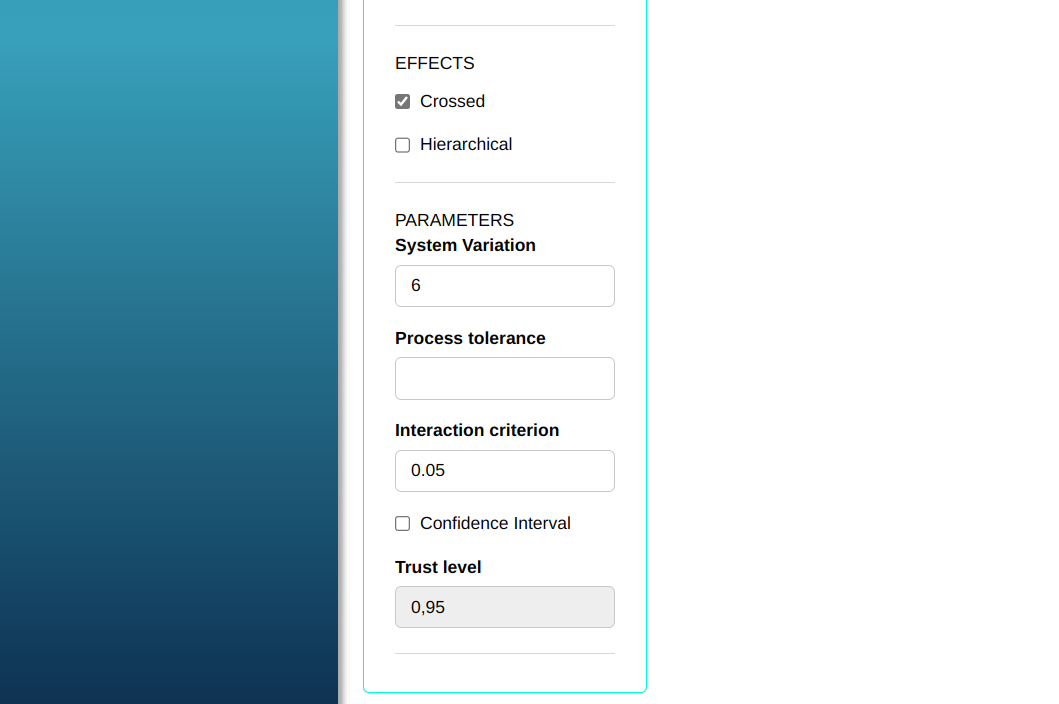
Configuring as shown in the figure below to perform the analysis.
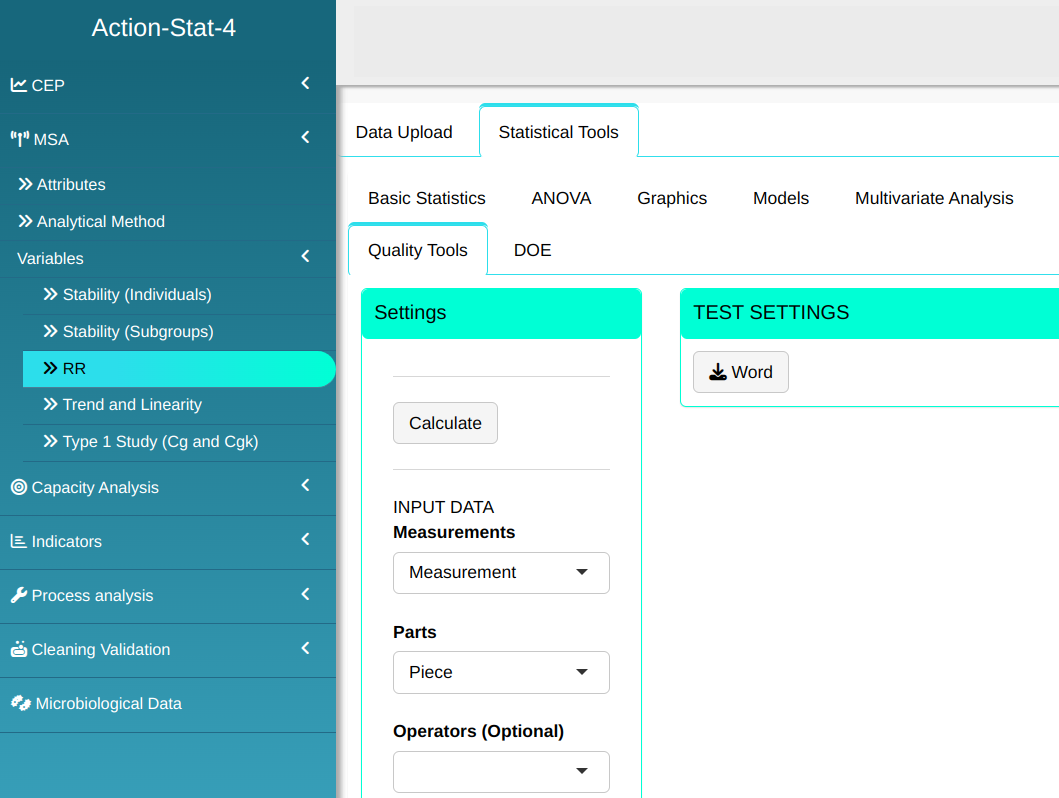
Then click Calculate to get the results. You can also generate the analyses and download them in Word format.

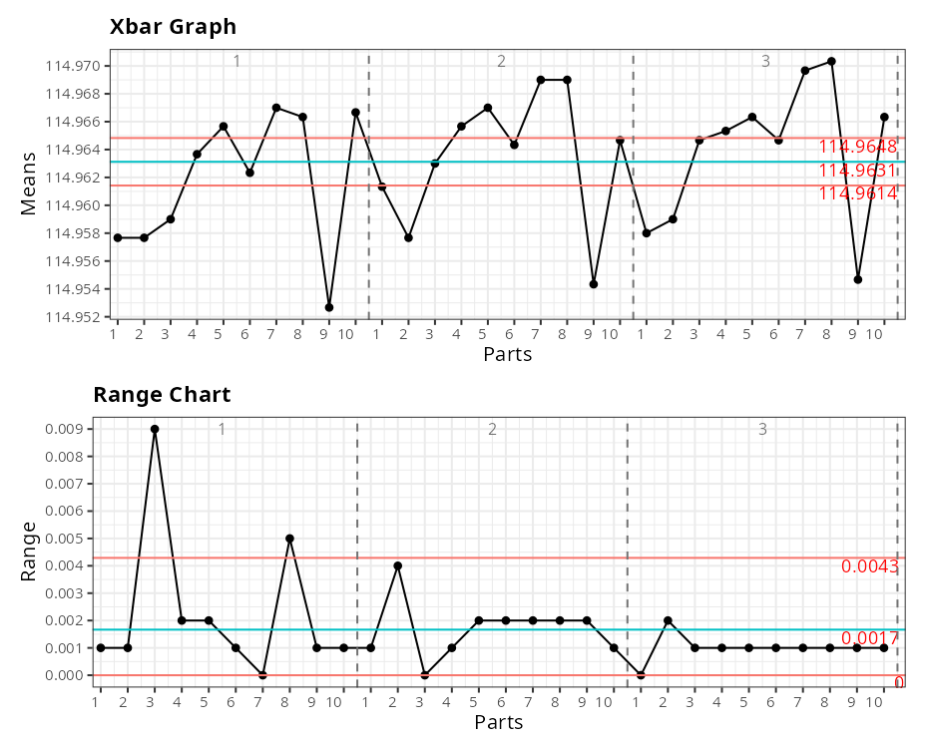
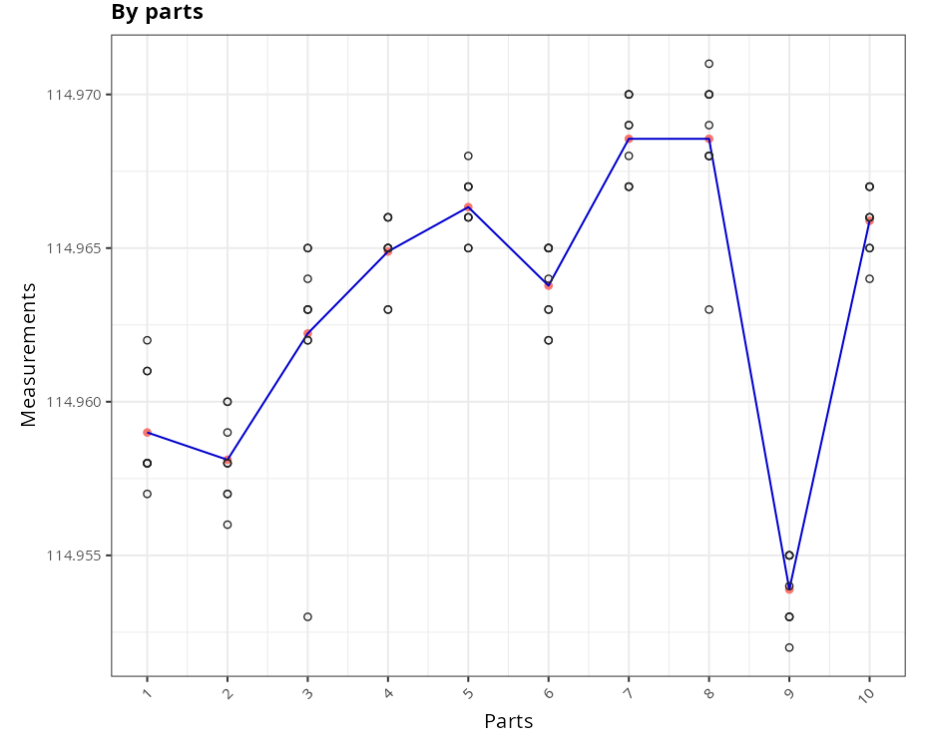
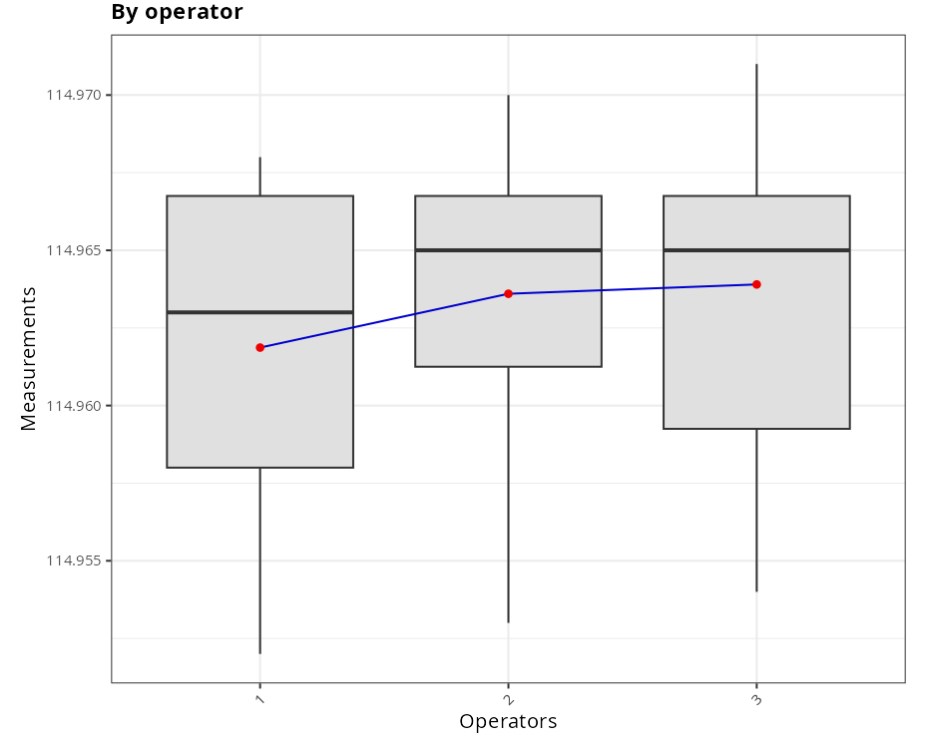
The results are:
ANOVA TABLE
| D.F. | Sum of the squares | Mean Squares | F Statistics | P-Value | |
|---|---|---|---|---|---|
| Parts | 9 | 0.001879 | 0.000209 | 49.334403 | 0.000 |
| Operators | 2 | 0.000072 | 0.000036 | 8.543041 | 0.0024 |
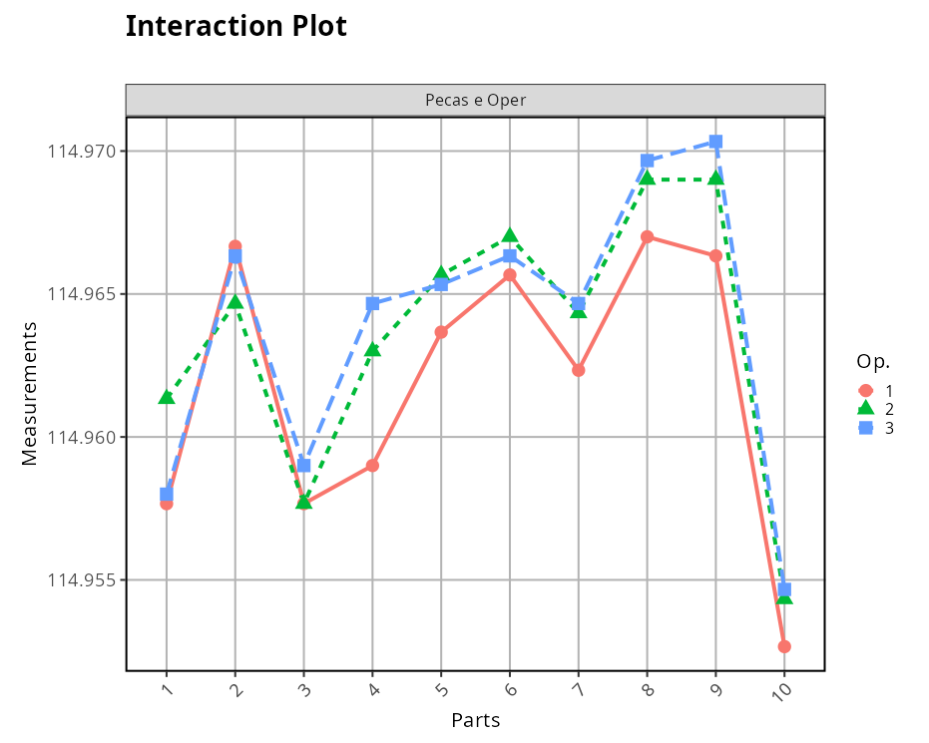
| Interaction | 18 | 0.000076 | 0.000004 | 2.33606 | 0.0074 |
| Repeatability | 60 | 0.000109 | 0.000002 |
CONTRIBUTION TABLE
| Variances | Contribution (%) | |
|---|---|---|
| Repeatability | 0 | 6.859 |
| Reproducibility | 0 | 7.084 |
| Operators | 0 | 4.029 |
| Interaction | 0 | 3.055 |
| Partss | 0 | 86.057 |
| Repeatability and Reproducibility | 0 | 13.943 |
| Total | 0 | 100.000 |
TOTAL VARIANCE AND/OR TOLERANCE
| Standard Deviation | Total Variation (%) | |
|---|---|---|
| Repeatability | 0.001 | 26.190 |
| Reproducibility | 0.001 | 26.616 |
| Operators | 0.001 | 20.072 |
| Interaction | 0.001 | 17.478 |
| Parts | 0.005 | 92.767 |
| Repeatability and reproducibility | 0.002 | 37.341 |
| Total | 0.005 | 100.000 |
| Analysis result | ||
| $\qquad \quad$ NDC: 3 |
Example 2:
Consider a measurement system for measuring the diameter of a Parts. The quality engineer carried out an experiment with 15 parts and 3 measurements per parts. The data referring to this experiment is available in the following table.
| Parts | Measurement |
|---|---|
| 1 | 461.28 |
| 2 | 458.17 |
| 3 | 460.57 |
| 4 | 459.28 |
| 5 | 461.28 |
| 6 | 460.25 |
| 7 | 458.82 |
| 8 | 461.58 |
| 9 | 459.36 |
| 10 | 459.62 |
| 11 | 461.38 |
| 12 | 458.67 |
| 13 | 462.57 |
| 14 | 459.58 |
| 15 | 461.76 |
| 1 | 461.50 |
| 2 | 458.62 |
| 3 | 460.28 |
| 4 | 459.66 |
| 5 | 461.12 |
| 6 | 460.68 |
| 7 | 458.95 |
| 8 | 461.10 |
| 9 | 459.52 |
| 10 | 459.34 |
| 11 | 461.57 |
| 12 | 459.03 |
| 13 | 462.28 |
| 14 | 459.66 |
| 15 | 461.12 |
| 1 | 461.20 |
| 2 | 458.61 |
| 3 | 460.32 |
| 4 | 459.58 |
| 5 | 461.18 |
| 6 | 460.28 |
| 7 | 458.66 |
| 8 | 461.18 |
| 9 | 459.57 |
| 10 | 459.54 |
| 11 | 461.53 |
| 12 | 458.98 |
| 13 | 462.32 |
| 14 | 459.28 |
| 15 | 461.15 |
We will upload the data to the system.
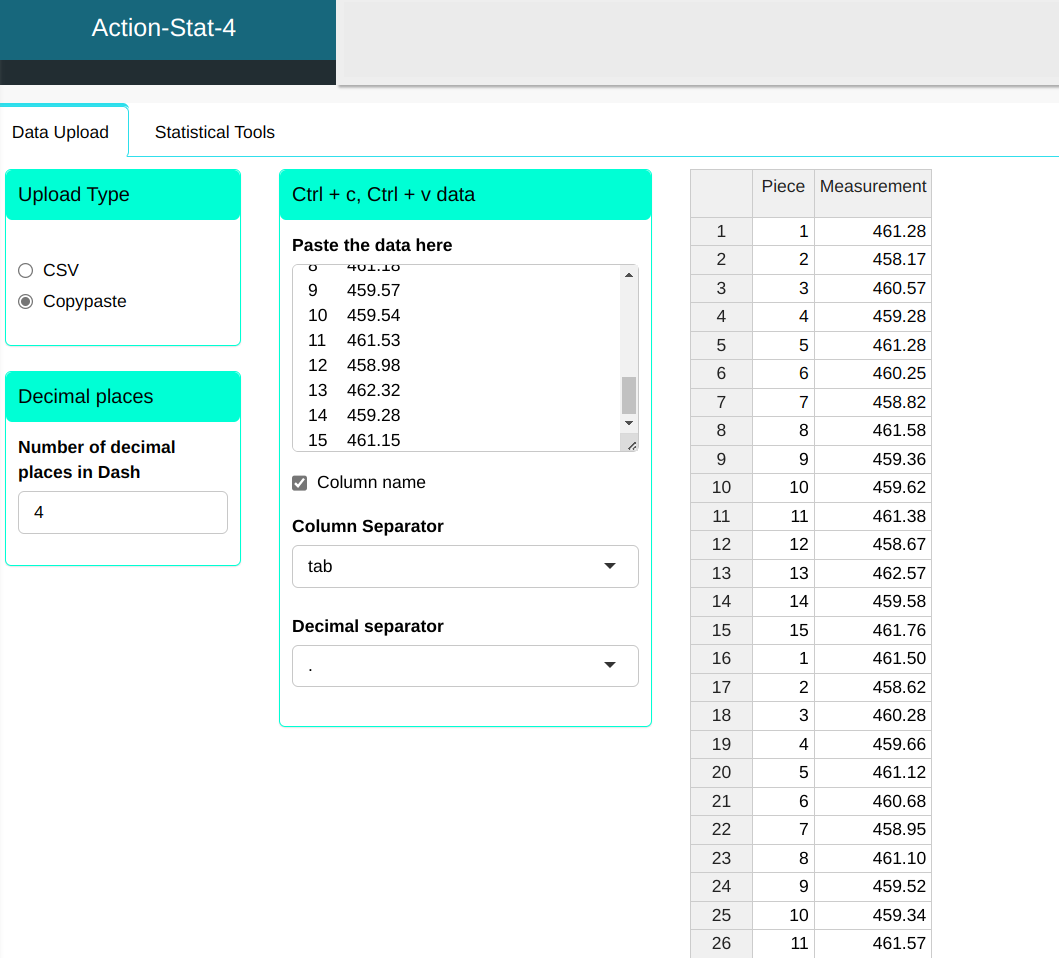
Configuring as shown in the figure below to perform the analysis.

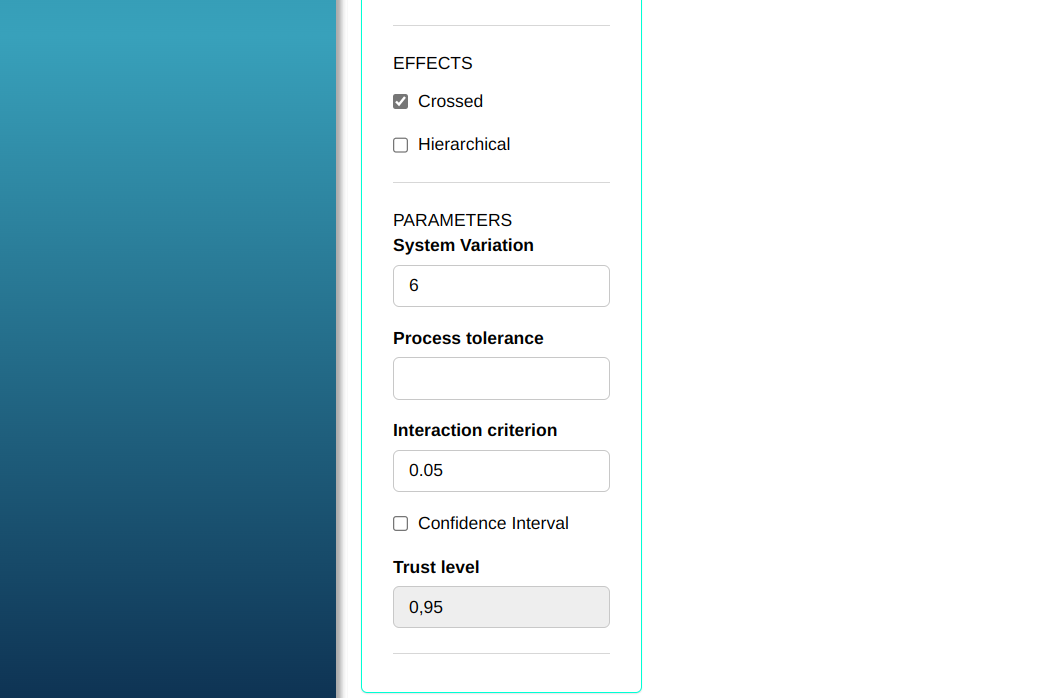
Then click Calculate to get the results. You can also generate the analyses and download them in Word format.
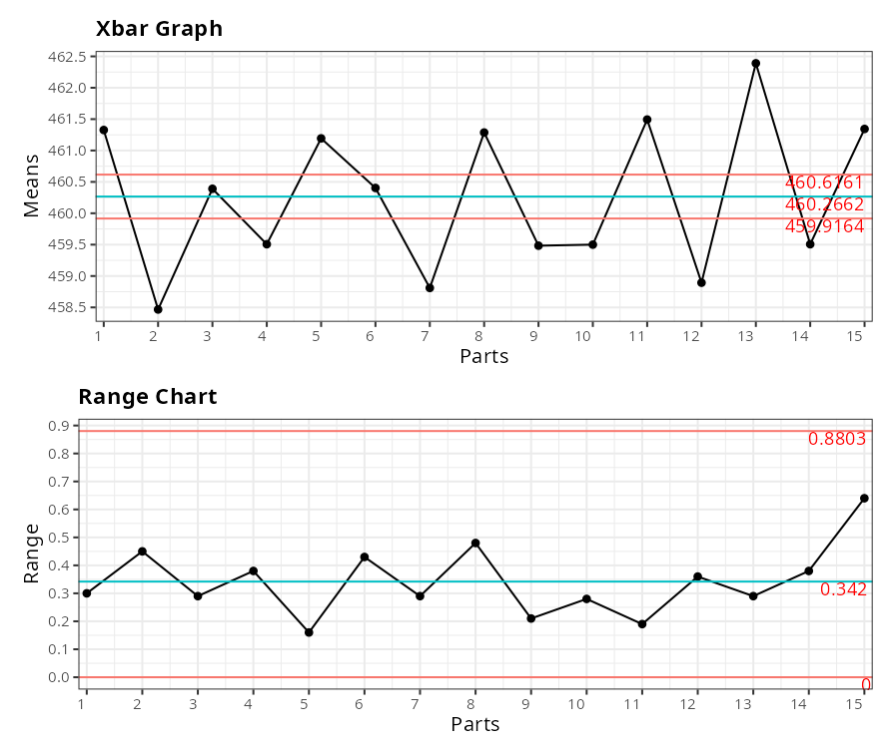
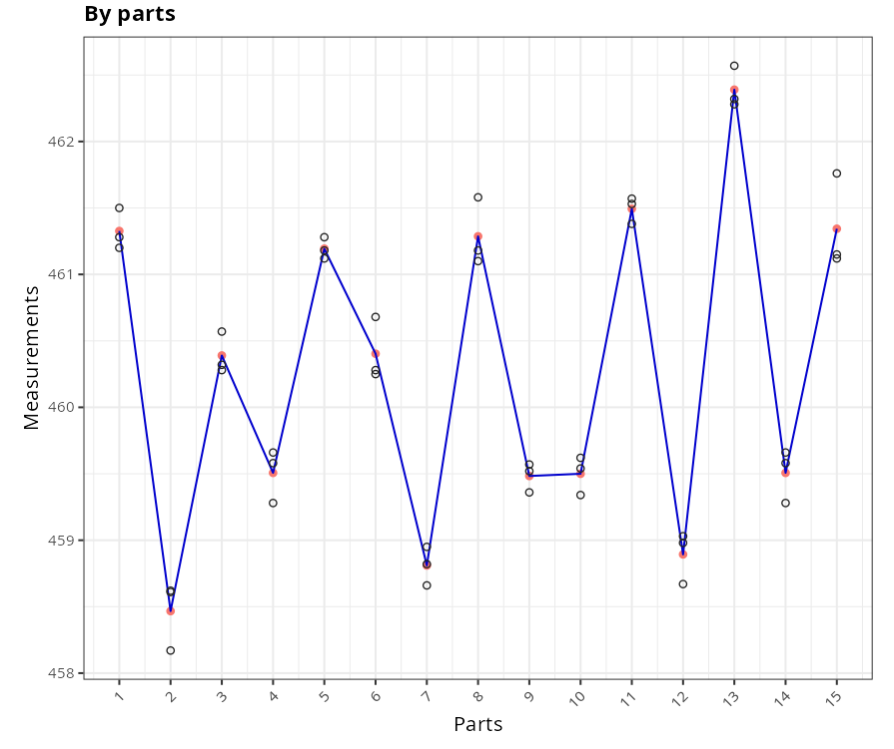
The results are:
Tabela da ANOVA
| D.F. | Sum of the squares | Mean Squares | F Statistics | P-Value | |
|---|---|---|---|---|---|
| Parts | 14 | 59.501 | 4.25001 | 109.43087 | 0 |
| Repeatability | 30 | 1.16513 | 0.03884 |
CONTRIBUTION TABLE
| Variances | Contribution (%) | |
|---|---|---|
| Repeatability | 0.039 | 2.692 |
| Parts | 1.404 | 97.308 |
| Repeatabilitty and reproducibilitty | 0.039 | 2.692 |
| Total | 1.443 | 100.000 |
TOTAL VARIANACE AND/OR TOLERANCE
| Standard Deviation | Total Variation (%) | |
|---|---|---|
| Repeatabilitty | 0.197 | 16.408 |
| Parts | 1.185 | 98.645 |
| Repeatability and reproducibility | 0.197 | 16.408 |
| Total | 1.201 | 100.000 |
| Analysis result | ||
| $\qquad \quad$ NDC: 8 |
Example 3:
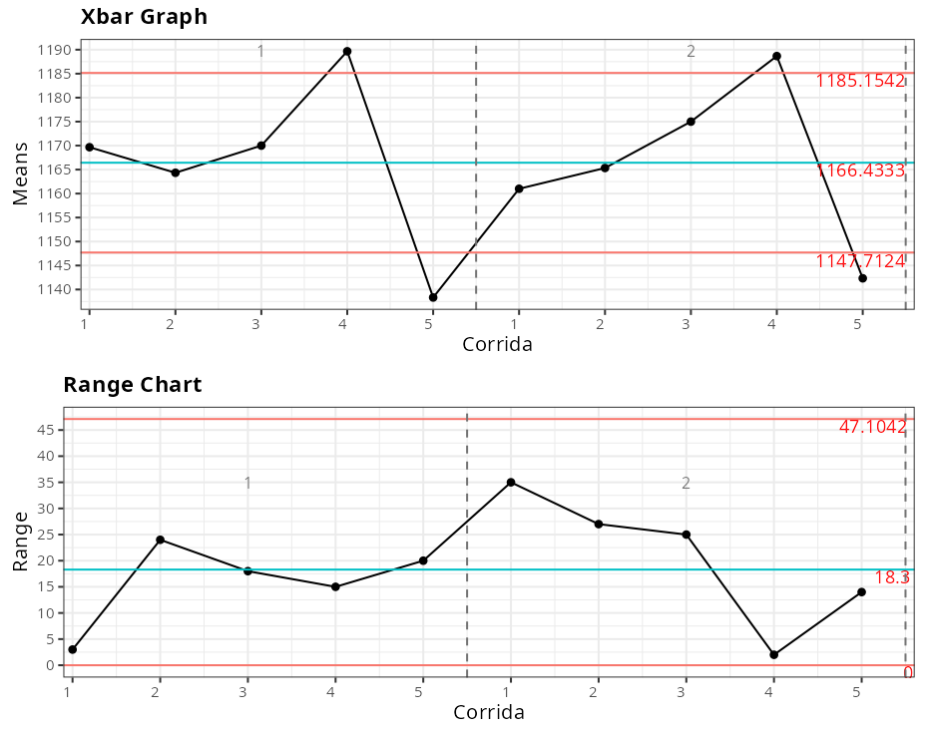
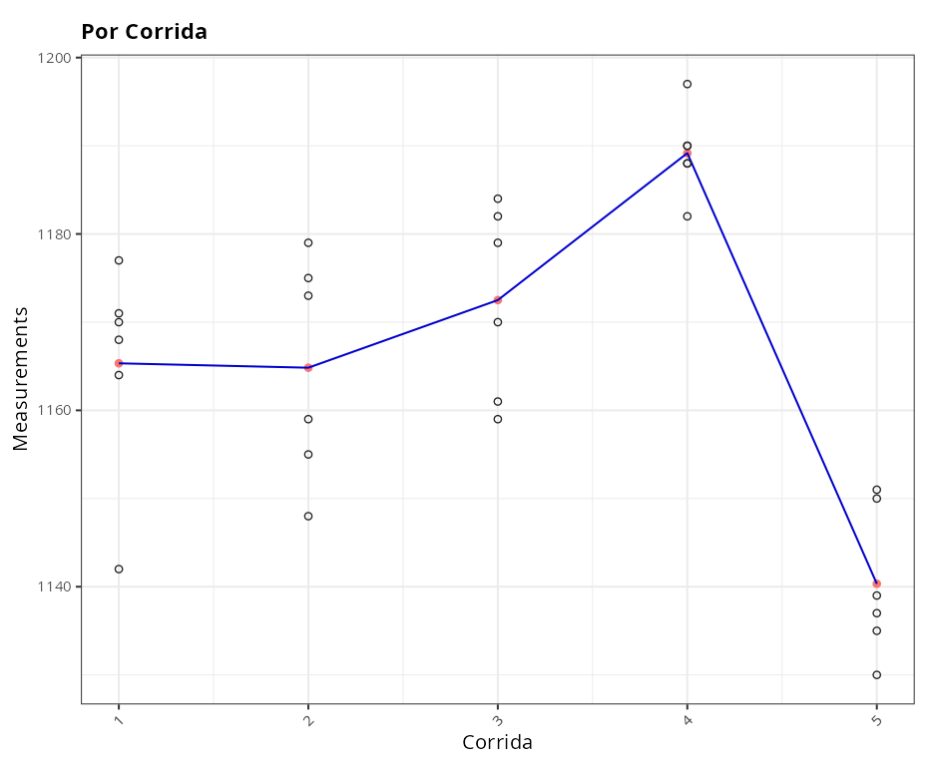
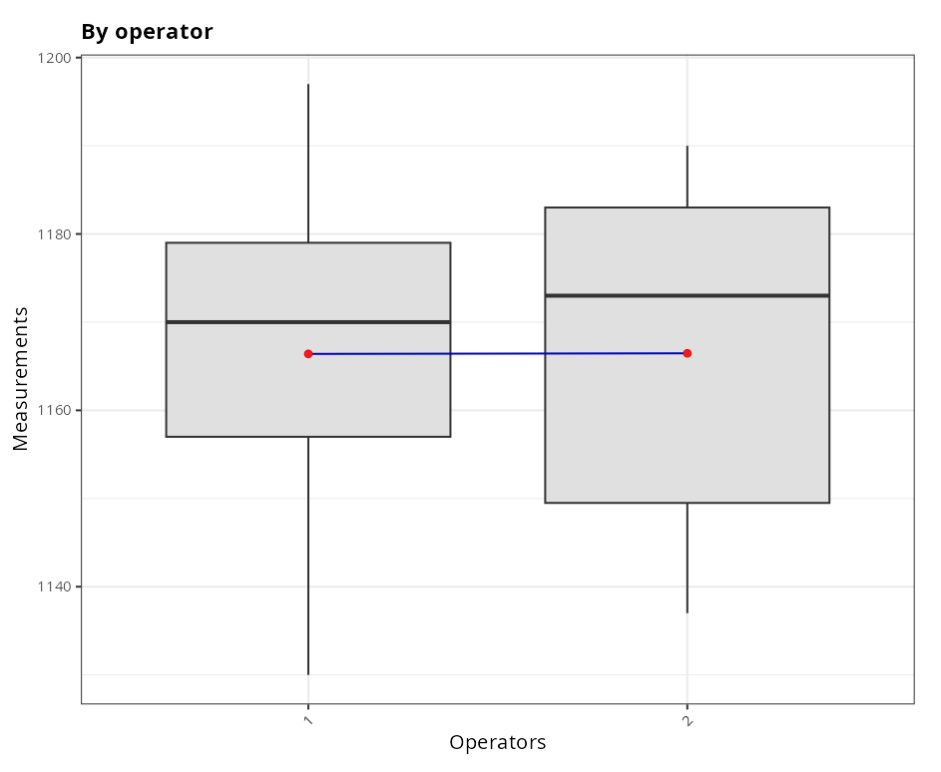
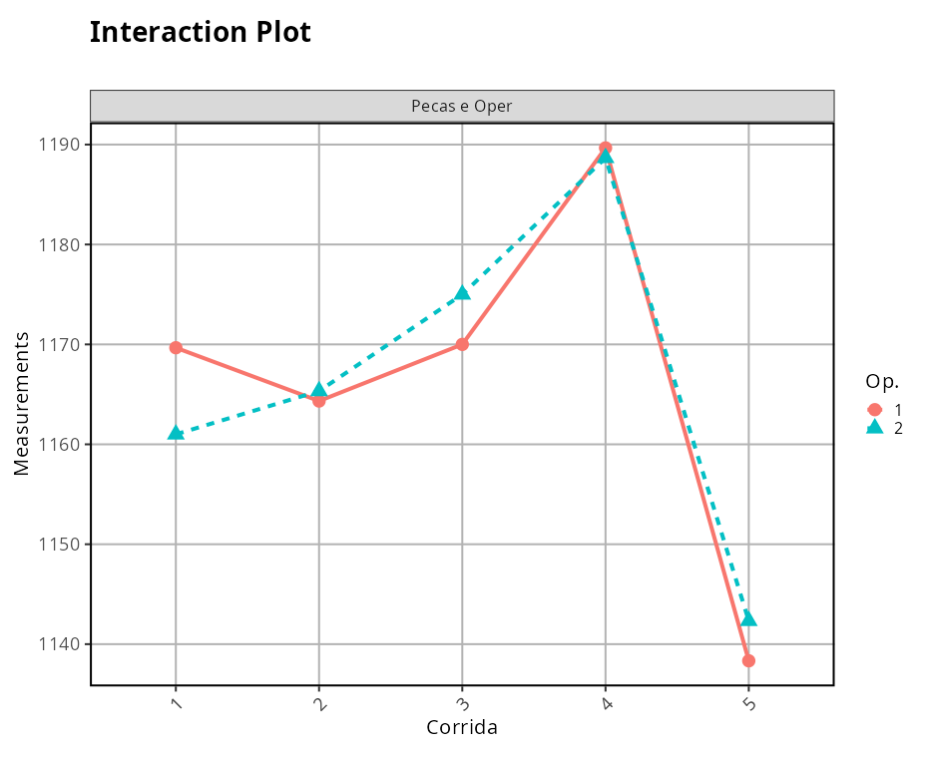
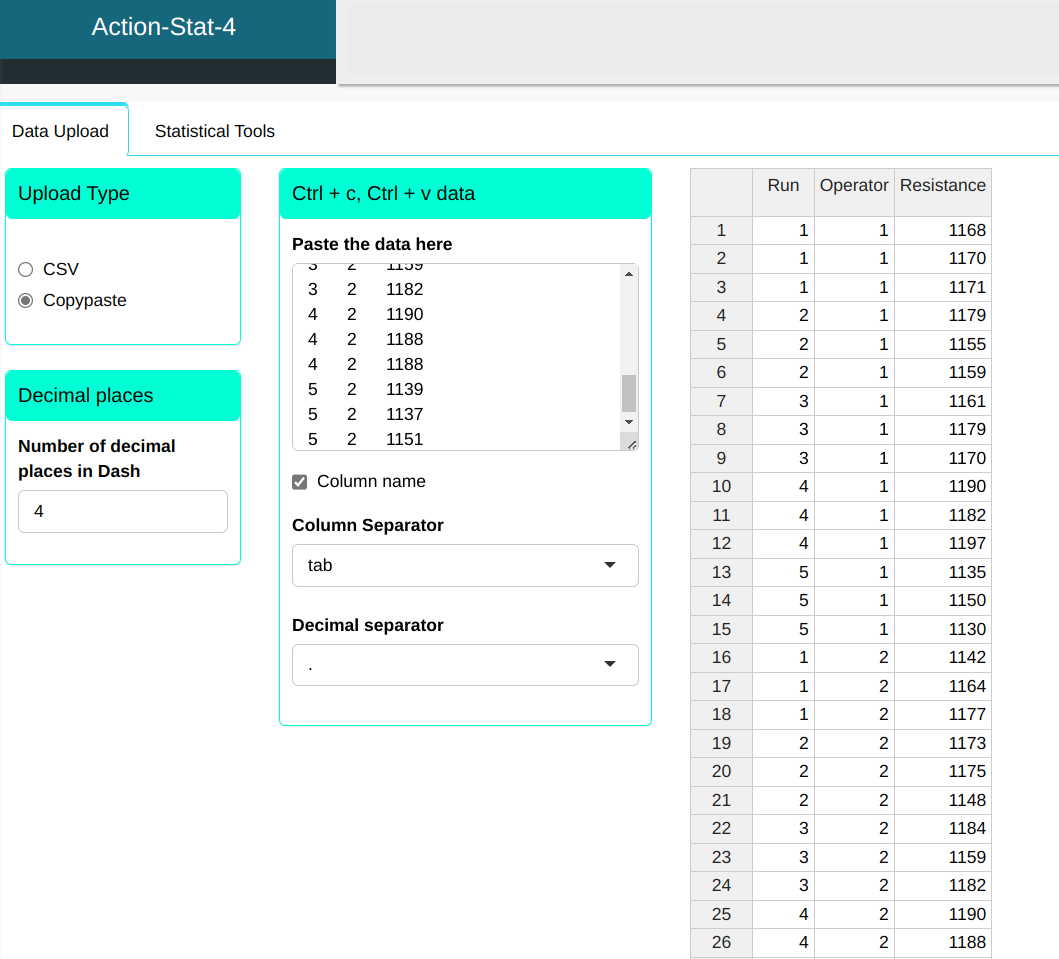
Next we consider the tensile resistance characteristic carried out on steel specimens. Five runs of steel were selected, with little variability within runs and the natural variability of the (production) process between runs. Two operators were used with 3 measurements of each run per operator
| Runs | Operator | Resistance |
|---|---|---|
| 1 | 1 | 1168 |
| 1 | 1 | 1170 |
| 1 | 1 | 1171 |
| 2 | 1 | 1179 |
| 2 | 1 | 1155 |
| 2 | 1 | 1159 |
| 3 | 1 | 1161 |
| 3 | 1 | 1179 |
| 3 | 1 | 1170 |
| 4 | 1 | 1190 |
| 4 | 1 | 1182 |
| 4 | 1 | 1197 |
| 5 | 1 | 1135 |
| 5 | 1 | 1150 |
| 5 | 1 | 1130 |
| 1 | 2 | 1142 |
| 1 | 2 | 1164 |
| 1 | 2 | 1177 |
| 2 | 2 | 1173 |
| 2 | 2 | 1175 |
| 2 | 2 | 1148 |
| 3 | 2 | 1184 |
| 3 | 2 | 1159 |
| 3 | 2 | 1182 |
| 4 | 2 | 1190 |
| 4 | 2 | 1188 |
| 4 | 2 | 1188 |
| 5 | 2 | 1139 |
| 5 | 2 | 1137 |
| 5 | 2 | 1151 |
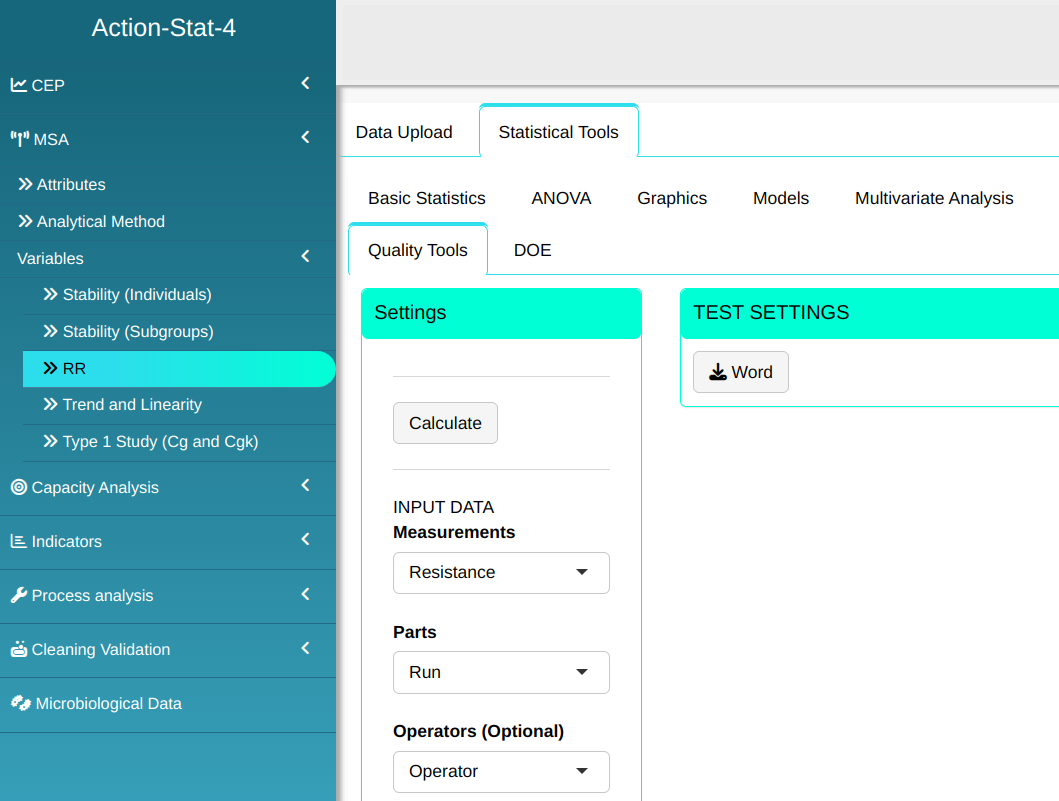
We will upload the data to the system.
Configuring as shown in the figure below to we will carry out the analysis

Then click Calculate to get the results. You can also generate the analyses and download them in Word format.
The results are
ANOVA TABLE
| D.F | Sum of squares | Mean Squares | F Statistics | P-Value | |
|---|---|---|---|---|---|
| Operators | 1 | 0.033 | 0.033 | 0.000 | 0.995 |
| Piece/Operator | 8 | 7608.667 | 951.083 | 7.897 | 0.000 |
| Repeatability | 20 | 2408.667 | 120.433 |
CONTRIBUTION TABLE
| Variance | Contribution (%) | |
|---|---|---|
| Repeatability | 120.433 | 30.312 |
| Reproducibility | 0.000 | 0.000 |
| Operators | 0.000 | 0.000 |
| Parts | 276.883 | 69.688 |
| Repeatability and Reproducibility | 120.433 | 30.312 |
| Total | 397.317 | 100.000 |
TOTAL VARIANCE AND/OR TOLERANCE
| Standard Deviation | Total Variation (%) | |
|---|---|---|
| Repeatability | 10.974 | 55.056 |
| Reproducibility | 0.000 | 0.000 |
| Operators | 0.000 | 0.000 |
| Parts | 16.640 | 83.480 |
| Repeatability and reproducibility | 10.974 | 55.056 |
| Total | 19.933 | 100.000 |
| Analysis result | ||
| $\qquad$NDC: 2 |