2. Boxplot
A boxplot is a graph that represents the distribution of a set of data based on some of its descriptive parameters: the median, the first quartile and the third quartile.
Example 1:
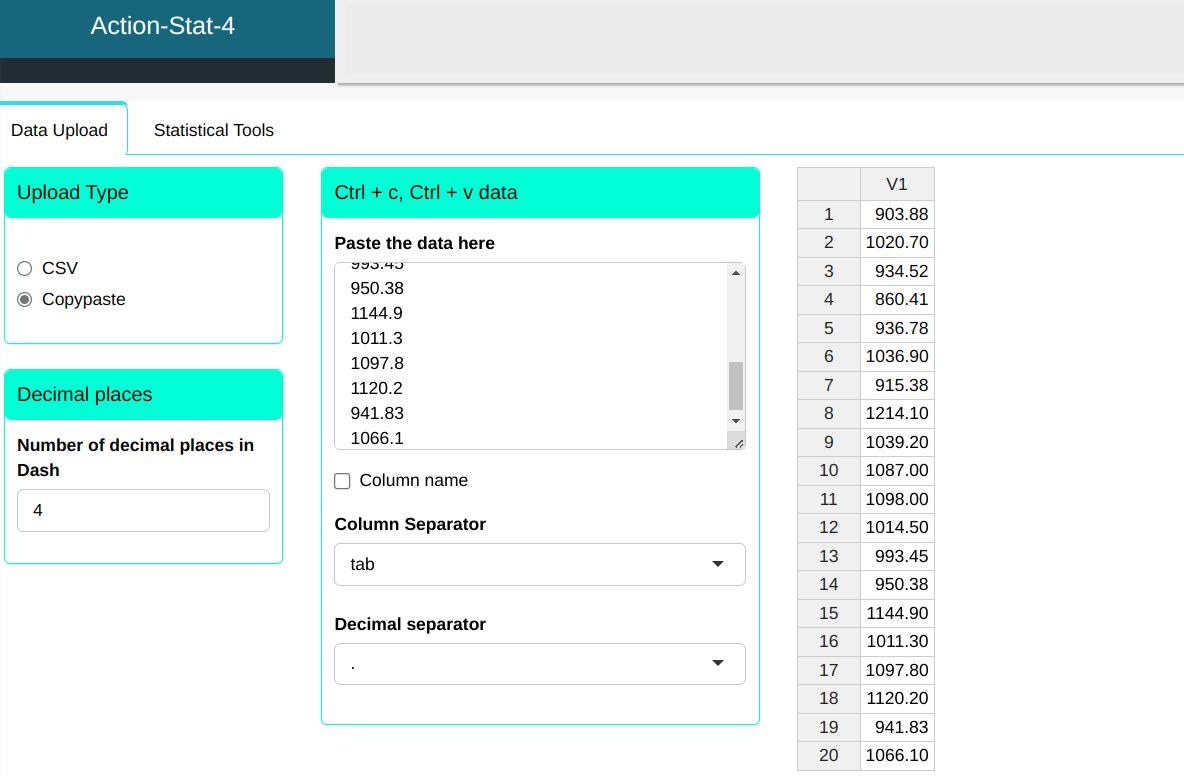
We will make a boxplot of a sample measuring 20 rods, we will do the uploading data into the system.
| 903.88 |
| 1020.70 |
| 934.52 |
| 860.41 |
| 936.78 |
| 1036.90 |
| 915.38 |
| 1214.10 |
| 1039.20 |
| 1087.00 |
| 1098.00 |
| 1014.50 |
| 993.45 |
| 950.38 |
| 1144.90 |
| 1011.30 |
| 1097.80 |
| 1120.20 |
| 941.83 |
| 1056.10 |
We will do the Boxplot.
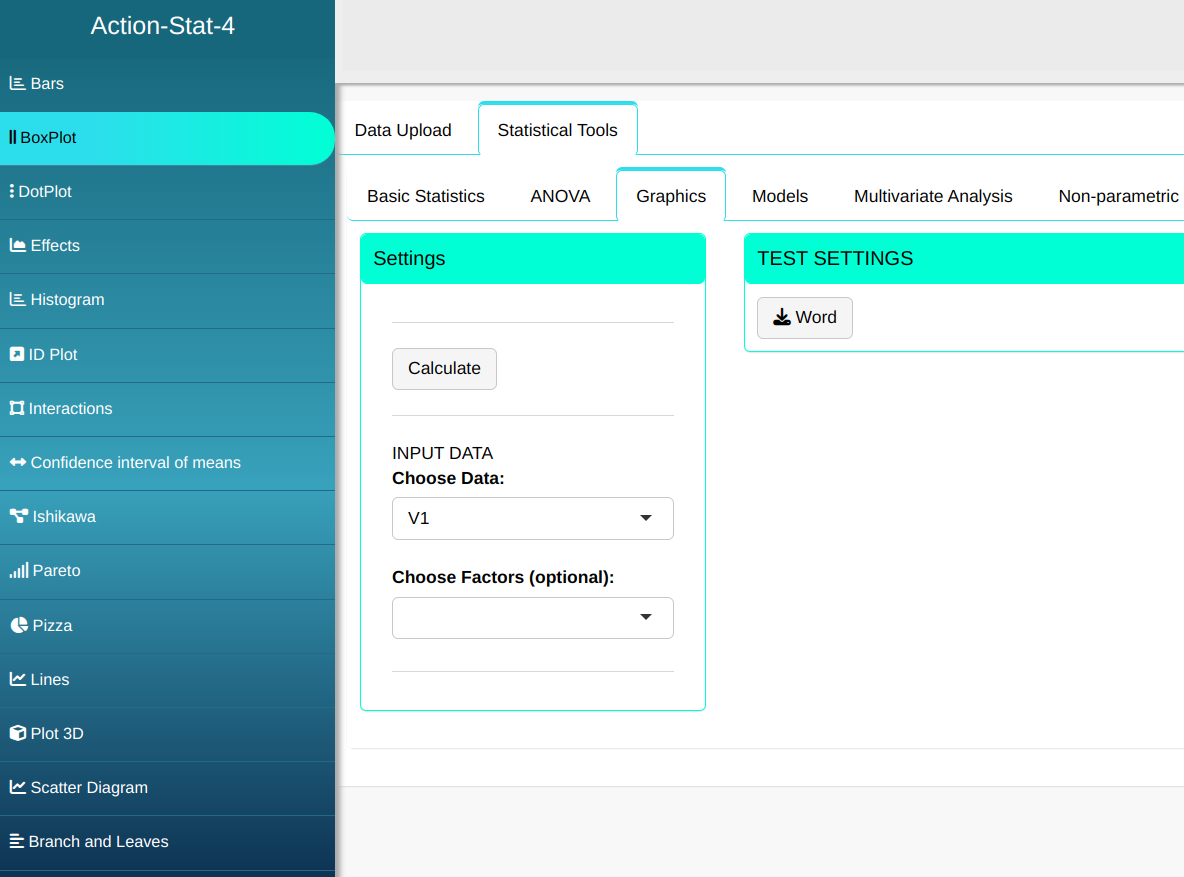
Then click Calculate to get the results. You can also generate the analyses and download them in Word format.

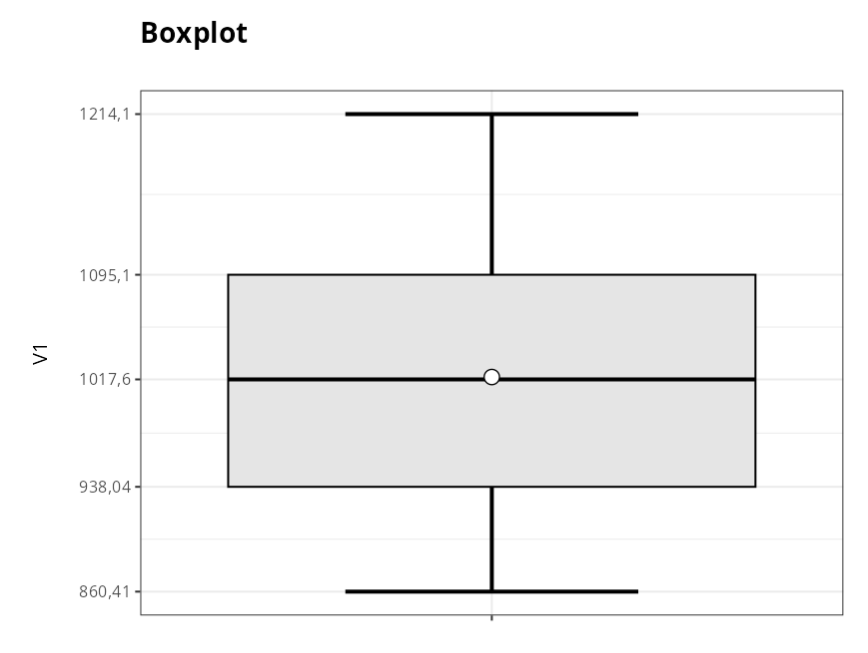
The results are:
Descriptive Summary
| Values | |
|---|---|
| Minimum | 860.410 |
| Lower limit | 860.410 |
| First Quartile | 938.043 |
| Mean | 1018.8665 |
| Median | 1017.600 |
| Third Quartile | 1095.100 |
| Upper limit | 1214.100 |
| Maximum | 1214.100 |
Example 2:
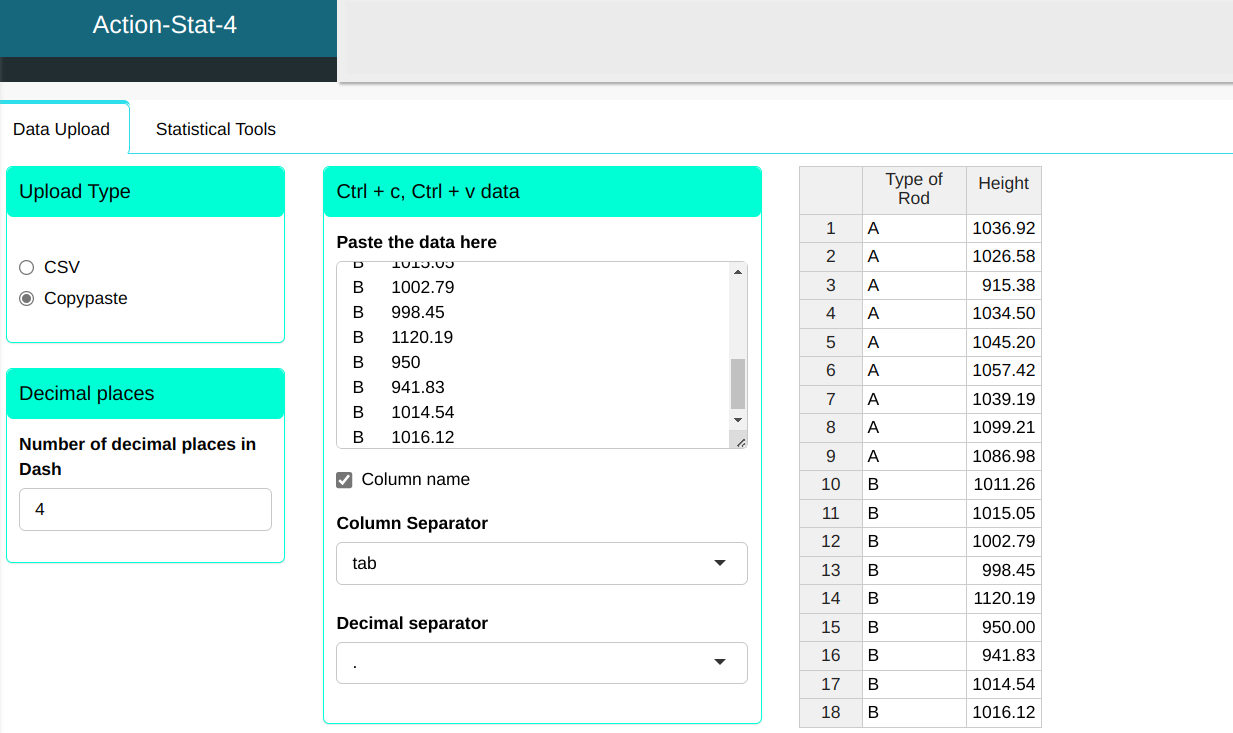
Let’s consider two types of rods, A and B, Make a Boxplot and compare the two types of rods.
| Rod Type | Height |
|---|---|
| A | 1036.92 |
| A | 1026.58 |
| A | 915.38 |
| A | 1034.5 |
| A | 1045.2 |
| A | 1057.42 |
| A | 1039.19 |
| A | 1099.21 |
| A | 1086.98 |
| B | 1011.26 |
| B | 1015.05 |
| B | 1002.79 |
| B | 998.45 |
| B | 1120.19 |
| B | 950 |
| B | 941.83 |
| B | 1014.54 |
| B | 1016.12 |
We will upload the data to the system.
We will then do the Boxplot

Then click Calculate to get the results. You can also generate the analyses and download them in Word format.
The results are:
Descriptive Summary
| A | B | |
|---|---|---|
| Minimum | 915.380 | 941.830 |
| Lower limit | 968.050 | 941.830 |
| First Quartile | 1030.540 | 974.225 |
| Mean | 1037.931 | 1007.803 |
| Median | 1039.190 | 1011.260 |
| Third Quartile | 1072.200 | 1015.585 |
| Upper limit | 1099.210 | 1077.625 |
| Maximum | 1099.210 | 1120.190 |
Outliers
| The Order of Collection | Outliers | Groups |
|---|---|---|
| 3 | 915.38 | A |
| 14 | 1120.19 | B |
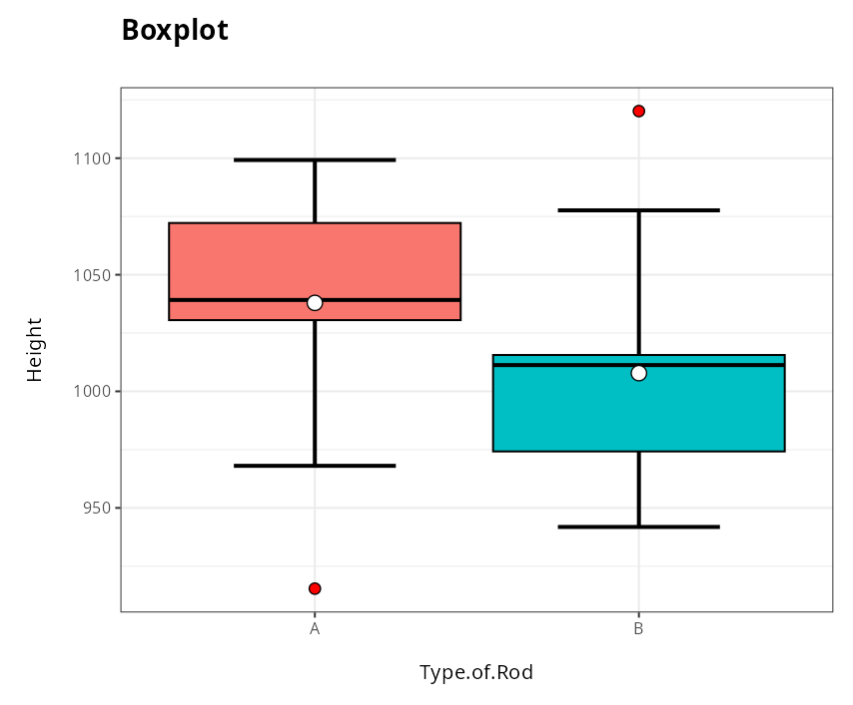
When comparing the Boxplots of the two types of rods, we see that they are behave differently in relation to their heights. Despite a of type A rods have a height value well below the heights of type B rods, the rods of this first type have heights well higher than those of the second type.