4. Main Effects Charts
Main effects are defined as “the change in response when going from low level to high level”.
Example:
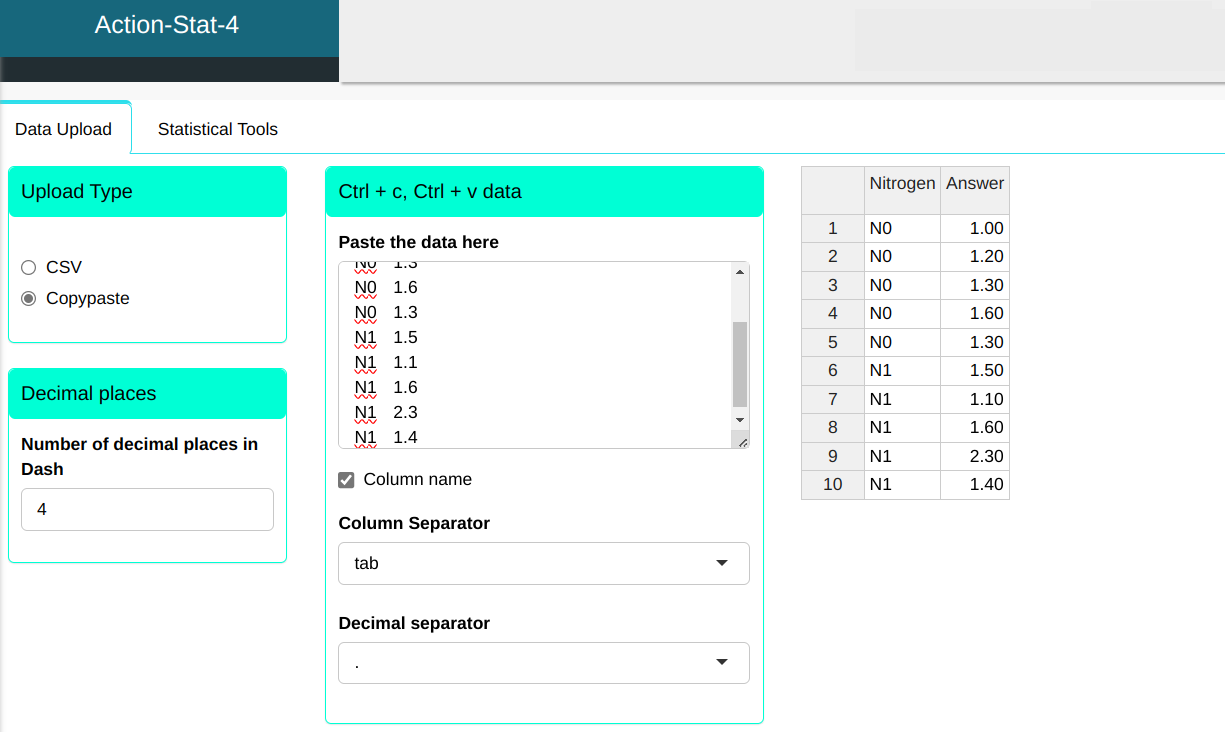
An agronomist is interested in investigating the effect of nitrogenated fertilization at two levels (N0 and N1) in a given cultivating. we will do the upload data to the system.
| Nitrogen | Answer |
|---|---|
| N0 | 1.0 |
| N0 | 1.2 |
| N0 | 1.3 |
| N0 | 1.6 |
| N0 | 1.3 |
| N1 | 1.5 |
| N1 | 1.1 |
| N1 | 1.6 |
| N1 | 2.3 |
| N1 | 1.4 |
Configuring according to the figure below we will graph the main effects.
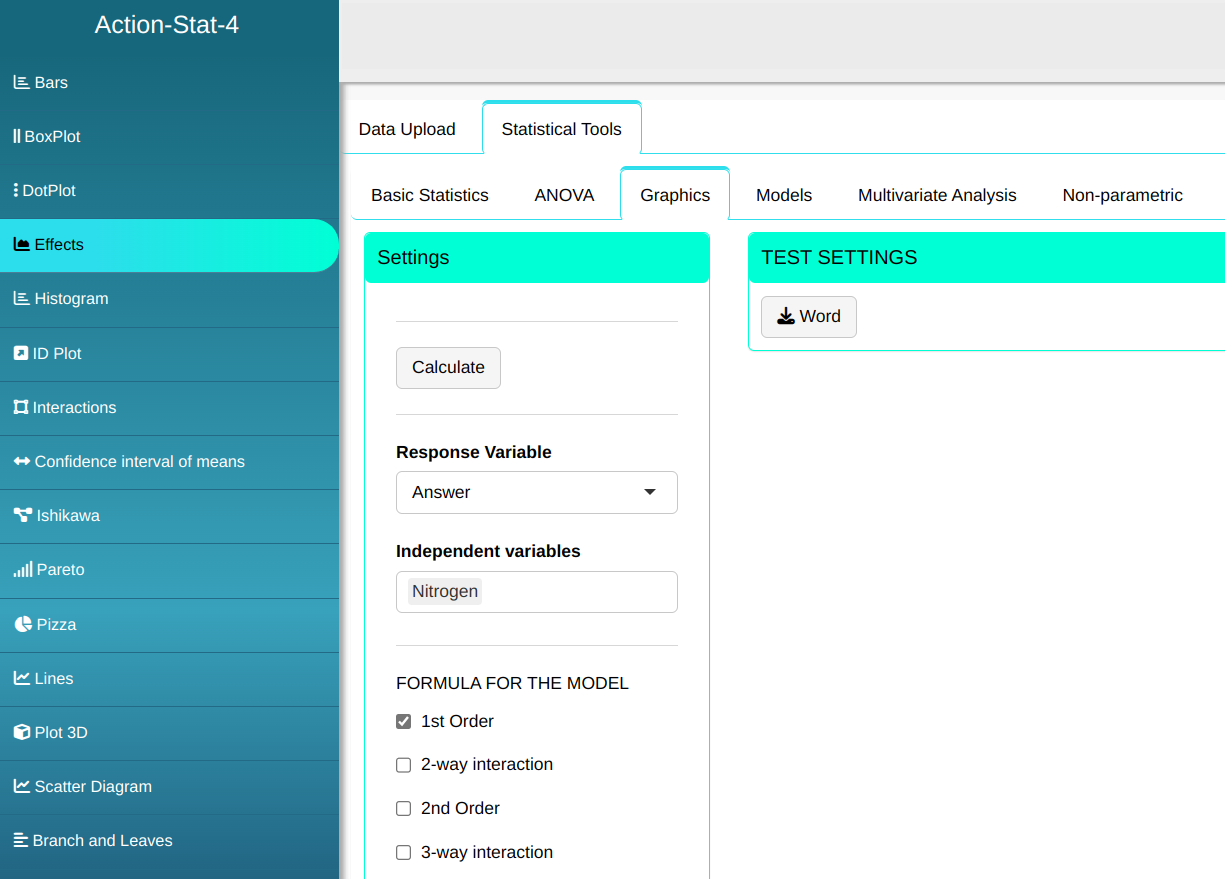

Then click Calculate view the results. You can also download them in a Word document.

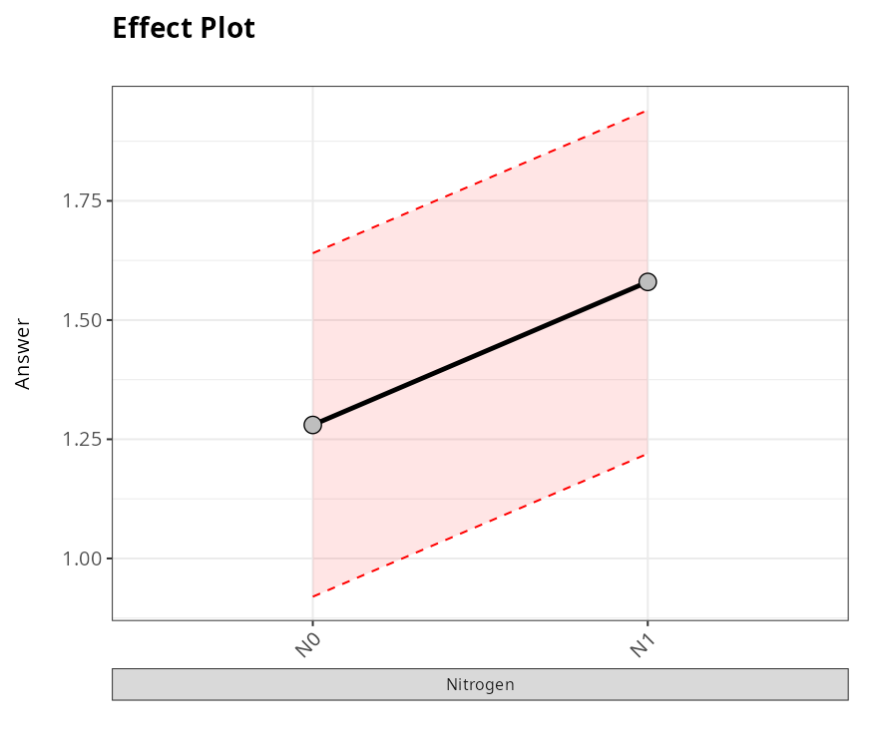
The results are:
Confidence interval of the Effect Nitrogen
| Level | Lower limit | Mean Effect | Upper limit |
|---|---|---|---|
| N0 | 0.92 | 1.28 | 1.64 |
| N1 | 1.22 | 1.58 | 1.94 |