7. Interaction Graph
The interaction graph is used when we have at least two factors. He has function to visually identify whether the factors have an effect together or whether they are independent.
Example:
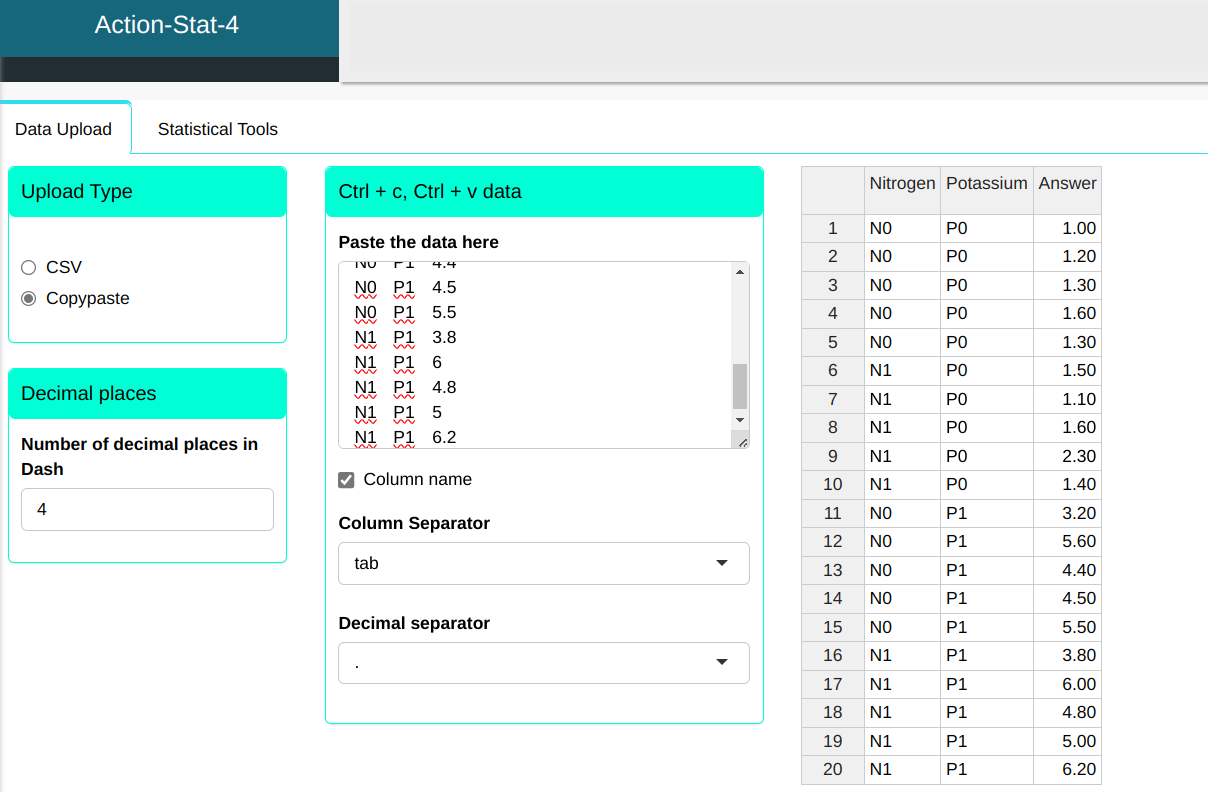
An agronomist is interested in investigating the effect of fertilization nitrogenated at two levels (N0 and N1) and phosphated at two levels (P0 and P1) in a given cultivating. We will upload the data to system.
| Nitrogen | Potassium | Answer |
|---|---|---|
| N0 | P0 | 1.0 |
| N0 | P0 | 1.2 |
| N0 | P0 | 1.3 |
| N0 | P0 | 1.6 |
| N0 | P0 | 1.3 |
| N1 | P0 | 1.5 |
| N1 | P0 | 1.1 |
| N1 | P0 | 1.6 |
| N1 | P0 | 2.3 |
| N1 | P0 | 1.4 |
| N0 | P1 | 3.2 |
| N0 | P1 | 5.6 |
| N0 | P1 | 4.4 |
| N0 | P1 | 4.5 |
| N0 | P1 | 5.5 |
| N1 | P1 | 3.8 |
| N1 | P1 | 6.0 |
| N1 | P1 | 4.8 |
| N1 | P1 | 5.0 |
| N1 | P1 | 6.2 |
We will make the interactions graph.
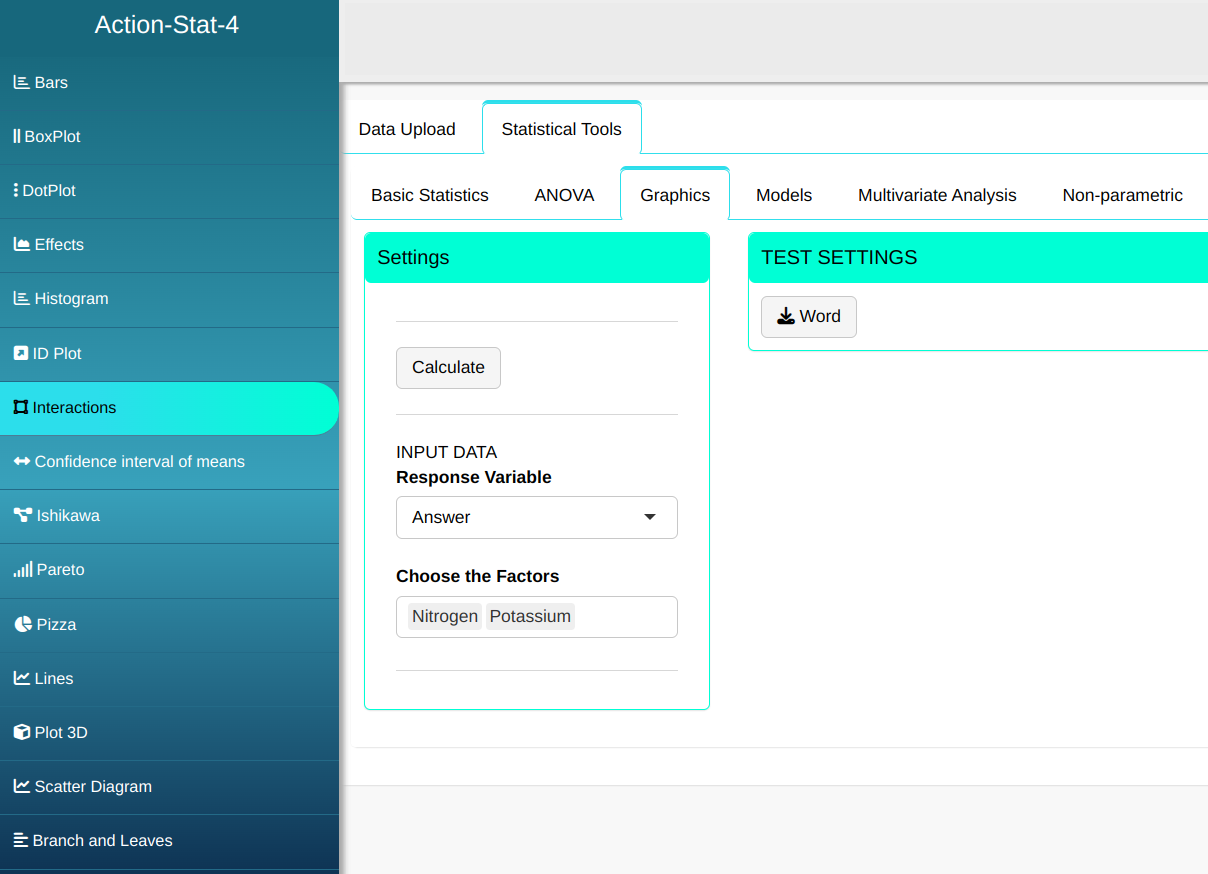
Then click Calculate to get the results. You can also generate the analyses and download them in Word format.
The results are:
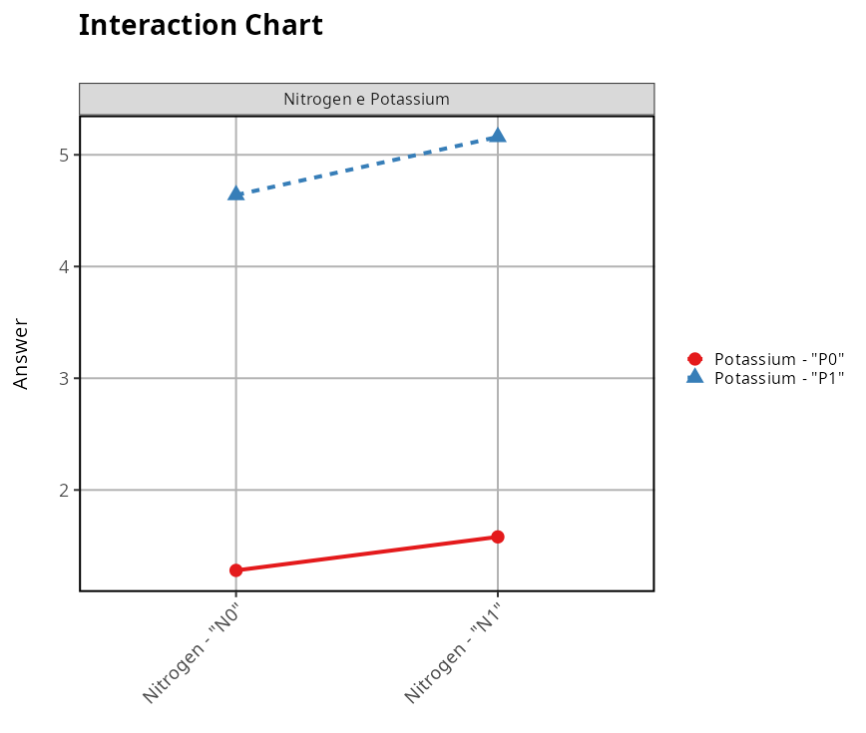
Here we see that there is no interaction between the two factors and their respective levels, that is, there is independence between them. Thus, regardless of the nitrogen level to be used, N0 or N1, the potassium level P1 will always provide better results.