9. Ishikawa graph
The Ishikawa diagram, also known as cause and effect, is a way of organizing and representing the different theories proposed about the causes of a problem.
Example:
As is the case in most companies, weaknesses end up generating numerous difficulties and operational problems, with major and inevitable negative repercussions on the organizational environment. We will use two of these difficulties to create the graph.
| Causative factors | work environment |
|---|---|
| No Professional Recognition | Relationship with the Team |
| nonexistence of a fair salary | Relationship with your Superiors |
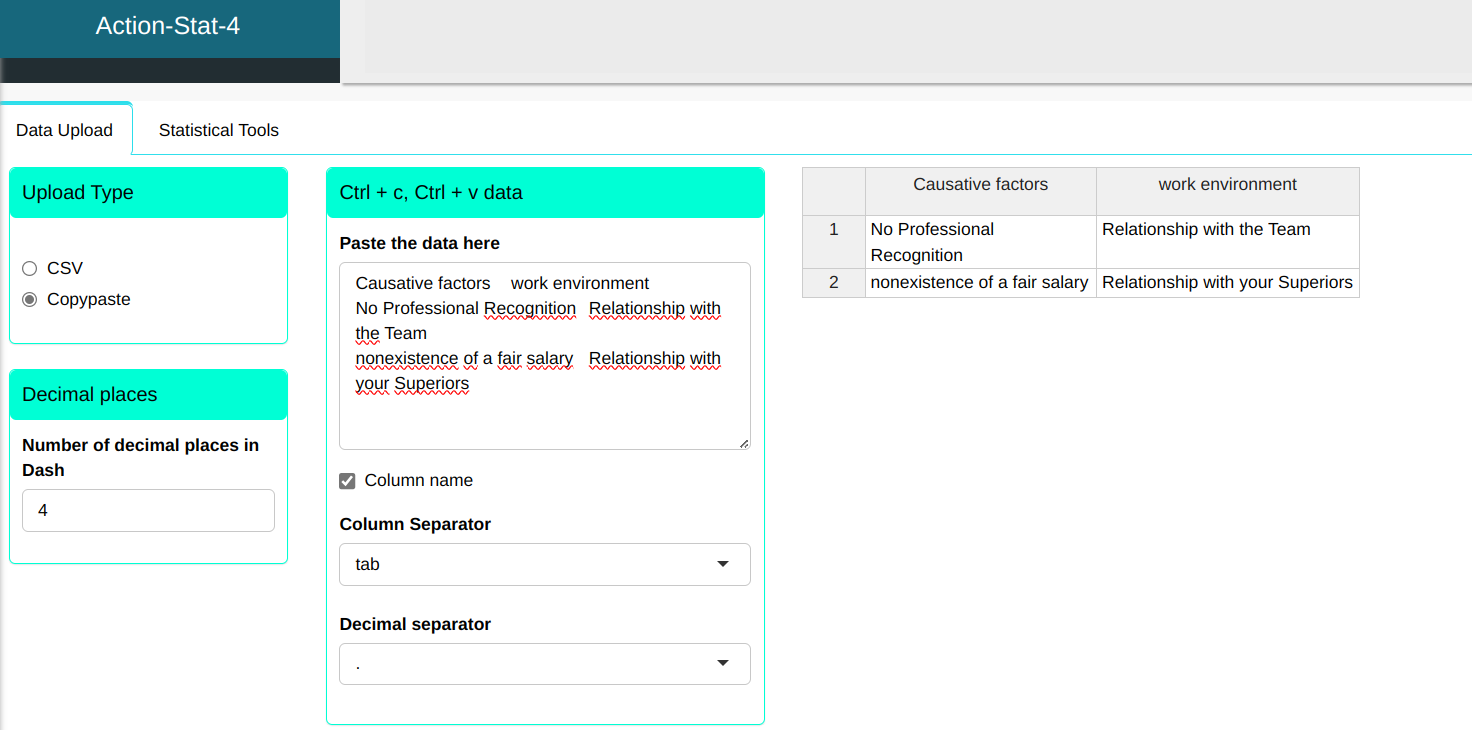
We will make the Ishkawa graph.
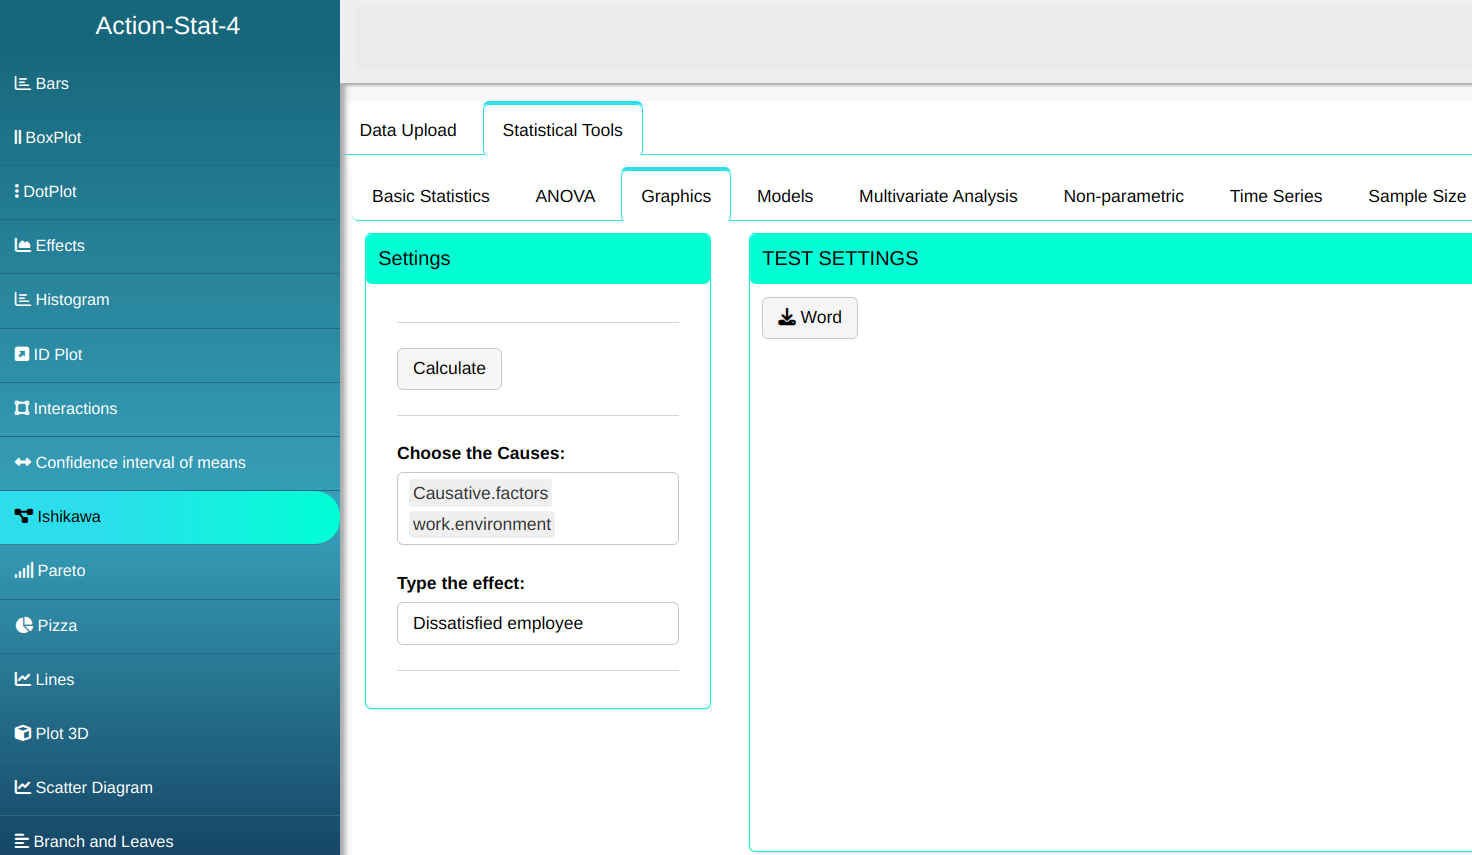
Then click Calculate to get the results. You can also generate the analyses and download them in Word format.

The results are:
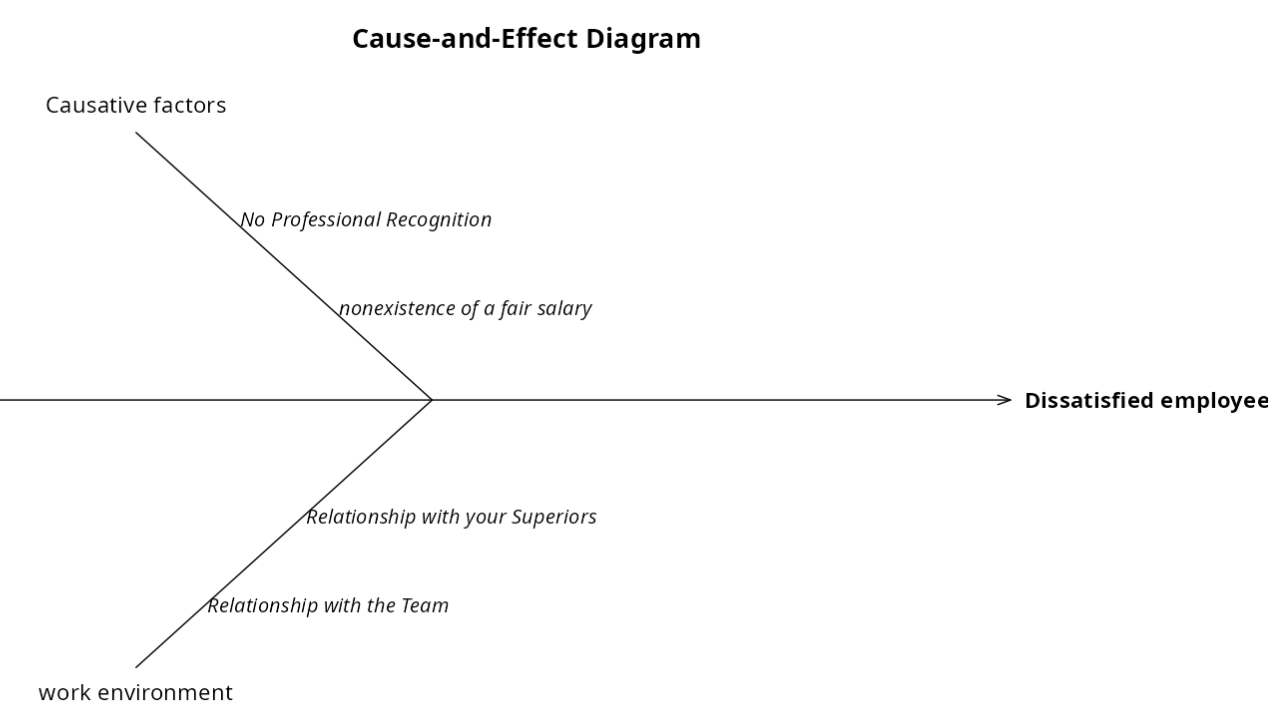
As we see above, the levels within the two main causes: no professional recognition, lack of a fair salary policy, relationship with their superiors, and interaction with the team, are causing them employee dissatisfaction.