12. Line chart
Line or dot graphs are typically used to monitor changes over time and to facilitate the identification of trends or anomalies.
Example:
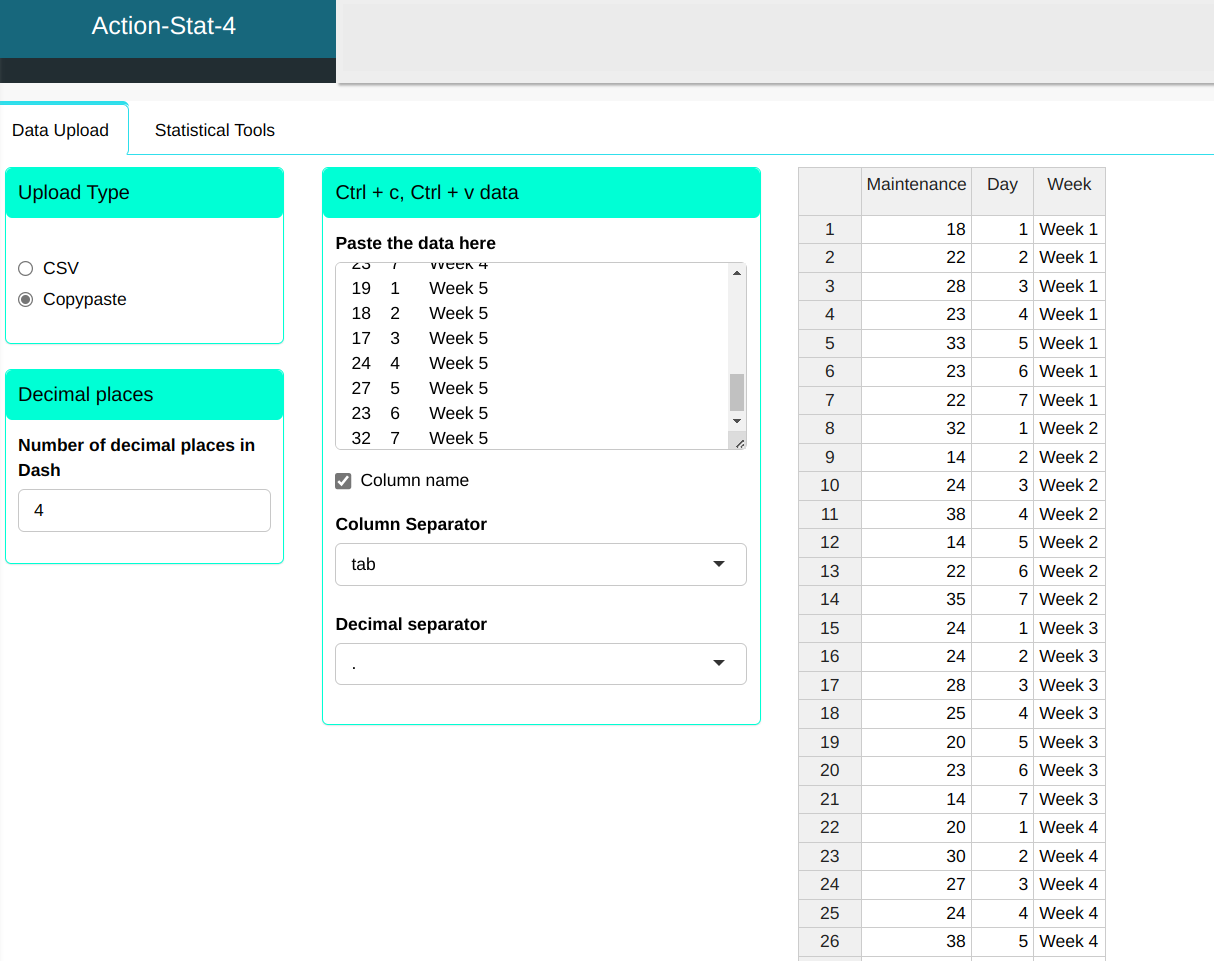
In a car company, the number of maintenance operations per day. The equipment was monitored over a period of 5 weeks. at the table Below we have the number of maintenances per day.
| Maintenance | Day | Week |
|---|---|---|
| 18 | 1 | Week 1 |
| 22 | 2 | Week 1 |
| 28 | 3 | Week 1 |
| 23 | 4 | Week 1 |
| 33 | 5 | Week 1 |
| 23 | 6 | Week 1 |
| 22 | 7 | Week 1 |
| 32 | 1 | Week 2 |
| 14 | 2 | Week 2 |
| 24 | 3 | Week 2 |
| 38 | 4 | Week 2 |
| 14 | 5 | Week 2 |
| 22 | 6 | Week 2 |
| 35 | 7 | Week 2 |
| 24 | 1 | Week 3 |
| 24 | 2 | Week 3 |
| 28 | 3 | Week 3 |
| 25 | 4 | Week 3 |
| 20 | 5 | Week 3 |
| 23 | 6 | Week 3 |
| 14 | 7 | Week 3 |
| 20 | 1 | Week 4 |
| 30 | 2 | Week 4 |
| 27 | 3 | Week 4 |
| 24 | 4 | Week 4 |
| 38 | 5 | Week 4 |
| 27 | 6 | Week 4 |
| 23 | 7 | Week 4 |
| 19 | 1 | Week 5 |
| 18 | 2 | Week 5 |
| 17 | 3 | Week 5 |
| 24 | 4 | Week 5 |
| 27 | 5 | Week 5 |
| 23 | 6 | Week 5 |
| 32 | 7 | Week 5 |
We will upload the data to the system.
We will make the linear graph.
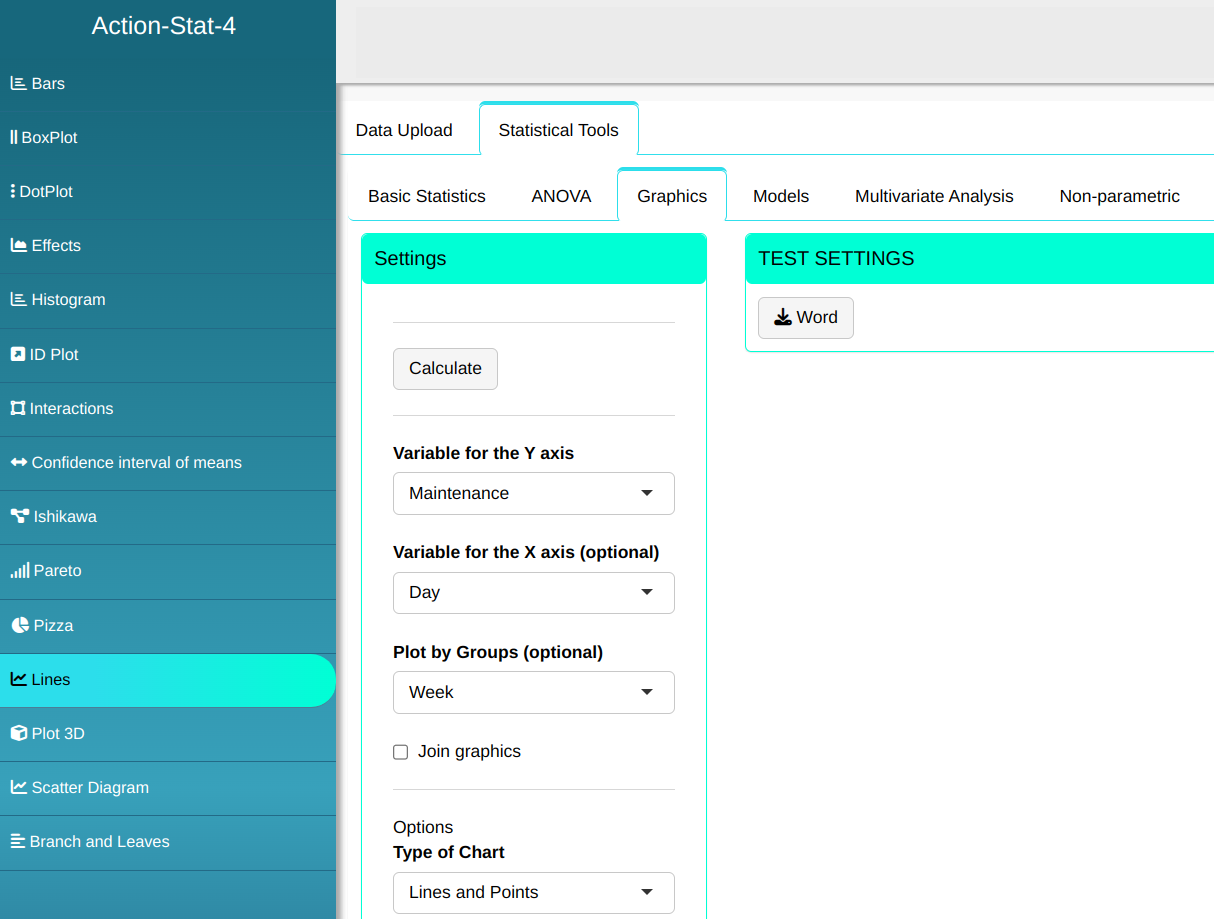
Then click Calculate to get the results. You can also generate the analyses and download them in Word format.
The results are:
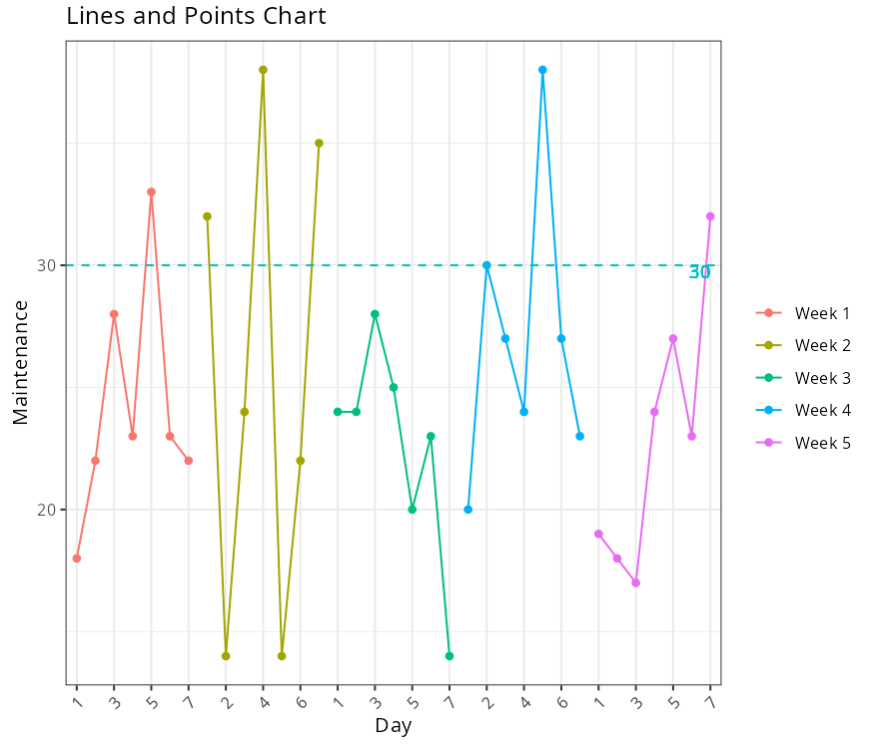
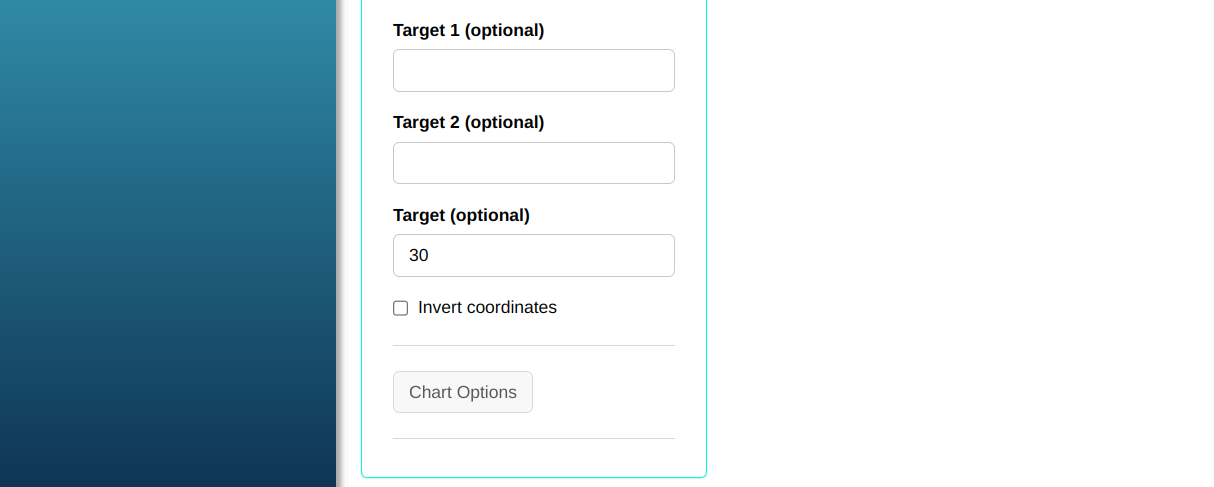
The maintenance number seems to follow, as the days go by, a random behavior. It presents high peaks on days 11 and 26 and peaks minimums on days 9, 12 and 21. In addition, only 6 days presented a number of maintenances greater than 30, which is the established target line.