13. 3D Plot
The 3D graph allows you to visually report the trends of a series of values in relation to a certain period of time.
Example:
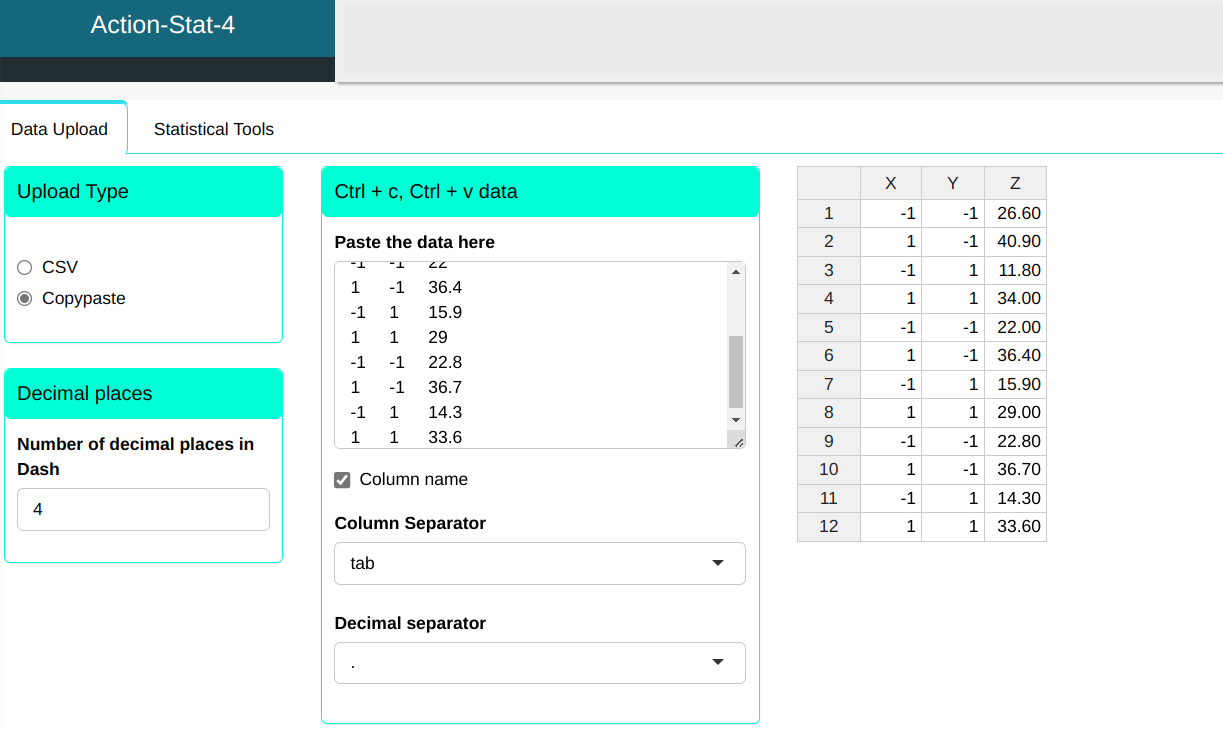
We will upload the data to the system.
| X | Y | Z |
|---|---|---|
| -1 | -1 | 26.60 |
| 1 | -1 | 40.90 |
| -1 | 1 | 11.80 |
| 1 | 1 | 34.00 |
| -1 | -1 | 22.00 |
| 1 | -1 | 36.40 |
| -1 | 1 | 15.90 |
| 1 | 1 | 29.00 |
| -1 | -1 | 22.80 |
| 1 | -1 | 36.70 |
| -1 | 1 | 14.30 |
| 1 | 1 | 33.60 |
The 3D plot is prepared according to the configuration shown in the figure below.
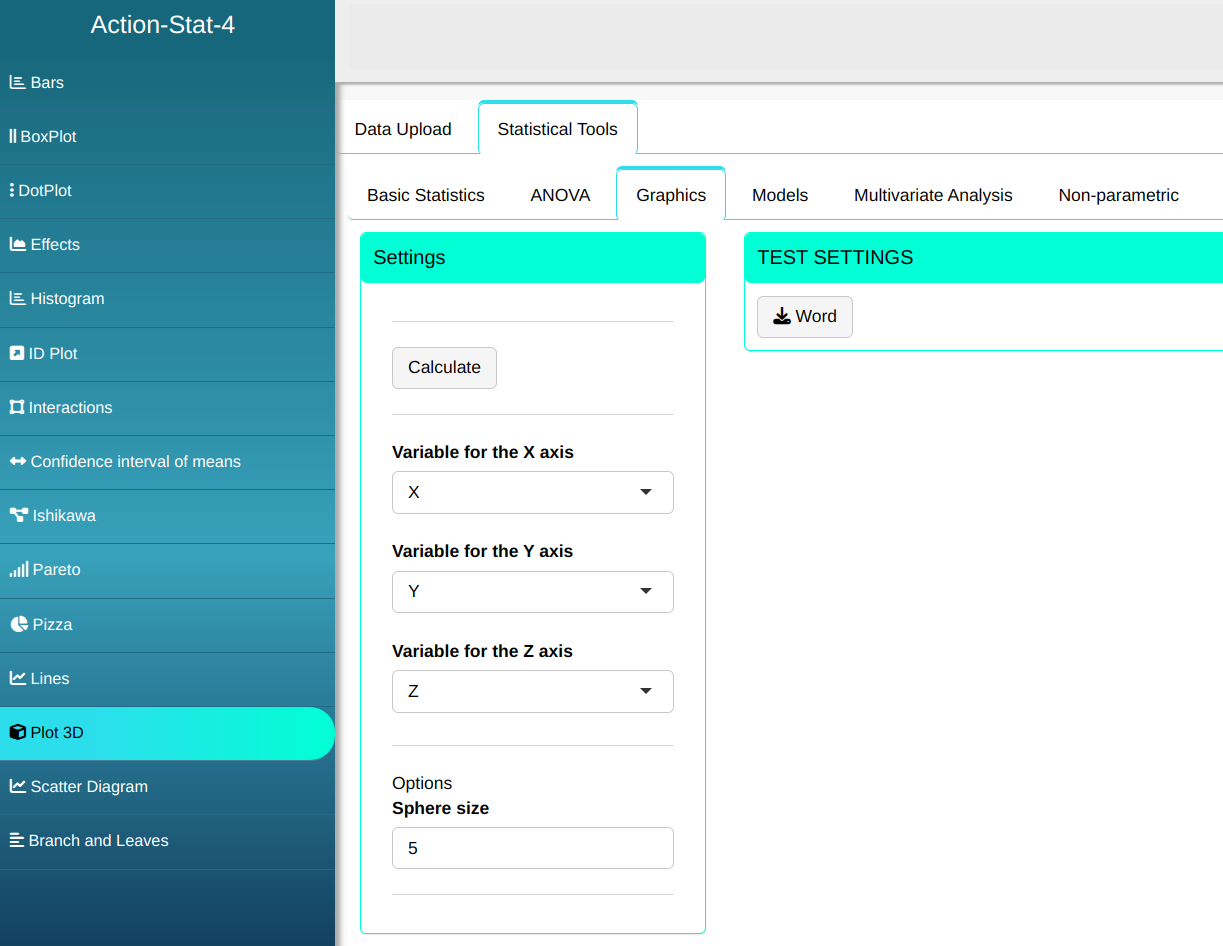
Then click Calculate to get the results. You can also generate the analyses and download them in Word format.
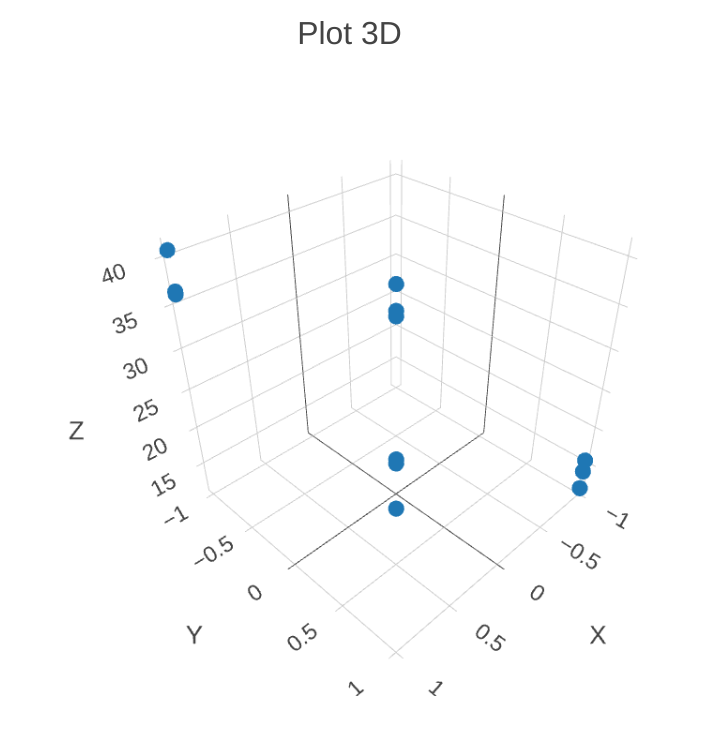
The results are: