15. Branches and leaves
The stem and leaf chart is a type of chart in which the data in its explicitly. The objective is to separate the data so that, before The bar is still a certain unit of measurement for the data, for example the tens, and after the slash is the missing unit of measurement, in the For example, ones and tens.
Example:
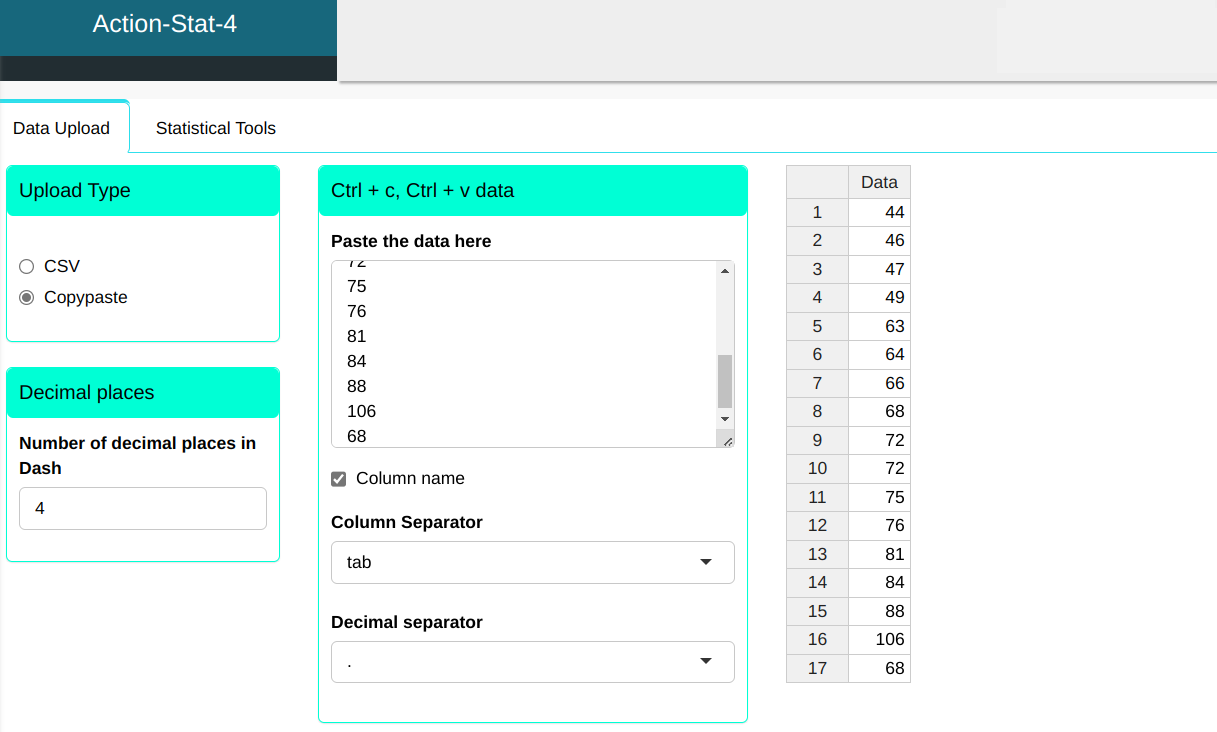
We will upload the data to the system.
| Data |
|---|
| 44 |
| 46 |
| 47 |
| 49 |
| 63 |
| 64 |
| 66 |
| 68 |
| 72 |
| 72 |
| 75 |
| 76 |
| 81 |
| 84 |
| 88 |
| 106 |
| 68 |
We will make the stem and leaf diagram.
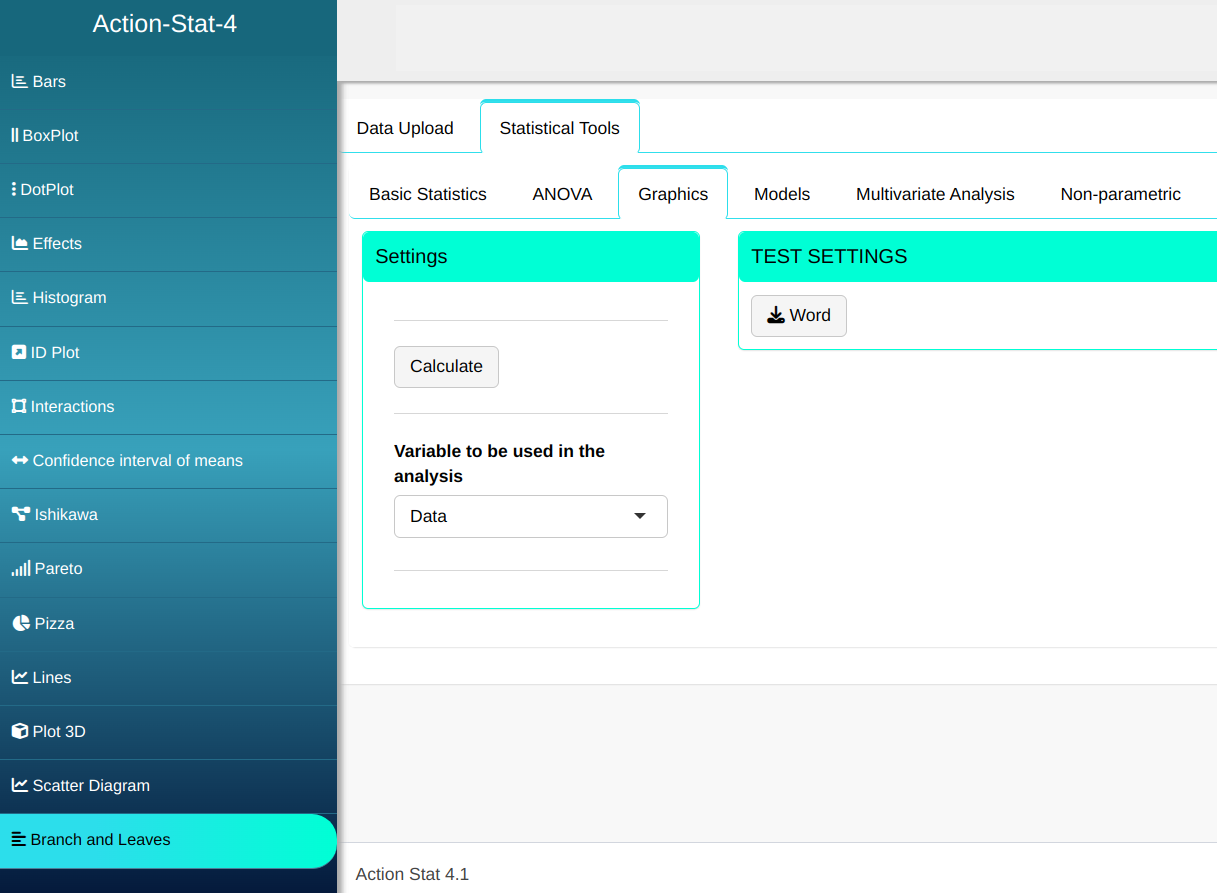
Then click Calculate to get the results. You can also generate the analyses and download them in Word format.
The results are:
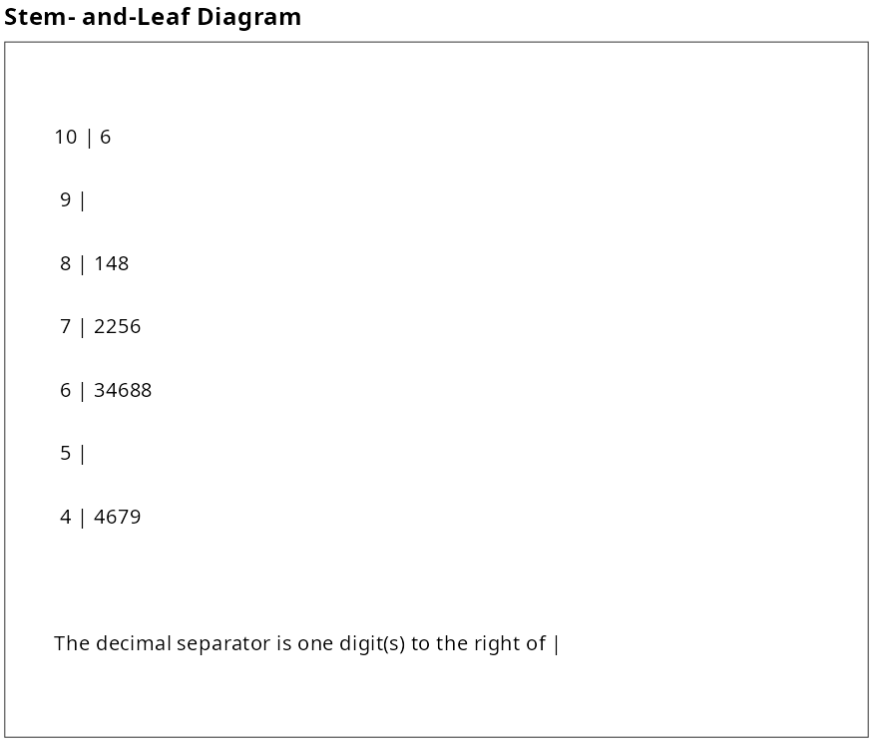
The first line of the graph means that we have an observation 106, the 9 no number after the forward slash means that in the data set, We do not have any number between 90 and 99.