2. Friedman Test
The Friedman test is a non-parametric test used as an alternative to the randomized block design test in regular ANOVA when the normality assumption cannot be guaranteed or when the variations between the factors are different.
Example:
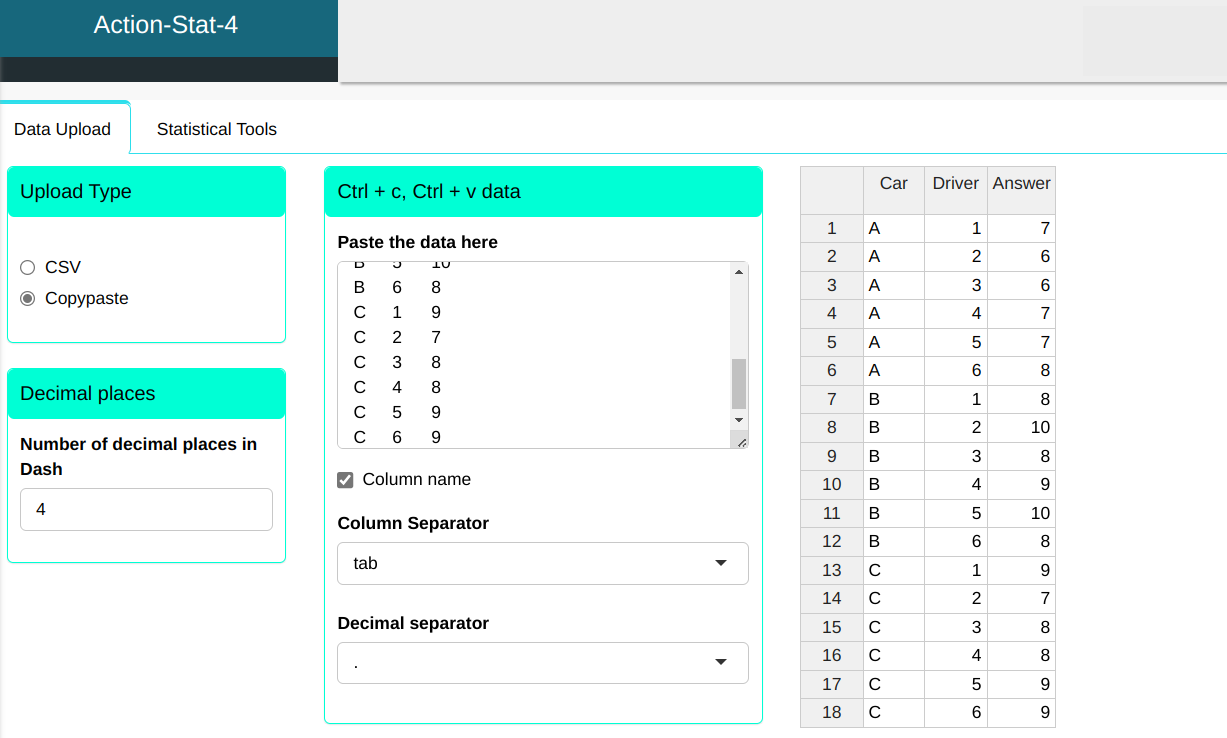
In a vehicle performance evaluation study, six drivers analyzed three cars (A, B, and C) in a randomized experiment. The objective of the research was to evaluate vehicle performance, assuming that brand does not influence ratings. The table shows the ratings given to each car by each driver, using a scale of 1 to 10.
| Car | Driver | Answer |
|---|---|---|
| A | 1 | 7 |
| A | 2 | 6 |
| A | 3 | 6 |
| A | 4 | 7 |
| A | 5 | 7 |
| A | 6 | 8 |
| B | 1 | 8 |
| B | 2 | 10 |
| B | 3 | 8 |
| B | 4 | 9 |
| B | 5 | 10 |
| B | 6 | 8 |
| C | 1 | 9 |
| C | 2 | 7 |
| C | 3 | 8 |
| C | 4 | 8 |
| C | 5 | 9 |
| C | 6 | 9 |
Configuring as shown in the figure below to perform the Friedman test,
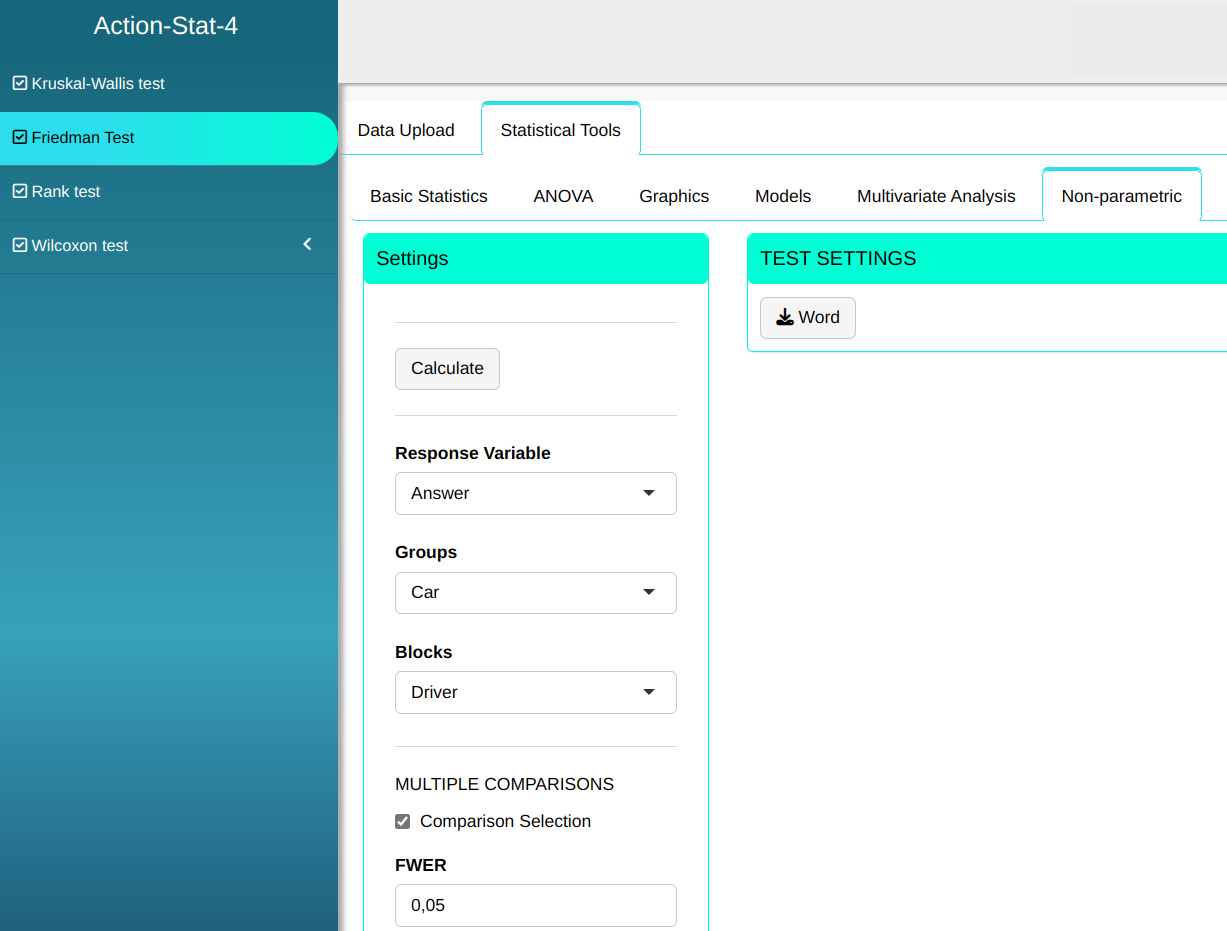

Then click Calculate to get the results. You can also generate the analyses and download them in Word format.

The results are:
Friedman test
| Value | |
|---|---|
| Friedman chi-square | 8.273 |
| Degrees of Freedom | 2.000 |
| P-value | 0.016 |
Multiple Comparisons Table - FWER (Simes-Hochberg)
| Observed Difference | Critical Difference | Statistics | P-value | Adjusted P-value | |
|---|---|---|---|---|---|
| A - B | 8.5 | 8.293 | 2.454 | 0.014 | 0.042 |
| A - C | 8.0 | 8.293 | 2.309 | 0.021 | 0.042 |
| B - C | 0.5 | 8.293 | 0.144 | 0.885 | 0.885 |
Cluster Table
| Sum (Rank) | Groups | |
|---|---|---|
| B | 15.5 | a |
| c | 14.5 | a |
| A | 6.5 | b |
The test statistic is 8.273. As the P-value = 0.01598 < 5% then, at the significance level of 5% there is evidence that the factors do not they are all the same.
In the Multiple Comparison Table, we can see that there are significant differences between factors A and B and between factors A and C.
Observing the ranks in the Grouping Table, we have the answers to factors B and C are greater than the responses to factor A.