2. Trend Analysis
Trend is a behavior commonly found in series temporal. A time series is said to show a trend when the It has a certain inclination or natural disposition.
In the Trend Analysis tool, you can perform non-standard tests parametric tests to check whether the series shows a trend. Another option of this tool, is to adjust parametric models for the trend.
Example:
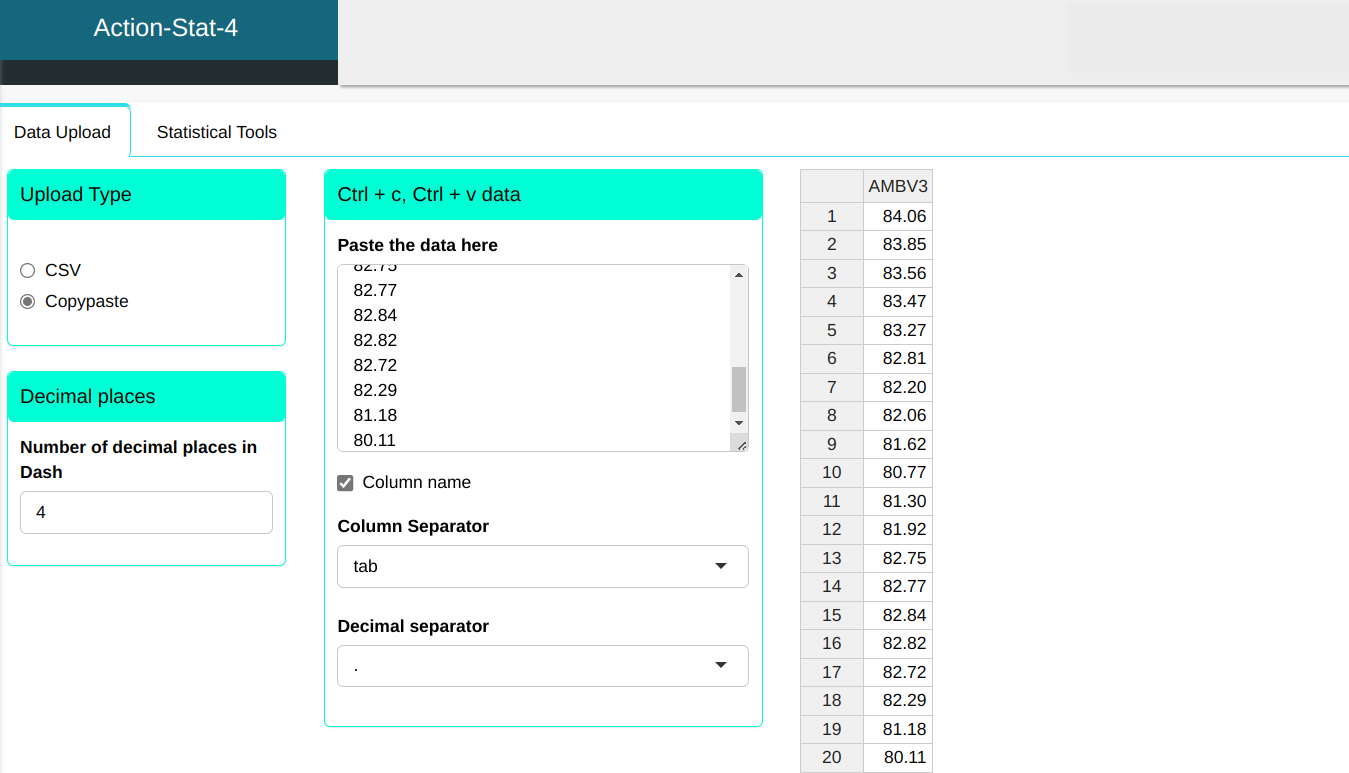
Analysis of the trend in 20 observations over time, of the financial asset AMBV3.
| AMBV3 |
|---|
| 84.06 |
| 83.85 |
| 83.56 |
| 83.47 |
| 83.27 |
| 82.81 |
| 82.2 |
| 82.06 |
| 81.62 |
| 80.77 |
| 81.3 |
| 81.92 |
| 82.75 |
| 82.77 |
| 82.84 |
| 82.82 |
| 82.72 |
| 82.29 |
| 81.18 |
| 80.11 |
We will upload the data to the system.
The trend analysis will be performed according to the configuration shown in the figure below.
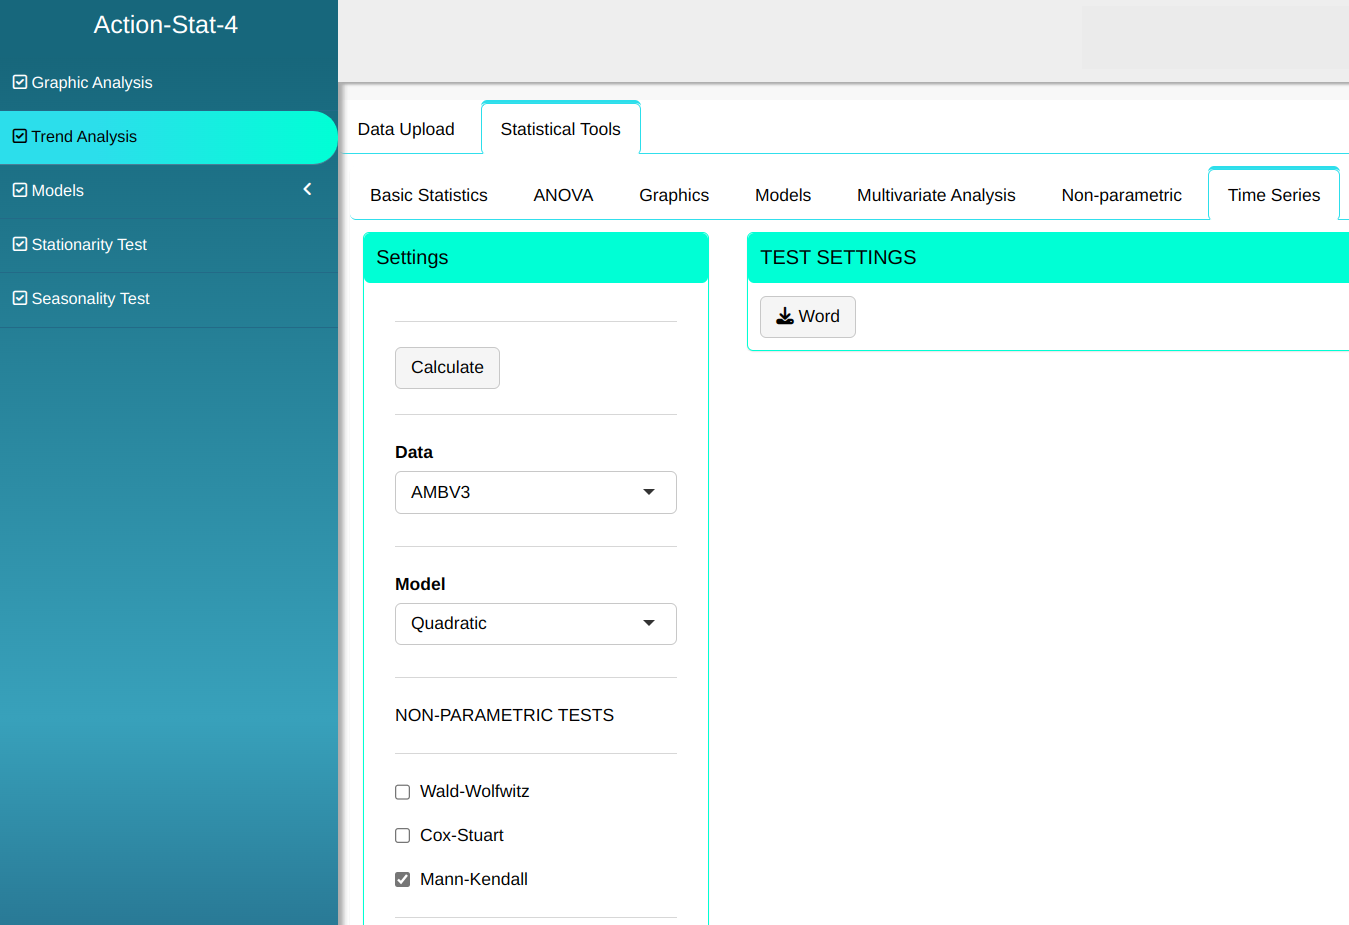

Then click Calculate to get the results and You can also generate the analyses and download them in Word format.

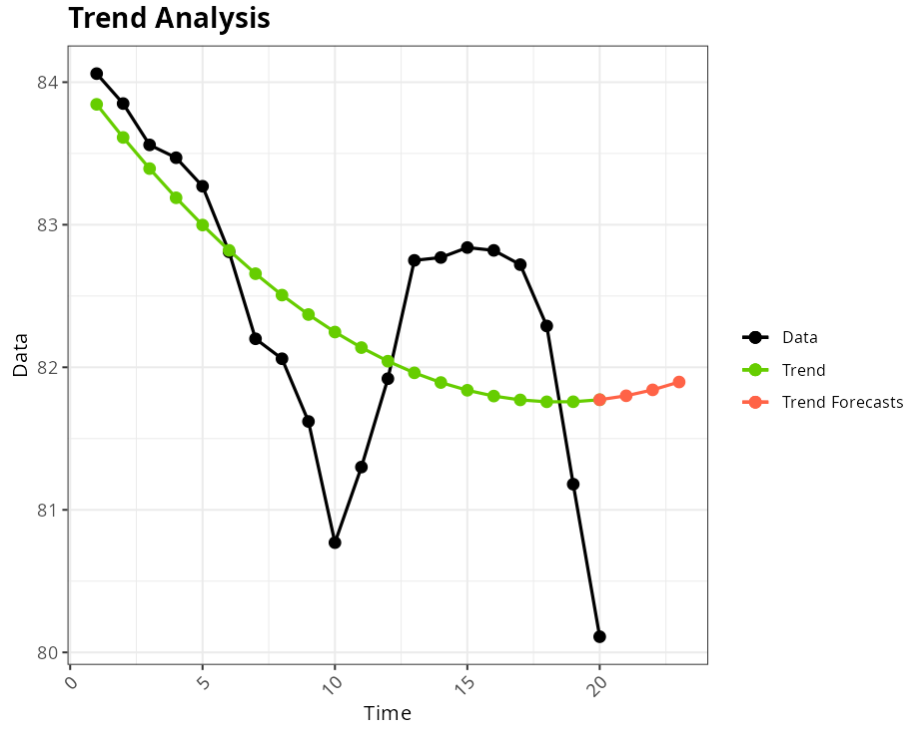
The results are:
Quadratic model
| Model (quadratic) | |
|---|---|
| Intercept | 84.090429825 |
| t | -0.252732399 |
| t^2 | 0.006841536 |
Accuracy Measurements
| V1 | |
|---|---|
| MAPE | 0.7739623 |
| MAD | 0.6342286 |
| MSD | 0.5936565 |
Results
| Data | Trend | Residuals | |
|---|---|---|---|
| 1 | 84.06 | 83.84454 | 0.21546104 |
| 2 | 83.85 | 83.61233 | 0.23766883 |
| 3 | 83.56 | 83.39381 | 0.16619355 |
| 4 | 83.47 | 83.18896 | 0.28103520 |
| 5 | 83.27 | 82.99781 | 0.27219378 |
| 6 | 82.81 | 82.82033 | -0.01033071 |
| 7 | 82.20 | 82.65654 | -0.45653828 |
| 8 | 82.06 | 82.50643 | -0.44642891 |
| 9 | 81.62 | 82.37000 | -0.75000262 |
| 10 | 80.77 | 82.24726 | -1.47725940 |
| 11 | 81.30 | 82.13820 | -0.83819925 |
| 12 | 81.92 | 82.04282 | -0.12282217 |
| 13 | 82.75 | 81.96113 | 0.78887184 |
| 14 | 82.77 | 81.89312 | 0.87688278 |
| 15 | 82.84 | 81.83879 | 1.00121064 |
| 16 | 82.82 | 81.79814 | 1.02185543 |
| 17 | 82.72 | 81.77118 | 0.94881716 |
| 18 | 82.29 | 81.75790 | 0.53209581 |
| 19 | 81.18 | 81.75831 | -0.57830861 |
| 20 | 80.11 | 81.77240 | -1.66239610 |
Trend Forecasts
| Results | |
|---|---|
| 20 | 81.77240 |
| 1 | 81.80017 |
| 2 | 81.84162 |
| 3 | 81.89676 |
Mann-Kendall
| V1 | |
|---|---|
| Statistics | -0.494736790657043 |
| P-Value | 0.0025502173230052 |
| Sample Size | 20 |
| Null Hypothesis | There is no trend |
| Alternative Hypothesis | There is a trend |