2. Arima
By presenting a good adjustment for different types of problems, the model Arima is undoubtedly one of the models of series temporal most used in practice.
Example:
Adjustment of the Arima(p,d,q) model for the AMBV3 dataset.
| AMBV3 |
|---|
| 84.06 |
| 83.85 |
| 83.56 |
| 83.47 |
| 83.27 |
| 82.81 |
| 82.20 |
| 82.06 |
| 81.62 |
| 80.77 |
| 81.30 |
| 81.92 |
| 82.75 |
| 82.77 |
| 82.84 |
| 82.82 |
| 82.72 |
| 82.29 |
| 81.18 |
| 80.11 |
| 80.27 |
| 80.21 |
| 79.92 |
| 79.96 |
| 80.19 |
| 80.17 |
| 80.17 |
| 79.85 |
| 81.00 |
| 80.44 |
| 79.96 |
| 79.85 |
| 79.82 |
| 80.11 |
| 80.20 |
| 80.31 |
| 81.18 |
| 80.81 |
| 81.15 |
| 81.32 |
| 81.21 |
| 81.40 |
| 81.10 |
| 81.40 |
| 82.27 |
| 82.15 |
| 81.78 |
| 81.69 |
| 81.34 |
| 81.88 |
We will upload the data to the system.

Configuring as shown in the figure below to we will carry out the analysis
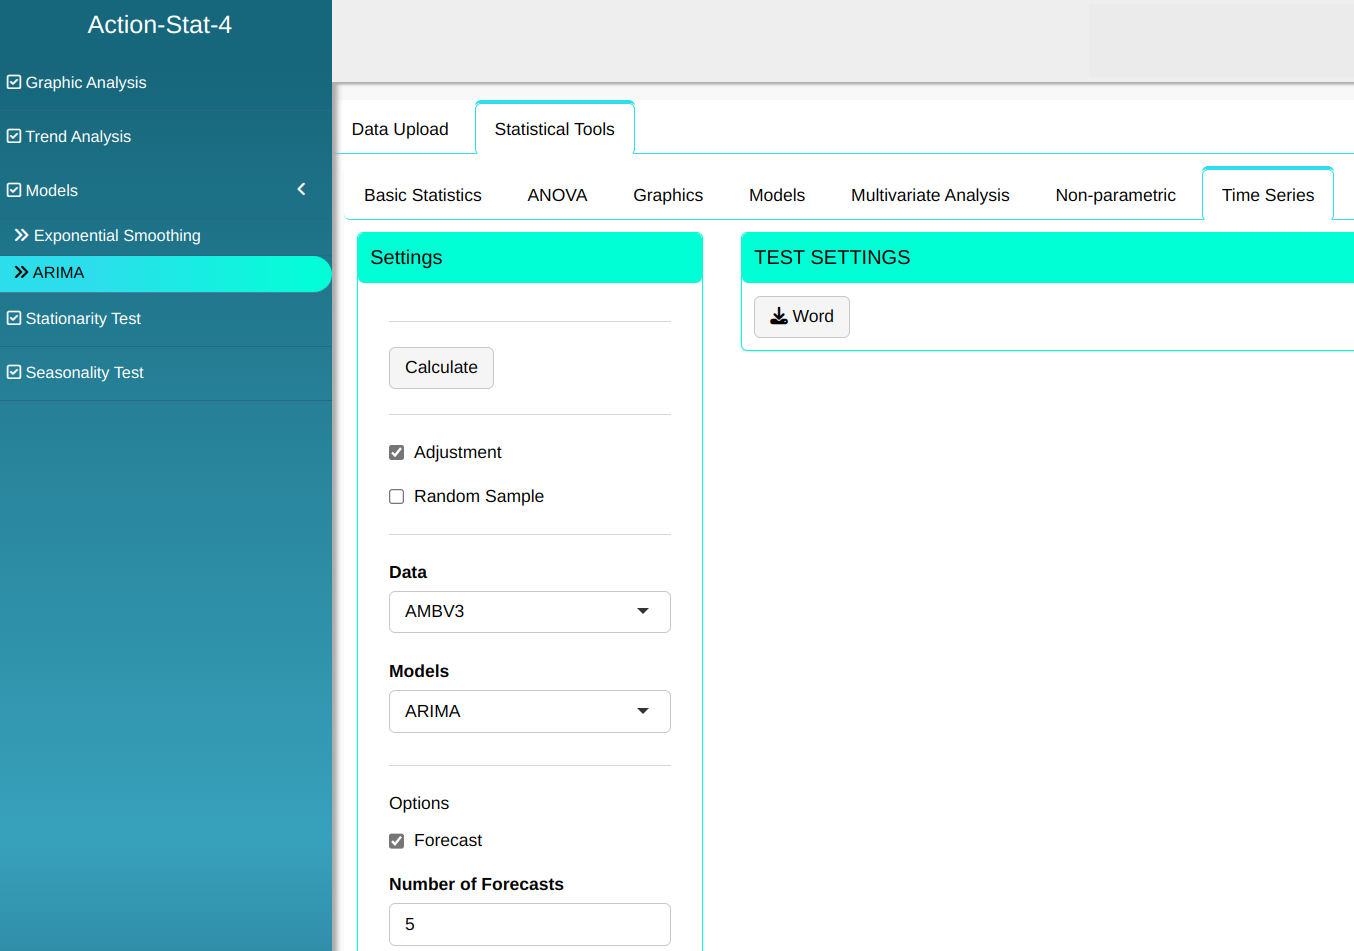

Then click Calculate to get the results. You can also generate the analyses and download them in Word format.
The results are:
Coefficients
| Values | |
|---|---|
| ar1 | 1.2991770 |
| ar2 | -0.3315352 |
| ma1 | -1.1432995 |
| ma2 | 0.1433067 |
Accuracy Measurements
| Values | |
|---|---|
| MAPE | 0.4195899 |
| MAD | 0.3415169 |
| MSD | 0.1980571 |
Results
| Data | Fit | Residuals |
|---|---|---|
| 84.06 | 83.97594 | 0.08405996 |
| 83.85 | 84.05419 | -0.20419184 |
| 83.56 | 83.80930 | -0.24929614 |
| 83.47 | 83.50654 | -0.03654120 |
| 83.27 | 83.45321 | -0.18320532 |
| 82.81 | 83.23766 | -0.42766339 |
| 82.20 | 82.73172 | -0.53171661 |
| 82.06 | 82.10190 | -0.04189500 |
| 81.62 | 82.04797 | -0.42797245 |
| 80.77 | 81.56606 | -0.79605654 |
| 81.30 | 80.66053 | 0.63947339 |
| 81.92 | 81.43665 | 0.48334558 |
| 82.75 | 82.09832 | 0.65168277 |
| 82.77 | 82.94994 | -0.17994385 |
| 82.84 | 82.81778 | 0.02222283 |
| 82.82 | 82.87305 | -0.05304950 |
| 82.72 | 82.83318 | -0.11317707 |
| 82.29 | 82.71394 | -0.42393938 |
| 81.18 | 82.22084 | -1.04083993 |
| 80.11 | 80.99494 | -0.88494483 |
| 80.27 | 79.94805 | 0.32195173 |
| 80.21 | 80.34001 | -0.13001000 |
| 79.92 | 80.26963 | -0.34962719 |
| 79.96 | 79.94210 | 0.01789635 |
| 80.19 | 80.03927 | 0.15073363 |
| 80.17 | 80.30572 | -0.13571517 |
| 80.17 | 80.24290 | -0.07290330 |
| 79.85 | 80.23729 | -0.38728594 |
| 81.00 | 79.87258 | 1.12742243 |
| 80.44 | 81.25721 | -0.81721024 |
| 79.96 | 80.41750 | -0.45750058 |
| 79.85 | 79.92551 | -0.07551215 |
| 79.82 | 79.88654 | -0.06654408 |
| 80.11 | 79.88400 | 0.22600473 |
| 80.20 | 80.22997 | -0.02997067 |
| 80.31 | 80.28719 | 0.02280863 |
| 81.18 | 80.39805 | 0.78194752 |
| 80.81 | 81.38372 | -0.57371613 |
| 81.15 | 80.80714 | 0.34286168 |
| 81.32 | 81.24309 | 0.07691003 |
| 81.21 | 81.38832 | -0.17831860 |
| 81.40 | 81.22568 | 0.17431784 |
| 81.10 | 81.45735 | -0.35734615 |
| 81.40 | 81.08071 | 0.31929431 |
| 82.27 | 81.47966 | 0.79033756 |
| 82.15 | 82.44500 | -0.29499787 |
| 81.78 | 82.15185 | -0.37185024 |
| 81.69 | 81.72017 | -0.03016952 |
| 81.34 | 81.67519 | -0.33518824 |
| 81.88 | 81.29572 | 0.58427699 |
Forecast
| Forecast | C.I. Min. 80% | C.I. Supp. 80% | C.I. Min. 95% | I.C. Supp. 95% | |
|---|---|---|---|---|---|
| 51 | 81.98464 | 81.4055 | 82.56379 | 81.09892 | 82.87037 |
| 52 | 82.02483 | 81.1348 | 82.91485 | 80.66365 | 83.38600 |
| 53 | 82.04233 | 80.9153 | 83.16937 | 80.31868 | 83.76599 |
| 54 | 82.05176 | 80.7357 | 83.36782 | 80.03902 | 84.06450 |
| 55 | 82.05820 | 80.5864 | 83.53000 | 79.80728 | 84.30913 |
