1. Exponential smoothing
The exponential smoothing model is a forecasting method based on the idea that past observations contain relevant information about the pattern of the time series.
Example:
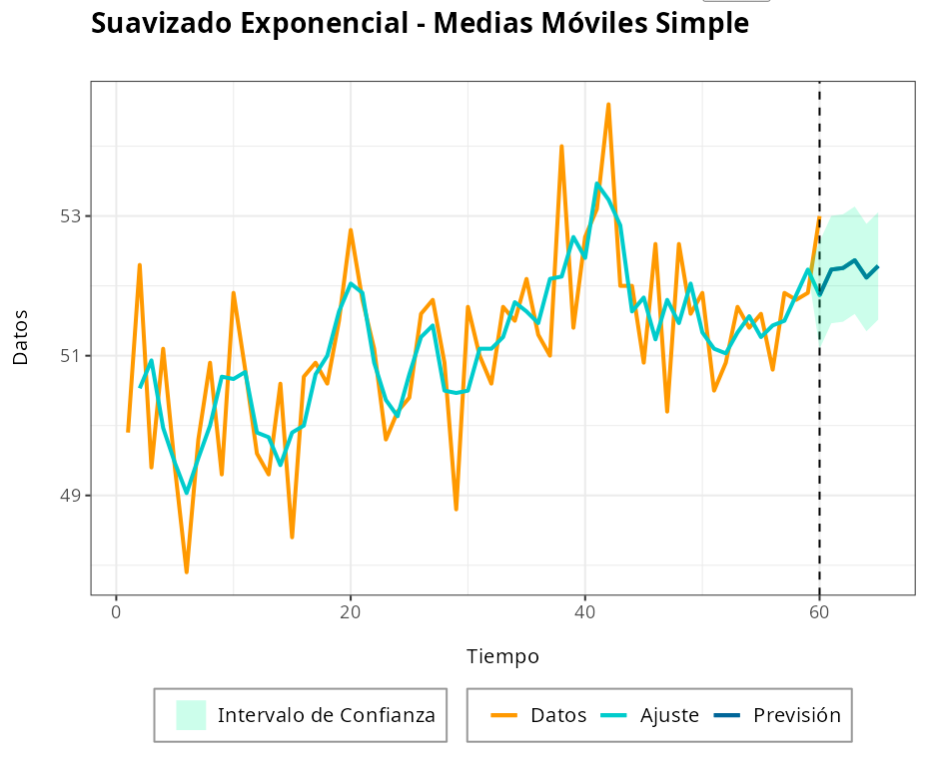
Consider data on annual average temperatures in New York City during the years 1912 and 1971. Let’s fit a simple moving average model to this time series and forecast the temperature for the next 5 years.
| Year | Temperature |
|---|---|
| 1912 | 49.9 |
| 1913 | 52.3 |
| 1914 | 49.4 |
| 1915 | 51.1 |
| 1916 | 49.4 |
| 1917 | 47.9 |
| 1918 | 49.8 |
| 1919 | 50.9 |
| 1920 | 49.3 |
| 1921 | 51.9 |
| 1922 | 50.8 |
| 1923 | 49.6 |
| 1924 | 49.3 |
| 1925 | 50.6 |
| 1926 | 48.4 |
| 1927 | 50.7 |
| 1928 | 50.9 |
| 1929 | 50.6 |
| 1930 | 51.5 |
| 1931 | 52.8 |
| 1932 | 51.8 |
| 1933 | 51.1 |
| 1934 | 49.8 |
| 1935 | 50.2 |
| 1936 | 50.4 |
| 1937 | 51.6 |
| 1938 | 51.8 |
| 1939 | 50.9 |
| 1940 | 48.8 |
| 1941 | 51.7 |
| 1942 | 51.0 |
| 1943 | 50.6 |
| 1944 | 51.7 |
| 1945 | 51.5 |
| 1946 | 52.1 |
| 1947 | 51.3 |
| 1948 | 51.0 |
| 1949 | 54.0 |
| 1950 | 51.4 |
| 1951 | 52.7 |
| 1952 | 53.1 |
| 1953 | 54.6 |
| 1954 | 52.0 |
| 1955 | 52.0 |
| 1956 | 50.9 |
| 1957 | 52.6 |
| 1958 | 50.2 |
| 1959 | 52.6 |
| 1960 | 51.6 |
| 1961 | 51.9 |
| 1962 | 50.5 |
| 1963 | 50.9 |
| 1964 | 51.7 |
| 1965 | 51.4 |
| 1966 | 51.7 |
| 1967 | 50.8 |
| 1968 | 51.9 |
| 1969 | 51.8 |
| 1970 | 51.9 |
| 1971 | 53.0 |
We will upload the data to the system.
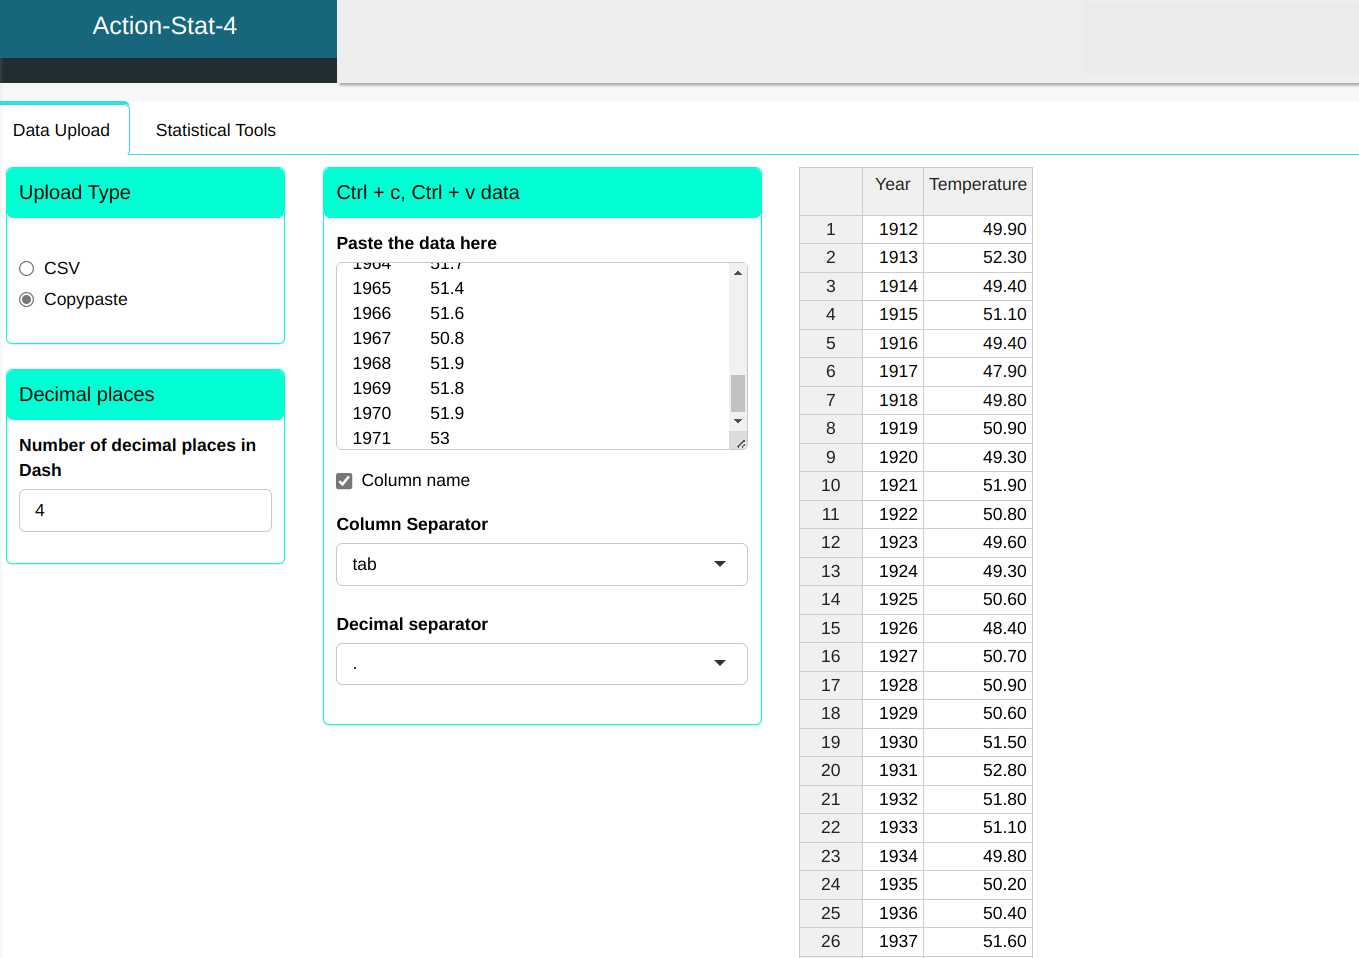
We will carry out the analysis.


By clicking on Calculate we obtain the results.

The results are:
Accuracy Measurements
| V1 | |
|---|---|
| MAPE | 1.3452617 |
| MAD | 0.6865497 |
| MSD | 0.6562963 |
Average length
| k |
| 3 |
Estimation table
| Data | Fit | Residuals |
|---|---|---|
| 49.9 | ||
| 52.3 | ||
| 49.4 | 50.53333 | -1.13333333 |
| 51.1 | 50.93333 | 0.16666667 |
| 49.4 | 49.96667 | -0.56666667 |
| 47.9 | 49.46667 | -1.56666667 |
| 49.8 | 49.03333 | 0.76666667 |
| 50.9 | 49.53333 | 1.36666667 |
| 49.3 | 50 | -0.7 |
| 51.9 | 50.7 | 1.2 |
| 50.8 | 50.66667 | 0.13333333 |
| 49.6 | 50.76667 | -1.16666667 |
| 49.3 | 49.9 | -0.6 |
| 50.6 | 49.83333 | 0.76666667 |
| 48.4 | 49.43333 | -1.03333333 |
| 50.7 | 49.9 | 0.8 |
| 50.9 | 50 | 0.9 |
| 50.6 | 50.73333 | -0.13333333 |
| 51.5 | 51 | 0.5 |
| 52.8 | 51.63333 | 1.16666667 |
| 51.8 | 52.03333 | -0.23333333 |
| 51.1 | 51.9 | -0.8 |
| 49.8 | 50.9 | -1.1 |
| 50.2 | 50.36667 | -0.16666667 |
| 50.4 | 50.13333 | 0.26666667 |
| 51.6 | 50.73333 | 0.86666667 |
| 51.8 | 51.26667 | 0.53333333 |
| 50.9 | 51.43333 | -0.53333333 |
| 48.8 | 50.5 | -1.7 |
| 51.7 | 50.46667 | 1.23333333 |
| 51 | 50.5 | 0.5 |
| 50.6 | 51.1 | -0.5 |
| 51.7 | 51.1 | 0.6 |
| 51.5 | 51.26667 | 0.23333333 |
| 52.1 | 51.76667 | 0.33333333 |
| 51.3 | 51.63333 | -0.33333333 |
| 51 | 51.46667 | -0.46666667 |
| 54 | 52.1 | 1.9 |
| 51.4 | 52.13333 | -0.73333333 |
| 52.7 | 52.7 | 0 |
| 53.1 | 52.4 | 0.7 |
| 54.6 | 53.46667 | 1.13333333 |
| 52 | 53.23333 | -1.23333333 |
| 52 | 52.86667 | -0.86666667 |
| 50.9 | 51.63333 | -0.73333333 |
| 52.6 | 51.83333 | 0.76666667 |
| 50.2 | 51.23333 | -1.03333333 |
| 52.6 | 51.8 | 0.8 |
| 51.6 | 51.46667 | 0.13333333 |
| 51.9 | 52.03333 | -0.13333333 |
| 50.5 | 51.33333 | -0.83333333 |
| 50.9 | 51.1 | -0.2 |
| 51.7 | 51.03333 | 0.66666667 |
| 51.4 | 51.33333 | 0.06666667 |
| 51.7 | 51.6 | 0.1 |
| 50.8 | 51.3 | -0.5 |
| 51.9 | 51.46667 | 0.43333333 |
| 51.8 | 51.5 | 0.3 |
| 51.9 | 51.86667 | 0.03333333 |
| 53 | 52.23333 | 0.76666667 |
Forecasts
| Lower limit of forecast | Forecast | Predicted upper limit |
|---|---|---|
| 51.09756 | 51.86667 | 52.63578 |
| 51.46422 | 52.23333 | 53.00244 |
| 51.48645 | 52.25556 | 53.02466 |
| 51.59756 | 52.36667 | 53.13578 |
| 51.34941 | 52.11852 | 52.88763 |
| 51.51608 | 52.28519 | 53.05429 |