4. Stationarity tests
Almost all the models proposed for time series have stationarity as an assumption. Therefore, a fundamental question is when a time series is stationary. In the Stationarity Tests tool, three tests are available to verify the stationarity of the series.
Example:
We will perform the test for the following data:
| AMBV3 |
|---|
| 84.06 |
| 83.85 |
| 83.56 |
| 83.47 |
| 83.27 |
| 82.81 |
| 82.20 |
| 82.06 |
| 81.62 |
| 80.77 |
| 81.30 |
| 81.92 |
| 82.75 |
| 82.77 |
| 82.84 |
| 82.82 |
| 82.72 |
| 82.29 |
| 81.18 |
| 80.11 |
| 80.27 |
| 80.21 |
| 79.92 |
| 79.96 |
| 80.19 |
| 80.17 |
| 80.17 |
| 79.85 |
| 81.00 |
| 80.44 |
| 79.96 |
| 79.85 |
| 79.82 |
| 80.11 |
| 80.20 |
| 80.31 |
| 81.18 |
| 80.81 |
| 81.15 |
| 81.32 |
| 81.21 |
| 81.40 |
| 81.10 |
| 81.40 |
| 82.27 |
| 82.15 |
| 81.78 |
| 81.69 |
| 81.34 |
| 81.88 |
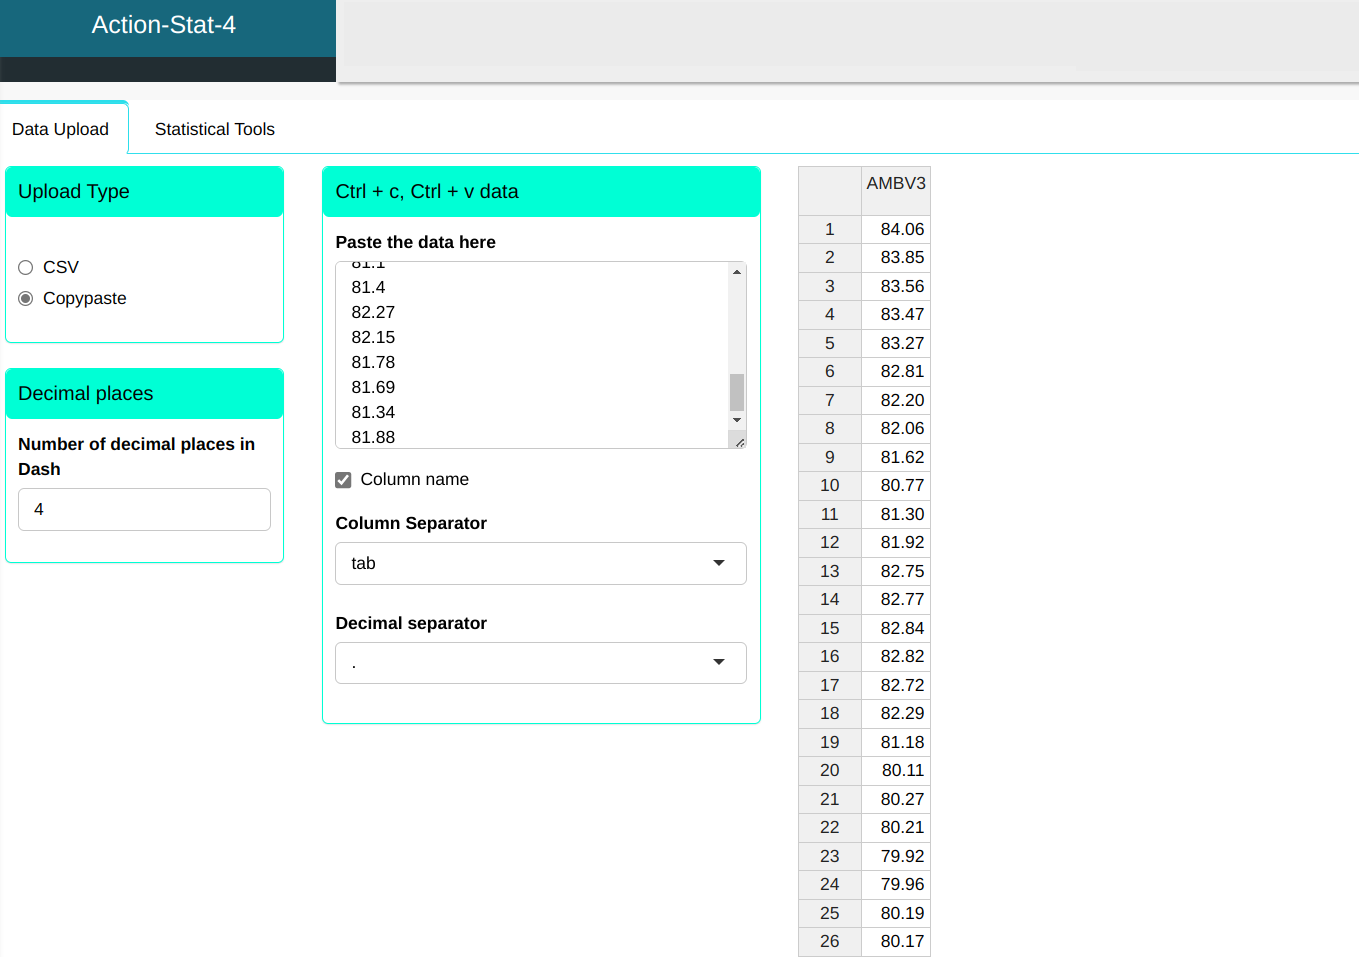
We will upload the data to the system.
Configuring as shown in the figure below to we will carry out the test.
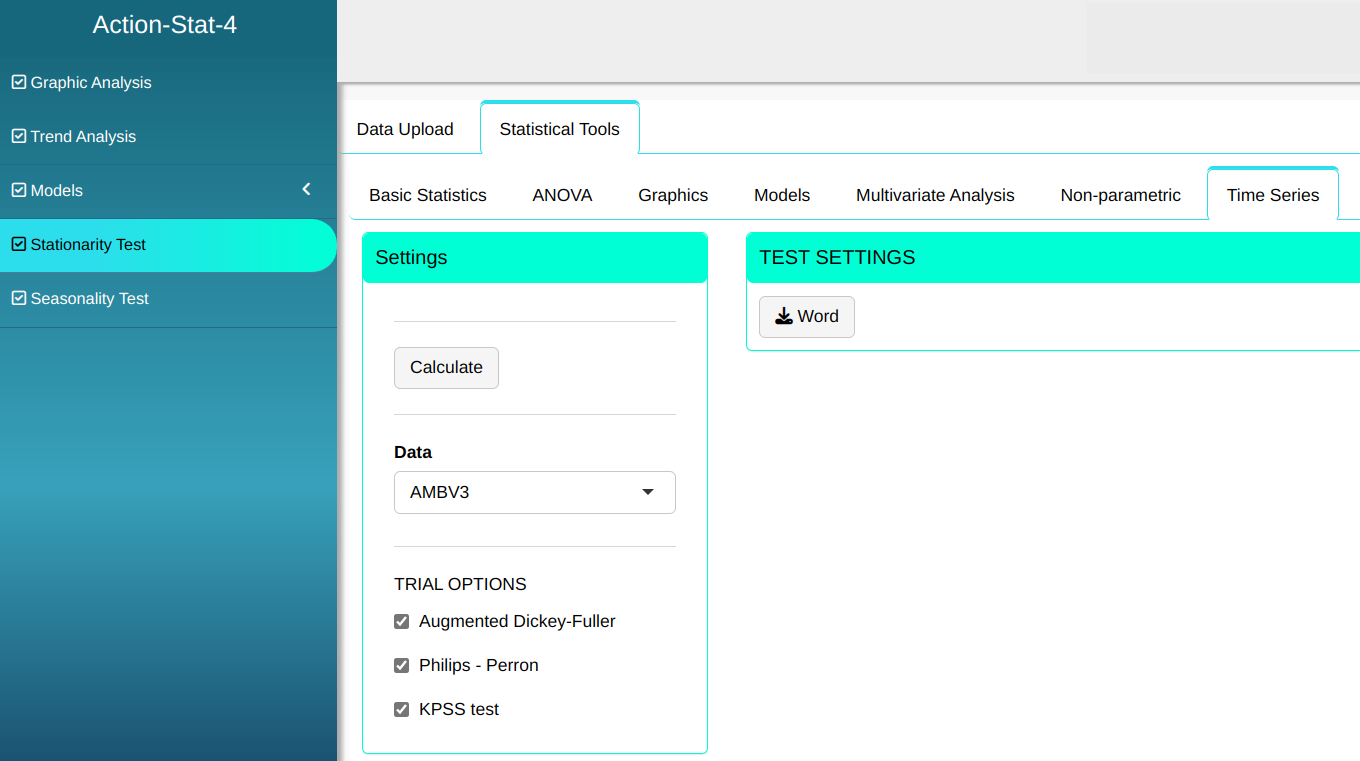
Then click Calculate to get the results. You can also generate the analyses and download them in Word format.
The results are:
Augmented Dickey-Fuller test
| Dickey-Fuller | |
|---|---|
| Statistics | -1.90501089436462 |
| P-value | 0.612390335192691 |
| Sample size | 50 |
| Null hypothesis | There is at least one unit root |
| Alternative hypothesis | There is no unit root |
Phillips-Perron test
| Dickey-Fuller Z(alpha) | |
|---|---|
| Statistics | -6.09026378709285 |
| P-value | 0.753893665311693 |
| Sample size | 50 |
| Null hypothesis | There is at least one unit root |
| Alternative hypothesis | There is no unit root |
KPSS Test
| KPSS Level | |
|---|---|
| Statistics | 0.540460035842587 |
| P-value | 0.0325540459813994 |
| Sample size | 50 |
| Null Hypothesis | The time series is stationary. |
| Alternative Hypothesis | The time series has a unit root. |