5. Seasonality Tests
Some time series exhibit a behavior known as seasonality. The seasonality of a time series is the number of observations the series takes to repeat the pattern. In the Tests tool of Seasonality, it is possible to carry out two tests to verify whether the series presents seasonality.
Example:
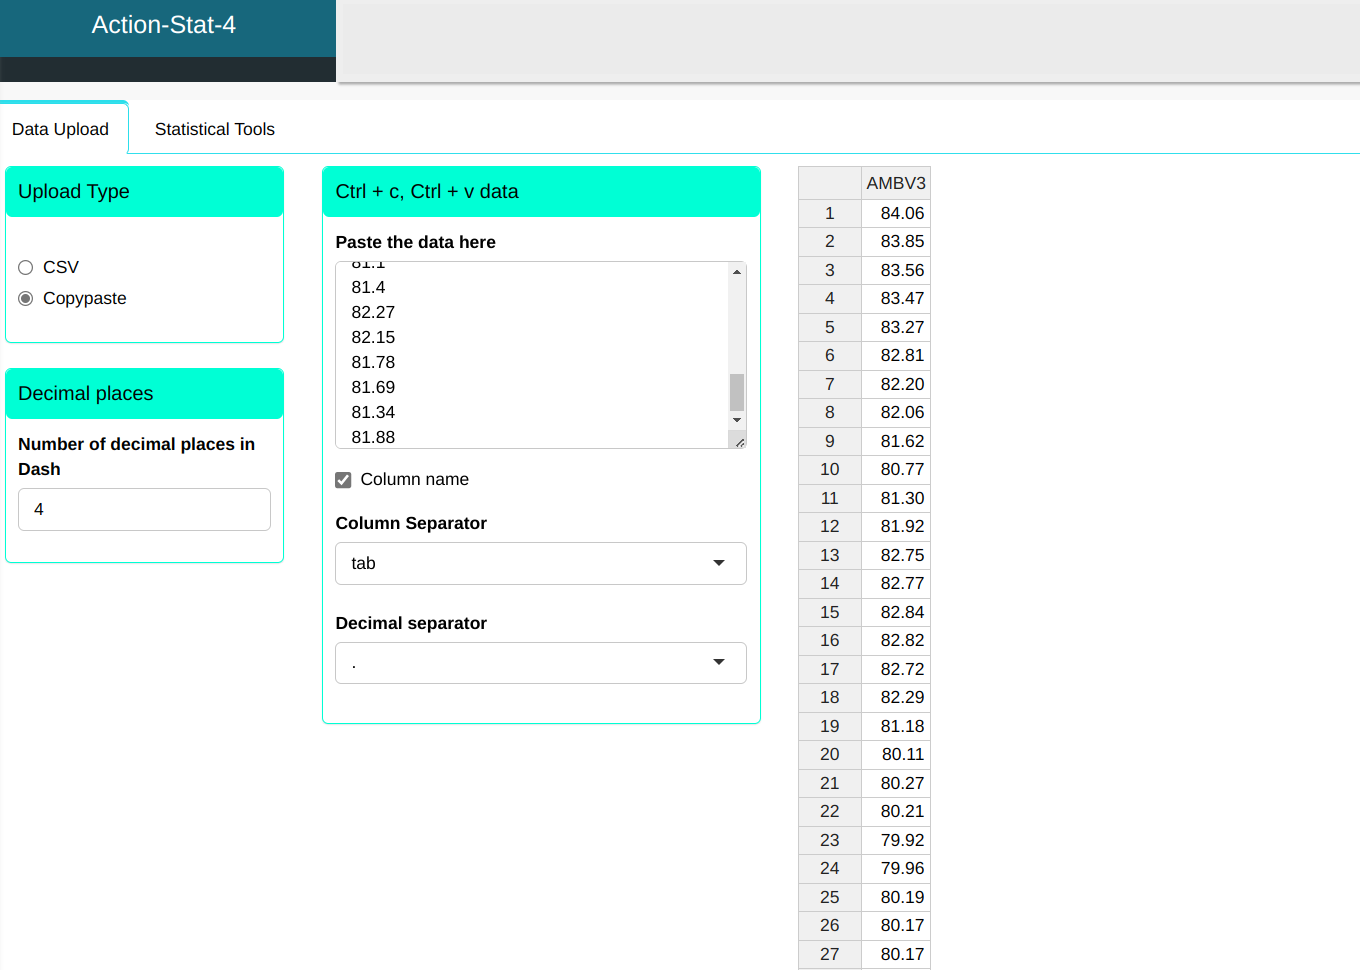
We will perform the test with the following data set:
| AMBV3 |
|---|
| 84.06 |
| 83.85 |
| 83.56 |
| 83.47 |
| 83.27 |
| 82.81 |
| 82.20 |
| 82.06 |
| 81.62 |
| 80.77 |
| 81.30 |
| 81.92 |
| 82.75 |
| 82.77 |
| 82.84 |
| 82.82 |
| 82.72 |
| 82.29 |
| 81.18 |
| 80.11 |
| 80.27 |
| 80.21 |
| 79.92 |
| 79.96 |
| 80.19 |
| 80.17 |
| 80.17 |
| 79.85 |
| 81.00 |
| 80.44 |
| 79.96 |
| 79.85 |
| 79.82 |
| 80.11 |
| 80.20 |
| 80.31 |
| 81.18 |
| 80.81 |
| 81.15 |
| 81.32 |
| 81.21 |
| 81.40 |
| 81.10 |
| 81.40 |
| 82.27 |
| 82.15 |
| 81.78 |
| 81.69 |
| 81.34 |
| 81.88 |
We will upload the data to the system.
Configuring as shown in the figure below to we will carry out the test.
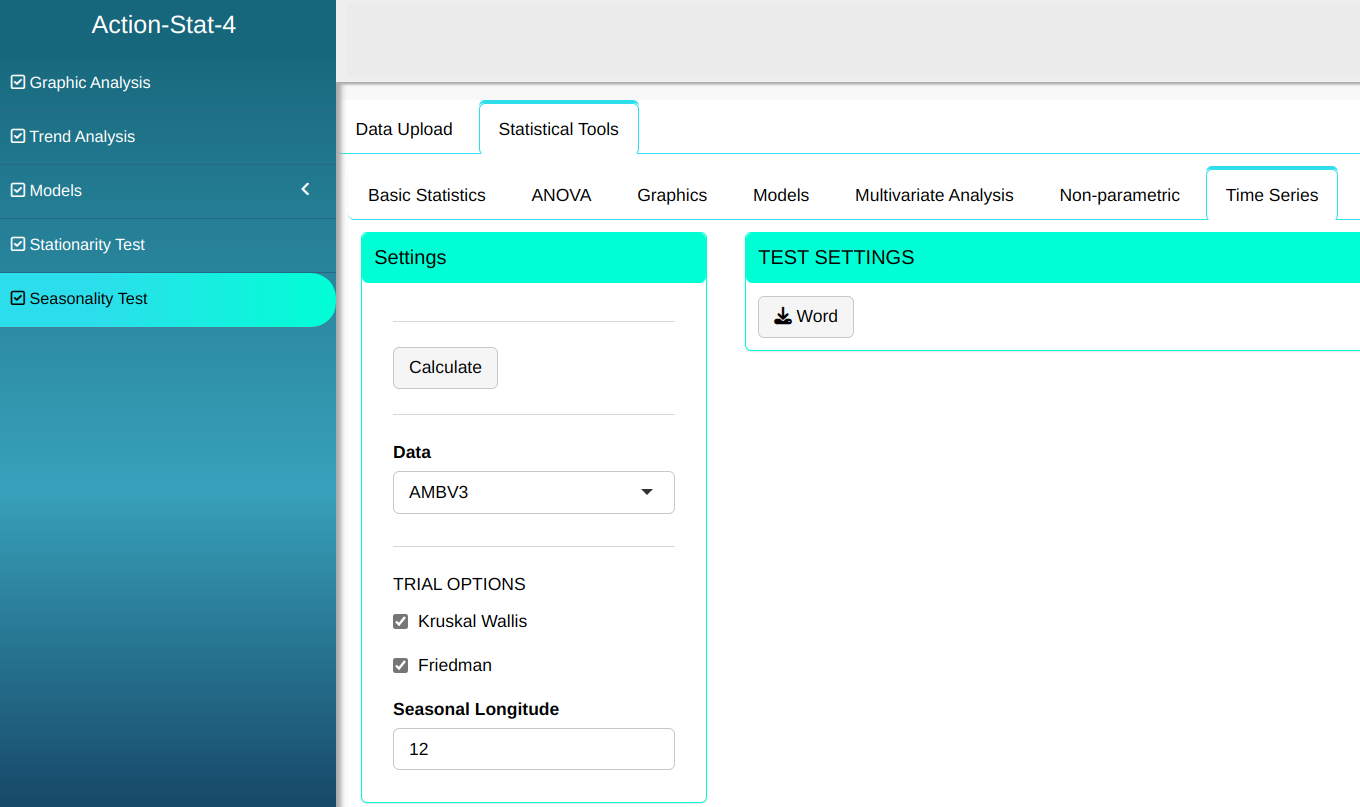
Then click Calculate to get the results. You can also generate the analyses and download them in Word format.
The results are:
Kruskal-Wallis test
| Kruskal-Wallis chi-squared | |
|---|---|
| Statistics | 28.0688775510204 |
| P-Value | 0.003159616205745 |
| Sample Size | 50 |
| Seasonal Length | 12 |
| Null Hypothesis | There is no deterministic seasonality |
| Alternative Hypothesis | There is deterministic seasonality |
Friedman test
| Friedman chi-squared | |
|---|---|
| Statistics | 24.6153846153846 |
| P-Value | 0.0103740819044975 |
| Sample Size | 50 |
| Seasonal Length | 12 |
| Null Hypothesis | There is no deterministic seasonality |
| Alternative Hypothesis | There is deterministic seasonality |