4. Anova
ANOVA is a method used to test for significant differences between the means of groups of data. It is frequently applied in experimental research to compare the effects of different treatments. The test calculates the F-statistic, which corresponds to the ratio between the variation between groups and the variation within groups.
Example 1:
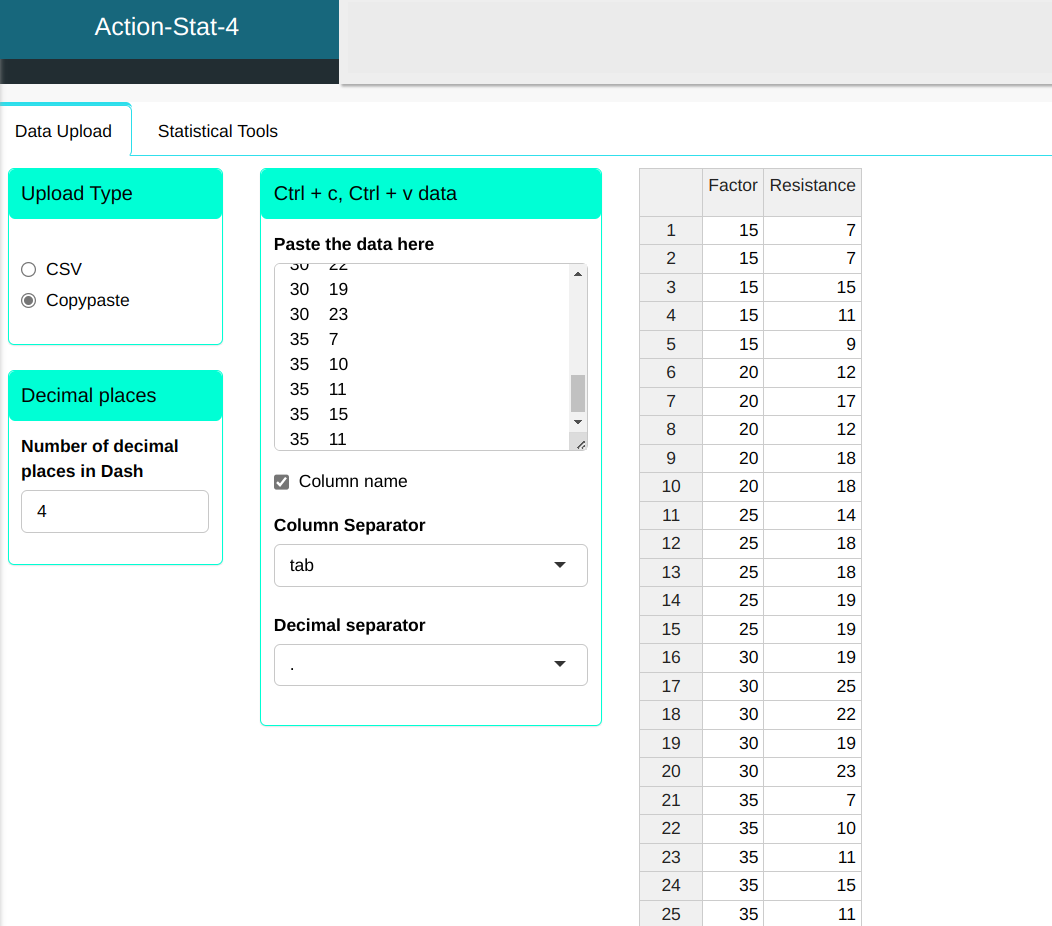
Consider the production process of a synthetic fiber, where the experimenter wants to know the influence of the percentage of cotton on fiber strength. For this, an experiment was carried out completely randomized, where different levels of cotton percentage were evaluated with respect to fiber resistance. An important point in setting up the experiment is that for each factor level (percentage of cotton), the other factors that influence the process must present a homogeneous pattern of variability. In the experiment, we take 5 levels for cotton percentage and 5 replications. The values are in table below:
| Factor | Resistance |
|---|---|
| 15 | 7 |
| 15 | 7 |
| 15 | 1 |
| 15 | 11 |
| 15 | 9 |
| 20 | 12 |
| 20 | 17 |
| 20 | 12 |
| 20 | 18 |
| 20 | 18 |
| 25 | 14 |
| 25 | 18 |
| 25 | 18 |
| 25 | 19 |
| 25 | 19 |
| 30 | 19 |
| 30 | 25 |
| 30 | 22 |
| 30 | 19 |
| 30 | 23 |
| 35 | 7 |
| 35 | 10 |
| 35 | 11 |
| 35 | 15 |
| 35 | 11 |
| $\quad$ | ||
|---|---|---|
| Number of levels | Observation by level | Standard deviation |
| $\quad\qquad$ 5 | $\quad\qquad$ 5 | $\quad$5.151698749 |
We will upload the data to the system.
Configuring as shown in the figure below to we will carry out the analysis
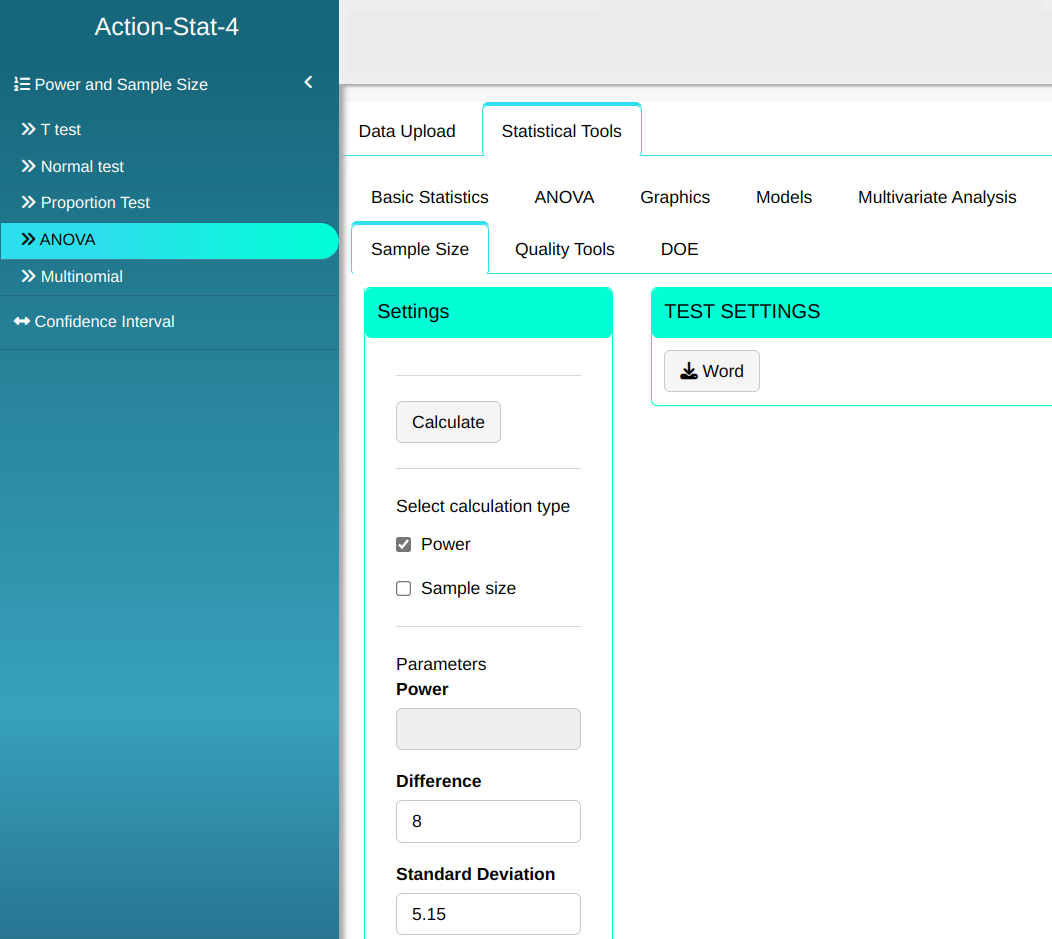

Then click Calculate we obtain the results. You can also generate the analyses and download them in Word format.
The results are:
Power and Sample Size - ANOVA
| V1 | |
|---|---|
| Power | 0.3812579 |
| Levels | 5.0000000 |
| Replica | 5.0000000 |
| Difference | 8.0000000 |
| Standard deviation | 5.1500000 |
| Significance level | 0.0500000 |
So we conclude that at a significance level $\alpha$ = 0.05, the test has a power of approximately 38.1%.
Example 2:
In the previous example, calculate the minimum number of replicas for the test detects a difference $\Delta$ = 8 with a power of at least 0.9.
| Factor | Resistance |
|---|---|
| 15 | 7 |
| 15 | 7 |
| 15 | 1 |
| 15 | 11 |
| 15 | 9 |
| 20 | 12 |
| 20 | 17 |
| 20 | 12 |
| 20 | 18 |
| 20 | 18 |
| 25 | 14 |
| 25 | 18 |
| 25 | 18 |
| 25 | 19 |
| 25 | 19 |
| 30 | 19 |
| 30 | 25 |
| 30 | 22 |
| 30 | 19 |
| 30 | 23 |
| 35 | 7 |
| 35 | 10 |
| 35 | 11 |
| 35 | 15 |
| 35 | 11 |
We will upload the data to the system.
Configuring as shown in the figure below to we will carry out the analysis
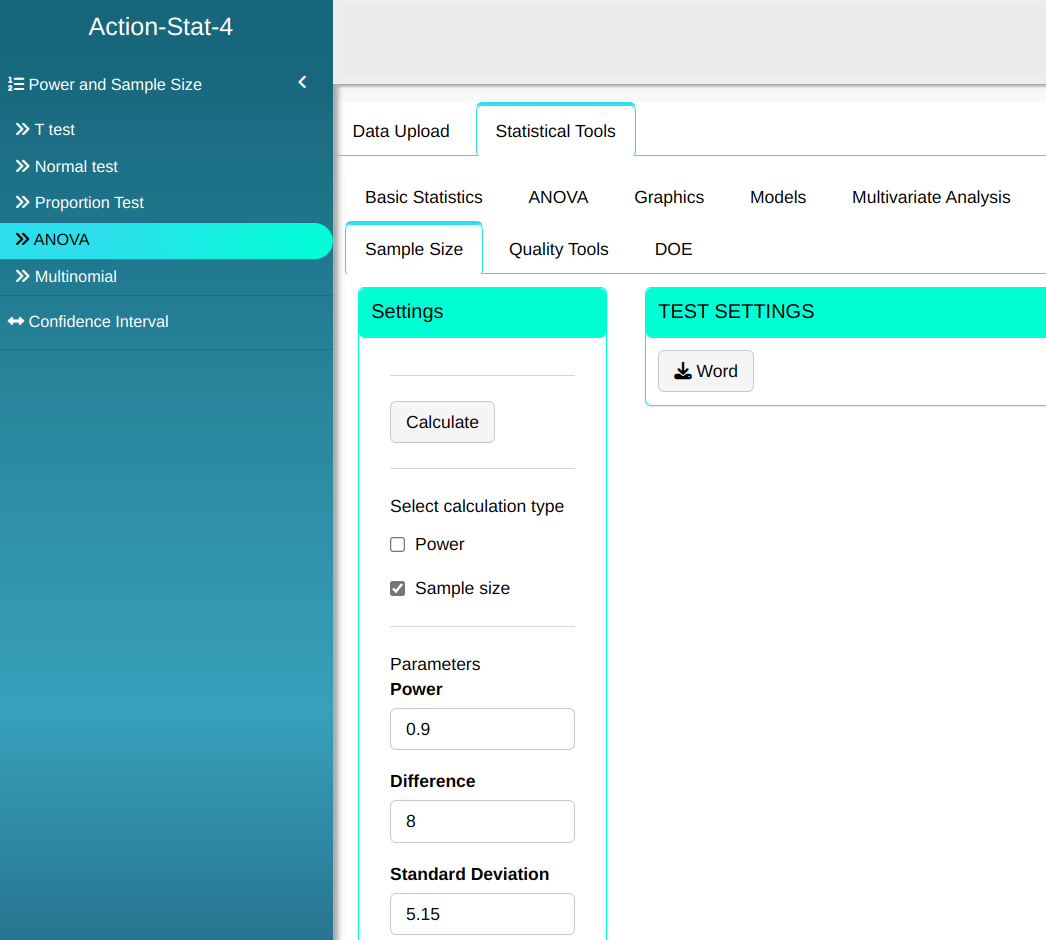

Then click Calculate we obtain the results. You can also generate the analyses and download them in Word format.
The results are:
Power and Sample Size - ANOVA
| V1 | |
|---|---|
| Power | 0.90 |
| Levels | 5.00 |
| Replica | 14.00 |
| Difference | 8.00 |
| Standard deviation | 5.15 |
| Significance level | 0.05 |
So we conclude that 14 replications are needed for the test to have a power of 90%