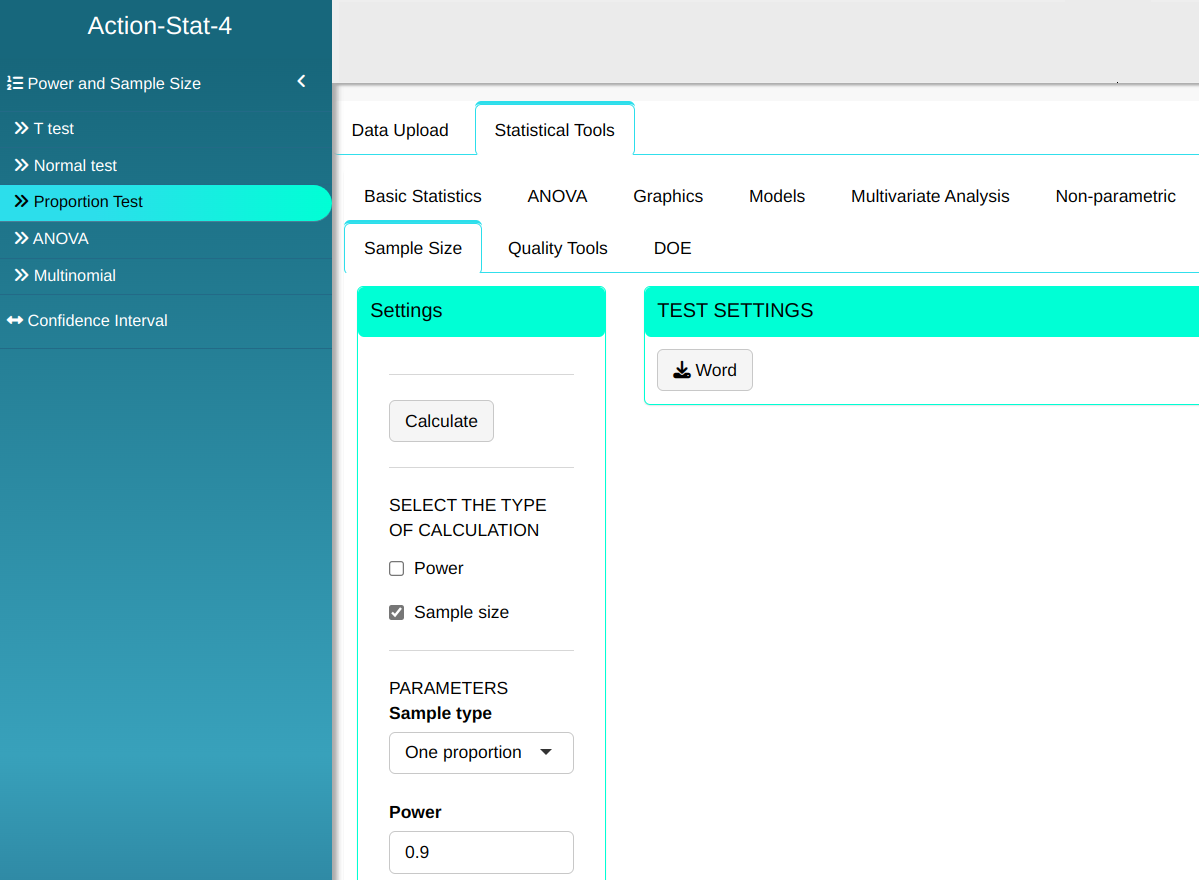
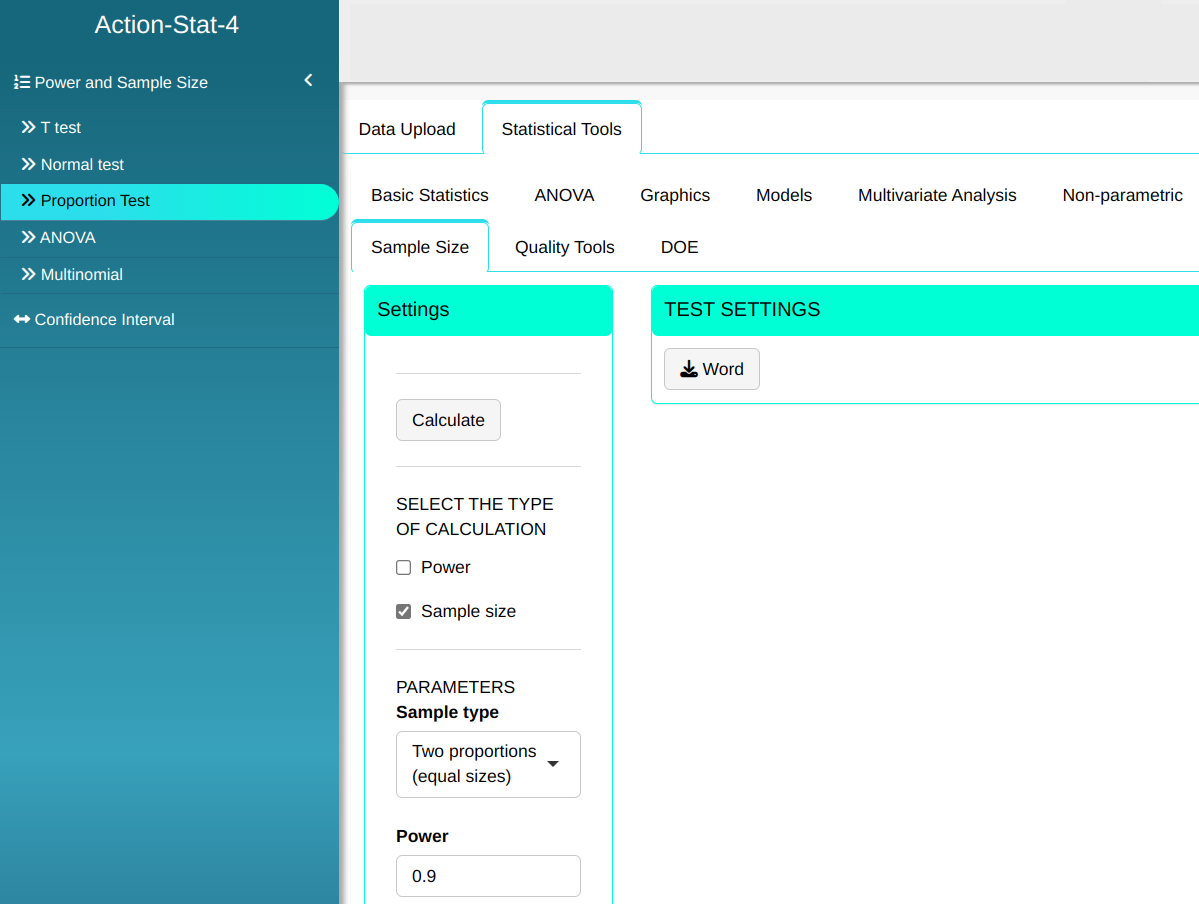
3. Proportion Test
Here the test of a proportion is used to calculate the power of the test or the sample size.
Example 1:
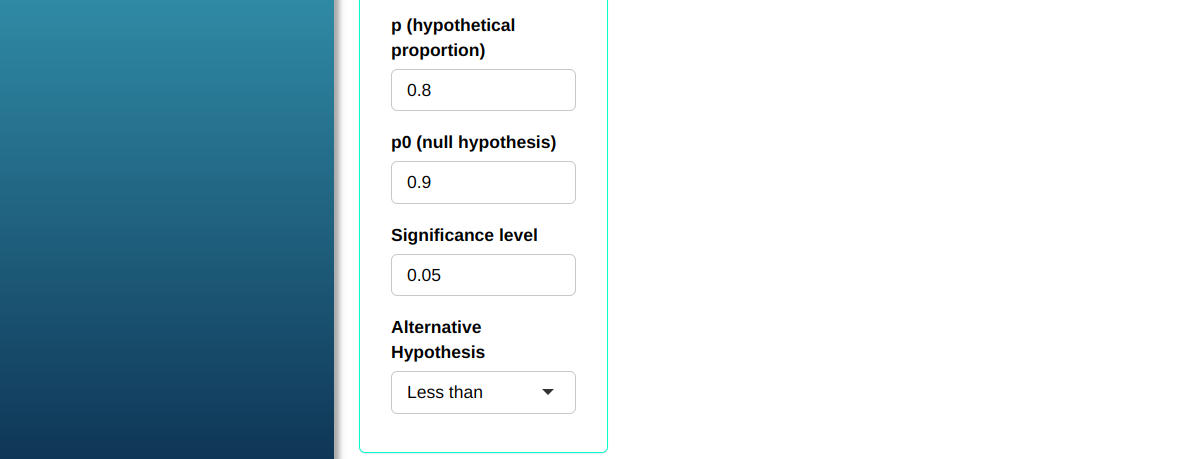
A manufacturer guarantees that 90% of the pieces it supplies to the production line of a certain factory is in agreement the required specifications. Analysis of a sample of 200 pieces revealed 25 defective. Calculate the power of the test to detect the difference between the proportion $p_0$ = 0.9 of the null hypothesis and a real proportion p = 0.8 at a significance level of 5%.
We use the data from the table below:
| $\mathbf{n}$ | $\mathbf{\alpha}$ | $\mathbf{p}$ | $\mathbf{p_0}$ |
| 200 | 0.05 | 0.8 | 0.9 |

Then click Calculate we obtain the results. You can also generate the analyses and download them in Word format.

Analysis Results
| Warning | |
| Power | 0.9910723 |
| Sample size | 200 |
| p | 0.8 |
| p0 | 0.9 |
| Significance Level | 0.05 |
| Alternative Hypothesis | Lower than |
With this, we conclude that the test has a power of approximately 99.1% in detecting a difference between the proportion of the null hypothesis $p_0$ = 0. and a possible real proportion p = 0.8.
Example 2:
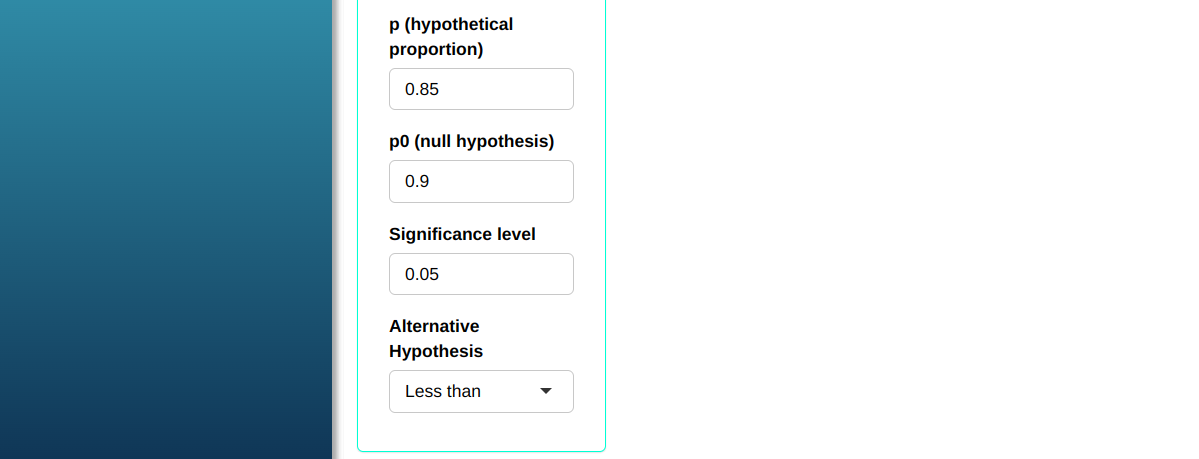
A manufacturer guarantees that 90% of the pieces it supplies to the production line of a certain factory is in agreement the required specifications. Analysis of a sample of 200 pieces revealed 25 defective. Calculate the sample size needed for the test to have a power of at least 0.9 in detecting the difference between the proportion of the null hypothesis $p_0$ = 0.9 and a possible real proportion of 0.85.
We use the data from the table below:
| $\mathbf{Poder}$ | $\mathbf{\alpha}$ | $\mathbf{p}$ | $\mathbf{p_0}$ |
| 0.9 | 0.05 | 0.85 | 0.9 |
Then click Calculate we obtain the results. You can also generate the analyses and download them in Word format.
Analysis Results
| Warning | |
| Power | 0.9 |
| Sample size | 372 |
| Hypothetical Proportion | 0.85 |
| Proportion | 0.9 |
| Significance Level | 0.05 |
| Alternative Hypothesis | Lower than |
Example 3:
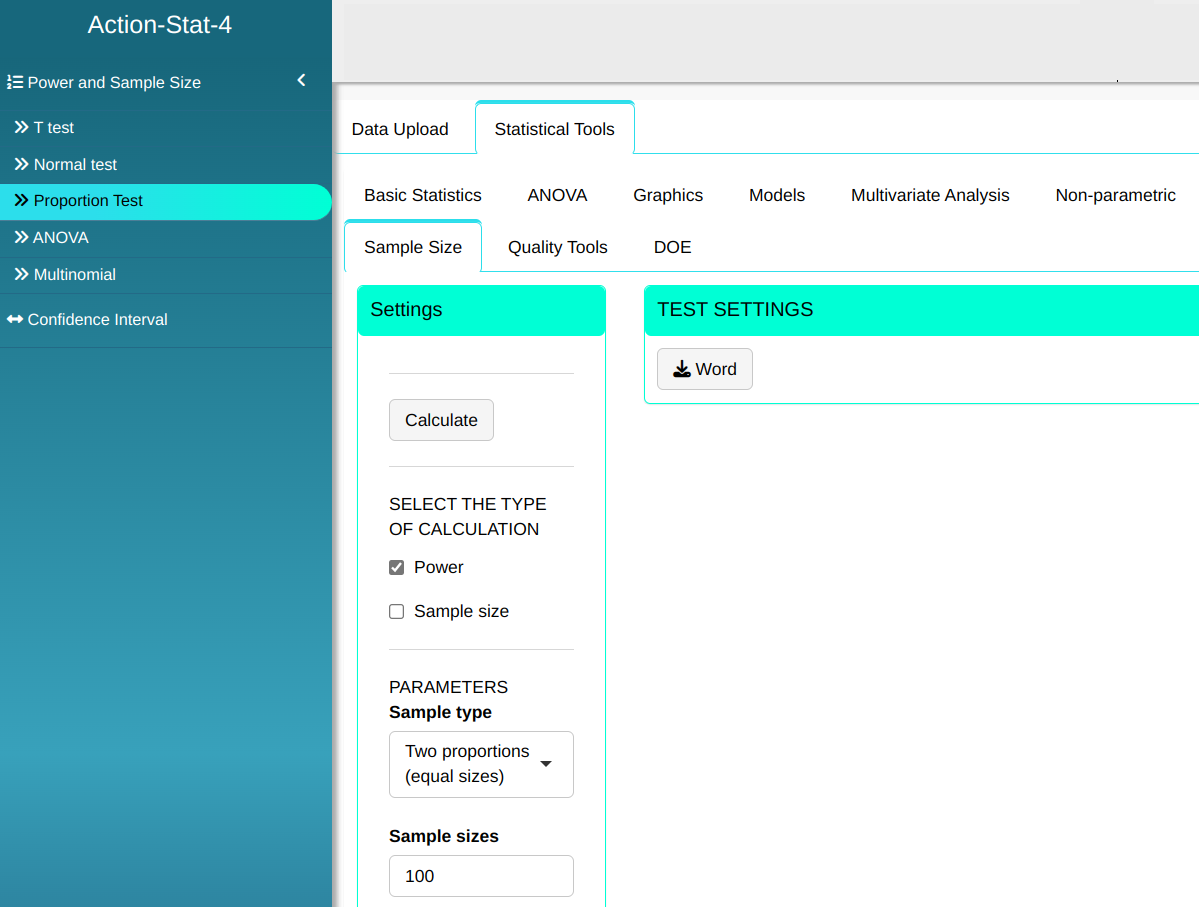
Given two samples of sizes $n_1$ = 100, $n_2$ = 100, calculate the power of the test of two proportions in detecting the two real proportions $p_1$ = 0.88 and $p_2$ = 0.70 of each sample with significance level $\alpha$ = 0.05.
We use the data from the table below:
| $\mathbf{n_1}$ | $\mathbf{n_2}$ | $\mathbf{\alpha}$ | $\mathbf{p_1}$ | $\mathbf{p_2}$ |
| 100 | 100 | 0.05 | 0.88 | 0.70 |

Then click Calculate we obtain the results. You can also generate the analyses and download them in Word format.
Analysis Results
| Warning | |
| Power | 0.8915324 |
| Sample size | 100 |
| p1 | 0.88 |
| p2 | 0.7 |
| Significance Level | 0.05 |
| Alternative Hypothesis | different |
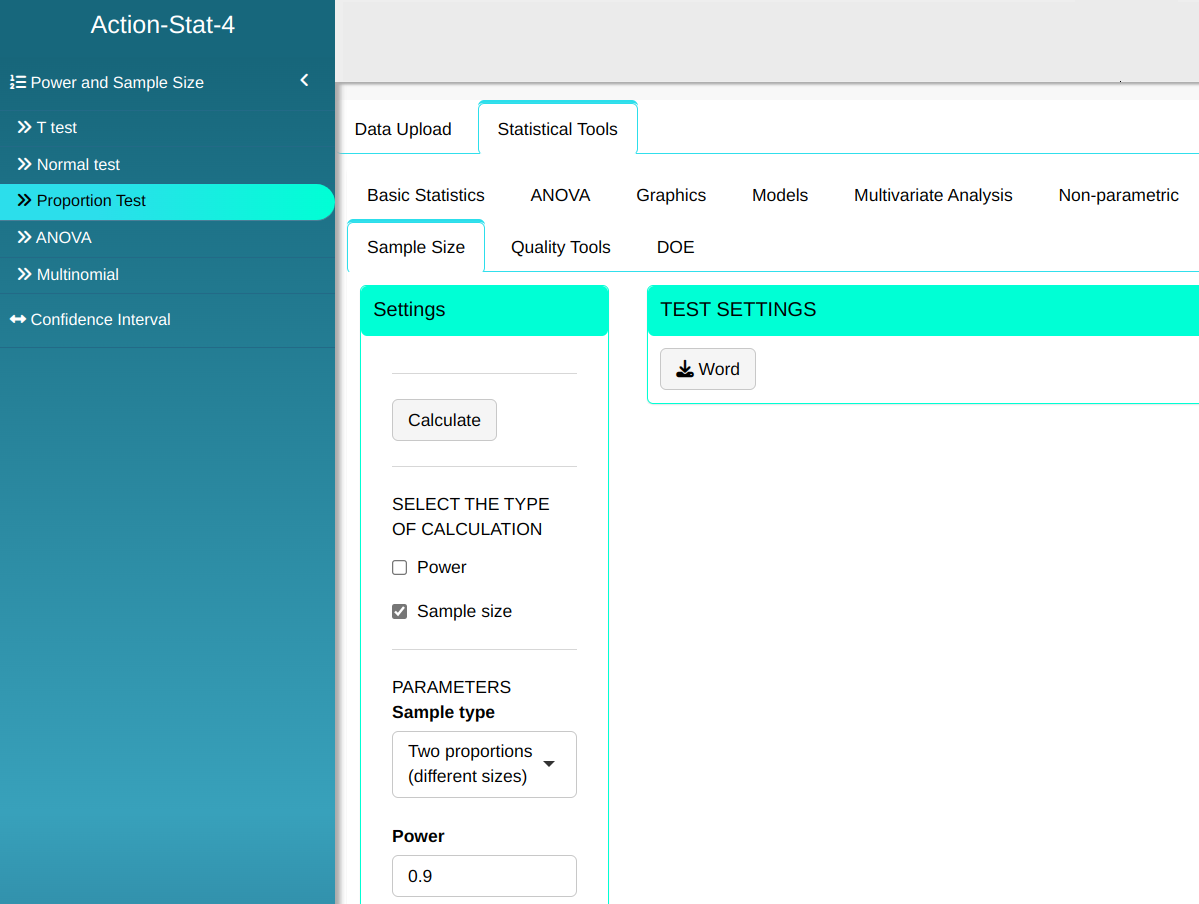
Example 4:
Calculate the size of two samples so that the test of two proportions detects the two real proportions p1 = 0.88 and p2 = 0.80 with a power of at a minimum 0.9 at significance level α = 0.05.
We use the data from the table below:
| $\mathbf{Poder}$ | $\mathbf{\alpha}$ | $\mathbf{p_1}$ | $\mathbf{p_2}$ |
| 0.9 | 0.05 | 0.88 | 0.80 |

Then click Calculate we obtain the results. You can also generate the analyses and download them in Word format.
Analysis Results
| Warning | |
| Power | 0.9 |
| Sample size | 435 |
| p1 | 0.88 |
| p2 | 0.8 |
| Significance level | 0.05 |
| Alternative Hypothesis | different |
Example 5:
Given two samples of sizes $n_1$ = 100, $n_2$ = 100, calculate the power of the test of two proportions to detect the two true proportions $p_1$ = 0.88 and $p_2$ = 0.70 from each sample with significance level $\alpha$ = 0.05.
We use the data from the table below:
| $\mathbf{n_1}$ | $\mathbf{n_2}$ | $\mathbf{\alpha}$ | $\mathbf{p_1}$ | $p_2$ |
| 100 | 120 | 0.05 | 0.88 | 0.70 |
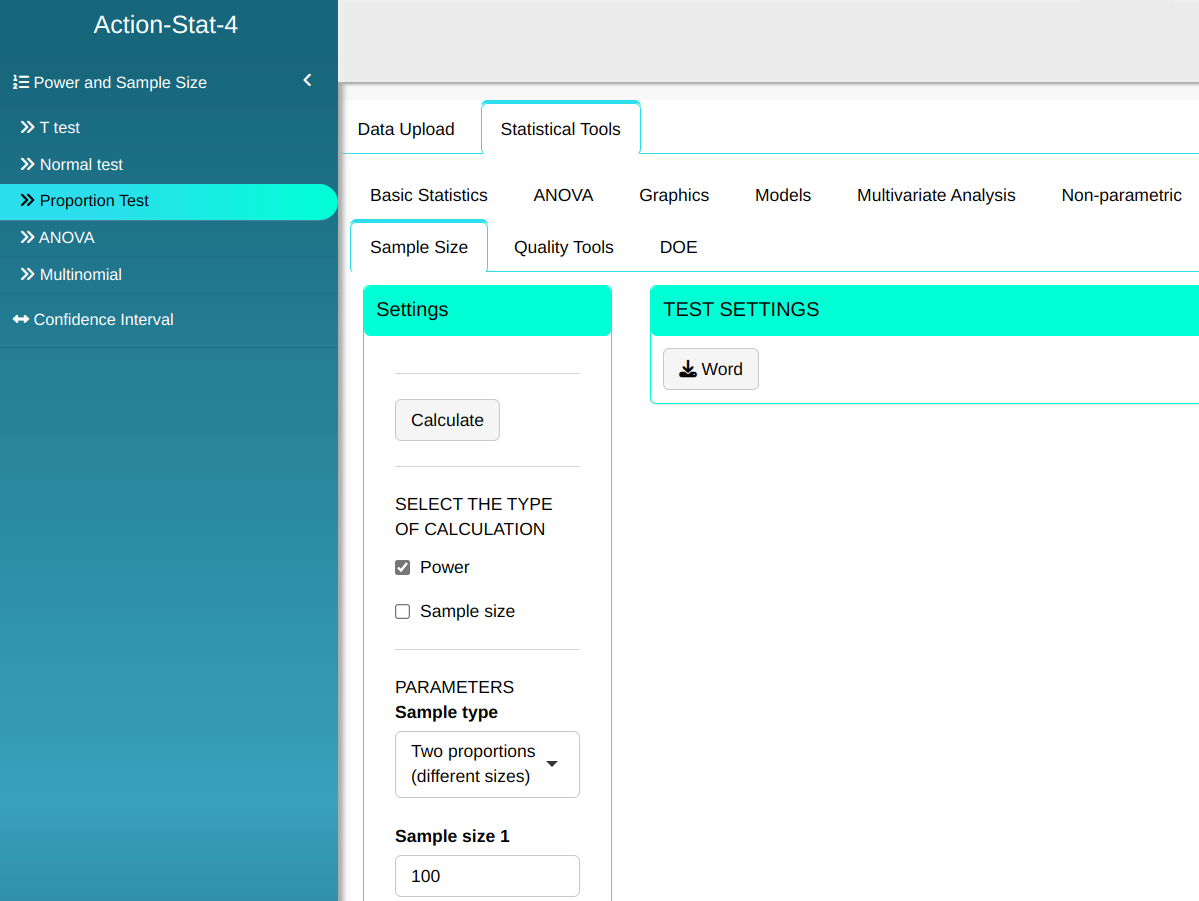
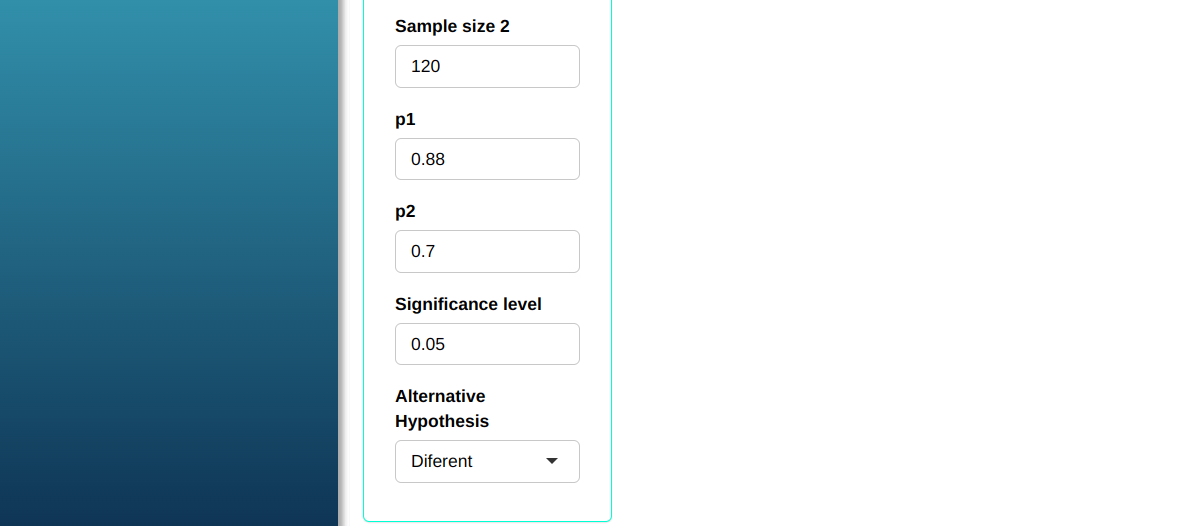
Then click Calculate we obtain the results. You can also generate the analyses and download them in Word format.
Analysis Results
| Warning | |
| Power | 0.9157088 |
| Sample size 1 | 100 |
| Sample size 2 | 120 |
| p1 | 0.88 |
| p2 | 0.7 |
| Significance level | 0.05 |
| Alternative Hypothesis | Different |
Example 6:
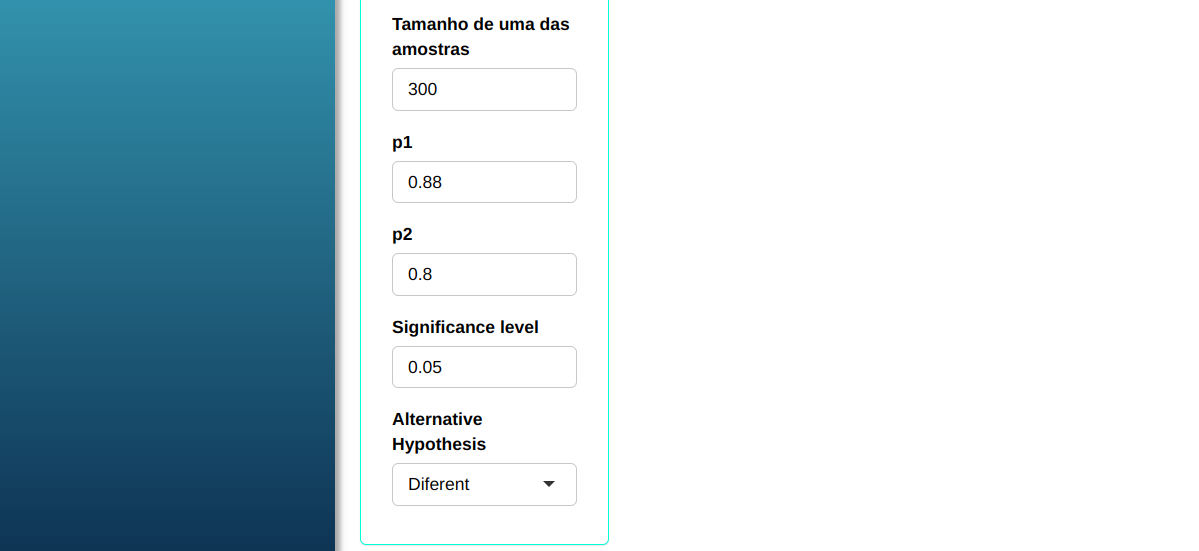
Given a sample size of $n_1$ = 300, calculate the size of the other sample so that the test of two proportions detects the two real proportions $p_1$ = 0.88 and $p_2$ = 0.80 with a power of at a minimum 0.9 and a significance level of $\alpha$ = 0.05
We use the data from the table below:
| $\mathbf{Poder}$ | $\mathbf{\alpha}$ | $\mathbf{p_1}$ | $\mathbf{p_2}$ | $\mathbf{n_1}$ |
| 0.9 | 0.05 | 0.88 | 0.80 | 300 |
Then click Calculate we obtain the results. You can also generate the analyses and download them in Word format.
Analysis Results
| Warning | |
| Power | 0.9 |
| Sample size 1 | 300 |
| Sample size 2 | 791 |
| p1 | 0.88 |
| p2 | 0.8 |
| Significance level | 0.05 |
| Alternative Hypothesis | Different |